By:
NAILA JAUHARA
NIM. 108014000052
DEPARTMENT OF ENGLISH EDUCATION
FACULTY OF
TARBIYAH AND TEACHERS’ TRAINING
SYARIF HIDAYATULLAH STATE ISLAMIC UNIVERSITY
JAKARTA
i
Education, Faculty of Tarbiyah and Teachers’ Training, Syarif Hidayatullah State Islamic University of Jakarta.2014.
The objective of this research was to describe the empirical evidence about the influence of computer assisted language learning on students’ listening skill for the first grade students at SMK Yaspia Jakarta academic year 2013/2014. The experimental study applied in X AP 1 class, and for the controlled class used X AP 2 class. The study had been done in six meetings that were designed; first meeting was for pre test, 4 meetings were for treatments, and the last meeting was for post test.
The data of this research were analyzed by using t-test. The result showed that there was significant influence between the students who was taught with computer assisted language learning and without computer assisted language learning. The result of analysis data between variable X and Y using t-test formula showed that the value of to (t observation) was 8.74. In the t- table, score degree of freedom 5% is 2.02 so we can conclude that to is higher than tt (to : tt = 8.74 > 2.02). In other words that computers have influence in students listening skill.
ii
ABSTRAK
Naila Jauhara (108014000052), The Influence of Computer Assisted Language Learning on Students’ Listening Skill; An Experimental Study at the First Grade Students of SMK Yaspia Jakarta, Skripsi of Department of English
Education, Faculty of Tarbiyah and Teachers’ Training, Syarif Hidayatullah State
Islamic University of Jakarta.2014.
Penelitian ini bertujuan menjelaskan bukti empiris pengaruh tentang pembelajaran bahasa berbantuan komputer terhadap keterampilan menyimak siswa pada kelas sepuluh SMK Yaspia Jakarta tahun pelajaran 2013/2014. Untuk mengetahui berpengaruh atau tidaknya media pembelajaran ini, digunakan metode penelitian eksperimen yang diterapkan di kelas X AP 1, dan untuk kelas kontrol menggunakan kelas X AP 2. Penelitian dilakukan dalam 6 kali pertemuan yang didesain sebagai berikut: pertemuan pertama untuk tes awal, 4 pertemuan untuk pelatihan, dan pertemuan terakhir untuk test akhir.
Analisis data pada penelitian ini dengan menggunakan t-test. Hasilnya menunjukkan bahwa ada perbedaan yang signifikan antara siswa yang diajarkan menggunakan komputer dan yang tidak menggunakan media tersebut. Hasil analisis data dari kedua variabel tersebut (variabel X dan Y) dengan menggunakan rumus t-test menunjukan bahwa nilai to lebih rendah dibanding dengan nilai tt (8.74 > 2.02). Hasil tersebut menunjukan bahwa pembelajaran bahasa berbantuan komputer berpengaruh secara signifikan terhadap keterampilan menyimak siswa.
iii
finishing this research paper. Peace and blessing be upon our prophet Muhammad
SAW, his family, companions, and all his followers.
Alhamdulillah by the grace of Allah the Highest, the writer could finish
her research paper after long hard effort of writing. Thus, she would like to
express her greatest gratitude to her beloved parents (H. Abdul Hadi and Hj.
Hasanah) who always pray, support, and motivate her in every part of her life
especially in doing this study.
The writer would also like to address her gratitude to her advisors Drs.
Syauki, M.Pd. and Atik Yuliyani, M.A. TESOL for their patient guidance, kindness,
valuable advice, and correction during the development of this research.
She would like to express her deep appreciation and gratitude to:
1. All lecturers of Department of English Education who have taught her new
knowledge and have given her gorgeous experiences in study.
2. Drs. Syauki, M.Pd. and Zaharil Anasy, M.Hum. The head and secretary of
Department of English Education.
3. Dra. Nurlena Rifa’i, M.A., Ph.D., the Dean of Faculty of Tarbiyah and
Teachers Training.
4. The principal and the English teacher of SMK Yaspia Jakarta for
permitting and helping the writer to conduct the research.
5. Her beloved best friends who have always been in the researcher side in
facing all the laughter and tears during her study, especially for
iv
6. All her beloved friends of Department of English Education Class B for
academic year 2008 whose names cannot be mentioned one by one who
always help and motivate her in accomplishing this research paper.
May Allah, the Almighty bless them all. Amin.
Finally, this research paper still has some weakness and shortage. Thus,
she would be grateful to accept any suggestions and corrections from anyone
for better writing.
Jakarta, August 2014
v
ABSTRAK ... ii
ACKNOWLEDGEMENT ... iii
TABLE OF CONTENTS ... v
LIST OF TABLES ... vii
LIST OF APPENDICES ... viii
CHAPTER I: INTRODUCTION ... 1
A. The Background of the Study ... 1
B. Limitation of the Problem ... 3
C. The Formulation of the Study ... 4
D. The Objective of the Study ... 4
E. The Use of the Study ... 4
CHAPTER II: THEORETICAL FRAMEWORK ... 5
A. Listening Skill ... 5
1. The Definition of Listening ... 5
2. The Extensive and Intensive Listening ... 6
3. Factors Affecting Listening ... 9
4. Teaching Listening ... 11
a. Procedures and Activities ... 11
b. Listening Materials ... 12
B. Computer Assisted Language Learning (CALL) ... 13
1. Definition of CALL ……… 13
2. The Uses of CALL ……… 14
3. The Advantages of CALL ……… 15
C. Thinking Framework ………. 16
vi
CHAPTER III: REASERCH METHODOLOGY ... 17
A. The Place and Time of the Study …………. ... 17
B. The Method of the Study ... 17
C. The Population and Sampling ... 17
D. The Technique of Data Collecting ... 17
E. The Technique of Data Analysis ... 19
F. Statistical Hypothesis ... 22
CHAPTER IV: RESEARCH FINDING ... 23
A. The Description of the Data ……… 23
B. The Analysis of the Data ……… 25
1. The Experiment Class ... … 25
a. Frequency Distribution ... … 25
b. Normality Test ... … 26
2. The Control Class ... … 28
a. Frequency Distribution ... … 29
b. Normality Test ... … 29
3. Homogeneity Test ... … 31
4. Statistical Test (T-Test) ... … 32
C. Test of Hypothesis ... … 34
CHAPTER V: CONCLUSION AND SUGGESTION ... 35
A. Conclusion ………. ... 35
B. Suggestion ……… ... 35
BIBLIOGRAPHY ... 37
vii
Table 4.1 The Individual Score of Experiment Class …... 23
Table 4.2 The Individual Score of Controlled Class ... 24
Table 4.3 Frequency Distribution Table of Experiment Class ... 26
Table 4.4 100 Pj Table of Normality Test of Experiment Class ……… 27
Table 4.5 X2 Table of Normality Test of Experiment Class ………. 27
Table 4.6 Frequency Distribution Table of Controlled Class ... 27
Table 4.7 100Pj Table of Normality Test of Controlled Class ………. 30
Table 4.8 X2 Table of Normality Data of Experiment Class ……… 30
viii
LIST OF APPENDICES
Appendix 1 The Lesson Plan of Experiment Class ……….. 40
Appendix 2 The Lesson Plan of Control Class ……… 53
Appendix 3 The Instruments of Pre-test ……….. 62
Appendix 4 The Instruments of Post-test ………. 66
Appendix 5 Listening Script of Pre-test ………. 69
Appendix 6 Listening Script of Post-test ……… 71
Appendix 7 The Answer Key of Pre-test ……… 74
Appendix 8 The Answer Key of Post-test ……… 75
Appendix 9 Validity Test of Pre-test ……….. 76
Appendix 10 Reliability Test of Pre-test ………... 77
Appendix 11 Validity Test of Post-test ……… 88
1
A.
The Background of the Study
Language learning is not the same as learning any other subjects. It is not
just for writing an examination and getting a degree or award. The four skills of
reading, writing, listening and speaking have to be practiced. Being able to
communicate well is the most important factor. Communication involves the
ability to listen carefully, to get the meaning and to respond with appropriate
words and clarity of pronunciation.
Listening well is an important part of learning. In school, at home, and
among friends, people learn more by listening to others. Listening is one of
aspects in learning foreign language, including English. For many students,
listening is a difficult skill to improve because it is an active process in which the
listener tries to identify the sounds, decodes them, and understands meaning of
words by means context.
As the first skill that human get, listening has given a lot of contribution to
others skills, specially in speaking and writing. Listening is a receptive skill, the
students receive a lot of information that can support those two skills (writing and
speaking). So, teaching listening has to be taught in the right method and has to
get same attention like other skills. Unfortunately, at school, listening is not the
main skill that has to be taught. According to the writer’s observation, the students
rarely get listening material and the teacher does not use the media of teaching
listening effectively. The teaching listening process is just the teacher reads the
text and the students has to listen to it. In fact, they must get the right model of
pronunciation which is ideally given by an English native speaker; hopefully,
students are able to produce the right English sounds. However, it often happens
that the teacher is a nonnative speaker who sometimes does not realize that he/she
2
excellent one, he/she sometimes make errors in pronunciation because English is
not his/her mother tongue.
Listening comprehension is a key component in language teaching.
Language programs with a communicative goal should focus on the quality of
listening tasks based on authentic materials as well as appropriate audio-visual
equipment. Teachers may create tasks from short academic lectures, radio
programs, authentic conversations, audio-books, songs, or short stories. In
addition, audio-visual equipment should be part of all language courses in which
technology facilitates the teaching-learning process. In regard to listening
comprehension, most language programs include tape recording, digital data or
even computer software in their curriculum.
Teaching methods have changed over the years. They tend to be more
learner-centered with less focus on teachers. Therefore, the main focus in modern
teaching and learning environment are the learners, they have to responsible for
their knowledge. They can learn better if they have an active role in class.
Moreover, with the significant growth of technology, its application and
importance in teaching and learning English has increased. Most of the new
methods and theories focus on technology applications and its effect on learning.
Technology can help learners to be responsible for their own learning by
providing an independent learning environment. The teachers have to learn more
about advanced technology they want to use because technological aids in
language teaching are the major force today.
The use of technological aids in teaching learning process is really helpfull
for the students and the teacher. There are a lot of technological aids in teaching
learning process. It depends on the lesson plan, the method and teacher’s strategy
in teaching learning process.
In today’s developed world, computer is one of the most beneficial and useful tools in learning. The number of systems which help learners to improve
system which aids learners to improve and practice language skills. It provides a
stress-free environment for learners and makes them more responsible.1
Media of teaching that can be used in language laboratory is using
computer with connection to the internet. Teacher can choose free materials from
computer. The method of teaching that use computer named is computer assisted
language learning. However, the computer alone cannot offer many useful
benefits to the listening as it can do in that of reading or writing. The use of
computers in the area of listening skills depends very much on the type of
hardware, for example the computer with additional peripherals, such as a sound
card and loud speaker. Using multimedia, PC with a sound card, CD ROM or
DVD drive, the internet, and voice recognition technology, can be the best way of
tackling all kinds of listening activities. It is good for students because it allows
the students to interface with the target language in new ways. The students allow
to listen to model pronunciation, repeat and record the same, listen to their
performance and compare with the model, and do self-assessment. Besides that,
students has the privacy to speak and listen.
In other words, by utilizing the computer properly and fully, it is expected
that the teaching learning process can be more effective and finally can also attain
the goal.
According to the explanation, the writer interested to do a research with
the title The Influence of Computer Assisted Language Learning on Students’
Listening Skill. An experimental research at first year students of SMK Yaspia
Jakarta.
B.
Limitation of Problem
The limitation of this problem is the use of computer assisted language
learning in the teaching learning process especially in listening skill at first year
students of SMK Yaspia, Jakarta.
1
4
C.
Formulation of the Study
It was significant to identify the problem in this research paper so that the
problem will be obvious. Is there any significance influence of computer assisted
language learning in listening skill?
D.
The Objective of The Study
Overall the aim of this research is to know the influence of teaching
listening using CALL.
E.
The Significance of Study
There are some benefit in this research:
1. Computer can be used in teaching learning activities as the alternative
teaching media specially in teaching listening.
2. To improve the students’ motivation and achievement in learning English
subject and also other subjects at school.
3. The result of this research is to know how far the influence of using computer
5
covers about listening skill including the definition, the extensive and intensive
listening, the factors affecting listening and teaching listening and then about
computer assisted language learning (CALL).
A.
Listening
1. Definition of Listening
Listening is an integral part of effective communication. A lot of people
believe that listening is same with hearing. It basically has different meaning from
hearing. “Listening is done with the head, eyes, heart, and gut. Hearing is done
with the ears.”1
“Hearing is a physical yet passive act involving the process and function of perceiving sound. Listening is hearing the sounds with deliberate intention.
Therefore, unlike hearing, listening is a skill that improves through conscious
effort and practice.”2
In listening, someone does not hear the sounds but also has an effort to
interpret and understand the message of the sounds, while hearing is only taking
in sounds without any effort to get the message. Listening is an active process in
which the listener tries to identify the sounds, decodes them, and understands
meaning of words by means context. Therefore, when the nature of the skill is
understood, the process becomes interesting. In the words, listening involves an
active participation the part of the listener. The listener cannot understand well
what is said to him unless he first of all recognizes the sounds, words, phrases,
and the structure of the foreign language; and then select the main points of
message.
Therefore, it can be conclude that listening is the process of hearing and
comprehending of what has been said by the speakers. The listeners should be
able to know the words and distinguish sounds to get information, message and
1
Ina Thomas and Brian Dyer, The Problem of Poor Listening Skills, October 28th, 2007, p. 2.
2
6
meaningful communication. Meanwhile, hearing means the ability to hear sounds
without paying attention to get the meaning.
2. The Extensive and Intensive Listening
The extensive and intensive listening is two kinds of listening, they are
important to improve students‟ listening skill, they can increase their language
input. The students can do extensive listening in their own daily activities, they
can listening what they like and what they want to listen to and it is often done
with the help and/or intervention of the teacher.3
Intensive listening is serious activity that needs more concentration than
extensive listening, less relaxed, and often dedicated not so much to pleasure as to
the achievement of a study goal.4
Furthermore, there are at least three more intensive listening activities such as:
a. Intensive listening: using taped material
Intensive listening by using taped material or material on disk allows
students to hear a variety of different voices apart from just their own
teacher‟s. It gives them an opportunity to meet a range of different characters,
especially where real people are talking. But even when tapes contain written
dialogues or extracts from plays, they offer a wide variety of situation and
voices. This activity is not suitable in the big class with poor acoustics, the
audibility of taped and disk material often gives cause for concern. It is
difficult to ensure that all students can hear the material clearly. So if the
teachers want to use taped material, they need to check the tape and machine
quality before they use it in the class. 5
b. Intensive listening: “live” listening
A popular way of ensuring genuine communication is live listening where
teachers and or visitors to the class talk to the students. This has obvious
advantages since students can interrupt speakers and for clarification. There
3
Jeremy Harmer, Op. Cit., p. 228.
4
Ibid., p. 204.
5
are some activities that teachers can do in live listening; reading aloud,
story-telling, interview and conversations.6
c. Intensive listening: the role of the teacher
All activities for listening we need to be active in creating student
engagement through the way we set up the task. We need to build up students‟
confidence by helping them listen better than by testing their listening
abilities. In particular, we need the focus on the following roles:
1) Organizer; tell students exactly what their listening purpose is, and give them
clear instruction how to achieve it.
2) Machine operator; when we use tape or disk materoal we need to be as
efficient as possible in the way we use the tape recorder.
3) Feedback Organizer; teacher must give the feedback when the students have
completed the task. Teacher can ask the students to compare their answer in
pairs.
4) Prompter; teacher ask the students to listen to a tape or disk again to notice a
variety of language and spoken features.7
Students can improve their listening skill through a combination extensive and
intensive listening materials and procedure. Listening of both kinds is especially
important since it provides the perfect opportunity to hear voices than teacher‟s,
enables the students to acquire good speaking habits as a result of the spoken
English absorb, and help to improve their own pronunciation and listening skill.
3. Factors Affecting Listening Skill
In the communicative language teaching, listening exercise are judge as
valuable to extent that they stimulate the “real life” listening conditions that actual
users of a language operate within.8 In order to better understand the comp0lex
process of spoken language, a listener must construct meaning from information
6
Ibid., pp. 230-231.
7
Ibid., p. 231.
8
8
presented by the speaker. According to Joseph P. Boyle, there are three factors
that affect listening skill; Listener factors, Speaker factors, Material factors.9
a. Listener Factors
1. Experience/practice in listening to target language
2. General intelligent
3. Physical and educational
4. Intellectual (powers of analysis and selection, memory, etc)
5. Psychological (motivation and sense of purpose while listening,
attitude of listeners to the speaker, listener‟s attention and
concentration)10
b. Speaker Factors
1. Language ability of the speaker
2. Speaker‟s production: pronunciation, accent, variation, voice, etc.
3. Speed of delivery
4. Prestige and personality of the speaker11
c. Material Factors
1. The language used to convey the message; phonological features,
including stress, intonation, weak forms, syntax, cohesion and etc.
2. Difficulty of content and concepts, especially if the material is
abstract, highly specialized or technical, or lengthy.
3. Amount of support provided by gestures, visuals.12
Listening can cause problems as panic and difficulty. Students often panic
when they see the tape recorder because they know that they are faced with a
challenging task. Two things are guaranteed to increase that panic, the first is to
refuse to play more than once and the second is to expose an individual student‟s
9
Joseph P. Boyle, Factors Affecting Listening Comprehension, English Language Teaching,
XXXVIII, (1984), p. 35.
10 Ibid.,
11 Ibid., 12
lack of success in the listening task. Some teachers and students find that listening
to tapes is extremely difficult, especially when tapes are fairly long.13
These are some internal factors that might be faced by the students in
understanding listening process:
a. Intelligence; level of intelligence can influence the students‟ listening
comprehension. The students who have a high level of intelligence will
better understand the listening material than the lower level one.
b. Language facility; the ability to segment and analyze speech accurately
and automatically into appropriate units is very important when listening
to spoken language.
c. Vocabulary; the students must have knowledge of vocabulary because
some words not only have one meaning but have many meanings depend
on the context. It can make the students easier in understand the material.
d. Background knowledge; the students who have lack of background
knowledge of the material can influence their comprehension in listening.
e. Speech register; Speech registers refer to the different styles of language a
person uses in a given social context.
A range of internal factors influence listening comprehension. By considering
these factors, people can analyze communication situations. This is an important
step in detecting possible causes of poor listening comprehension.14
4. Teaching Listening
To ensure a success in the teaching of listening, a teacher needs to plan and
implement appropriate procedures and activities for the teaching.
a. Procedures and activities
There are three steps in listening activities. They are pre-listening,
while-listening and post-while-listening.
Field summarized the format of the 1990‟s listening lesson as follows:
Pre-listening : Set context
13
Jeremy Harmer, The Practice of English Language Teaching New Edition (New York: Longman Publishing, 1991), p. 231.
14
10
Create motivation
While-listening : Extensive listening (followed by questions
on context attitude)
Pre-set task/pre-set question
Intensive listening
Checking answers
Post-listening : Examining functional meaning
Inferring vocabulary meaning15
In pre listening, the teacher needs to activate students‟ knowledge of the topic;
giving them the purpose of the listening material so they can make predictions to
anticipate what they might hear and giving them the new vocabulary. While
listening is the process of listening, the teacher give the material with the support
of visual and clarification questions and then teacher checking the students
comprehension. The last is post listening, in this steps teacher follow up the
activity based on new language.16
There are two types of listening activities according to Richard, they are
noticing activities and restructuring activities.
Noticing activities involve returning to the listening texts that served as the basis for comprehension activities and using them as the basis for language awareness. For example, students can listen again to a recording in order to: 1. Identify differences between what they hear and a printed version of the
text.
2. Complete a cloze version of the text.
3. Complete sentences stems taken from the text.
4. Check off entries from a list of expressions that occurred in the text. Restructuring activities are oral or written tasks that involve productive use of selected items from the listening text. Such activities could include: 1. Paired reading of the tape scripts in the case of conversational texts.
2. Written sentence-completion tasks requiring use of expressions and other linguistic items that occurred in the text.
3. Dialog practice that incorporates items from the text.
15
John field, The Changing Face of Listening, English Teaching Professional, January 1998, p. 245.
16
4. Role plays in which students are required to use key language from the texts.17
There are some activities in language laboratories when teaching and learning
listening skill. They are; repetition, drills, pairing, double-plugging and
telephoning, note taking, dictation, finding differences between a written text and
a taped account of the same events, answering comprehension questions, video
watching activities.18
To develop students‟ listening comprehension naturally, the teacher should
always use English as a medium of teaching learning process.
b. Listening Materials
There are two types of listening materials that can be used in the teaching of
listening. They are scripted and non-scripted materials. Scripted materials,
according to Mathews as quoted by Cahyono, one those which have been written
down in advance before being read or acted out, while non-scripted materials are
those spontaneous and natural ones.19
Most classroom in SLTA use scripted materials, either recorded or
non-recorded. The using is considered as more practical in terms of preparation and
easier to modify to meet students‟ need and level of ability. The teacher should
prepare the materials, which are appropriate to the topic and suitable for the
students.
There are some materials in listening which is not overt response (the learners
have to do anything in response to the listening; however, facial expression and
body language often show if they are following or not):
1. Stories: tell a job or real life anecdote, retell a well-known story, read a
story from a book, or play a recording of a story. If the story is well
17
Jack C. Richards, Teaching Listening and Speaking, (New York: Cambridge University Press, 2008), pp. 16–17.
18
Jeremy Harmer, Op. Cit., pp. 143–145.
19
12
chosen, learners are likely to be motivated to attend and understand in
order to enjoy it.
2. Songs: sing a song yourself, or play a recording of one. Note, however,
that if no response is required learners may simply enjoy the music
without understanding the words.
3. Entertainment: films, theater, video. As with stories, if the contents are
really entertaining (interesting, stimulating, humorous and dramatic)
learners will be motivated to make the effort to understand without the
need for any further task.20
B.
Computer Assisted Language Learning (CALL)
1. Definition of CALL
CALL as the research for and study of applications of the computer in
language teaching and learning. CALL embraces a wide range of ICT application
and approaches to the teaching and learning foreign languages.21
Before using CALL term, the term of CALI (Computer-assisted language
instruction) was known, reflecting its origins as a subset of the general term CAI
(Computer-assisted instruction). CALL began to replace CALI in the early 1980s
and it is now incorporated into the names of the growing number of professional
CALL associations worldwide.22
The current philosophy of CALL puts a strong emphasis on student-centered
materials that allow learners to work on their own. Such materials may be
structured or not, but they usually represent two features, interactive and
individualize learning.23
The main aim of CALL is to find ways for using computers for the purpose of
teaching and learning the language. CALL is the use of computer technologies
that promote educational learning, including word processing, presentation
20
Penny Ur, A Course in Language Teaching, (Cambridge: Cambridge University Press, 1996), p. 113.
21
M. Levy, CALL: context and conceptualization, (Oxford: Oxford University Press, 1997), p. 1.
22
Tryanuarsih.wordpress.com/2011/01/31/teaching-listening-using-Call/
packages, guided drill and practice, tutor, simulation, problem solving, games,
multimedia CD-ROM, and internet applications such as e-mail, chat and the
World Wide Web.
2. The Uses of CALL
The use of CALL can be divided into 6, they are computer as drill and
practice, computer as tutor, computer as simulation or problem solving, computer
as game, computer as tool for ELT teachers and learners and last application of
internet for ELT.24
First use of CALL is computer as drill and practice. In this use, computers are
viewed as a tool for saving time with immediate feedback. The main aim of drill
and practice is to review the content or background knowledge, and to assist the
learners to master separate language skills. Drill and practice CALL programs
focused on practicing language skills and component separately, such as
vocabulary, grammar, reading and translation.
Computer as tutor; the role of the computer as tutor is to present to the learners
the content lesson as text graphics, video, animation, or slides, including learning
activities, drills and practice. Example of CALL tutorial programs are grammar
(longman Grammar software, grammar expert plus, etc), reading (Read it! Study
skills, rocket reader; a speed reading program, etc.), writing, paragraph Punch,
write express easy letters, etc.), speaking, pronunciation and listening (learn to
speak, English pronunciation, real English, etc.), integrated skills or courseware
(active English, planet English, issues in English, etc.)
Simulations and problem solving is used to encourage analysis, critical
thinking, discussion and writing activities. The computer is not used for tutorial
purpose but for simulation or problem solving. The program is designed to create
language interaction through problematic situations, conditions pr problems
challenging for the learner to solve. Many simulation programs are problem
solving games, which are entertaining and education (“edutainment”), such as
24
14
Oregon Trail. In this game the learners are challenged to make a series of
decisions to guide their party.
The main aim of computer as game is to create a pleasurable learning
environment and to motivate the language learner. CALL games and simulation
games are similar; they are designed to motivate students to learn through
entertainment. Examples of CALL vocabulary games are Spelling Games,
Spelling Bee and Magic Hat, Word Order, etc.
Another function is computer as tool for teachers and learners; teachers and
learners can use the computer as word processors, spelling and grammar checkers,
concordances to search in huge databases to find all the uses of particular words,
and the last as collaborative writing to help the learner to write collaboratively on
computers.
Computers can be connected to the internet and can incorporate interactive
multimedia: text, graphics, audio, video and animation. Electronic mail (E-mail),
file transfer protocol (FTP), World Wide Web (WWW) are the internet
applications that teachers can use for language teaching. In WWW, teacher and
learner can search the materials, such as texts that can be downloaded and save,
pictures, audio and video files, chat and voice chat.
3. The Advantages of CALL
There are some benefits of how CALL can be used for language teaching and
learning. For the learners, CALL can adapt to the learner‟s abilities and
preferences; CALL offers individualized and private learning; CALL allows
learners to control their own learning process and progress; CALL can be used for
remedial work for slow learners and to accelerate learning for fast learners;
teaching learning with CALL can motivate the student.25
For the teacher, CALL can change the role of teacher; the teacher becomes the
facilitator rather than a person who controls the learning environment. Teaching
learning with CALL can give the feedback and responsiveness immediately. 26
25 Ibid,. 26
C.
Thinking Framework
Listening is one of the skills that are taught in English teaching learning. It
needs good concentration and comprehension of listeners. Without those things,
listening is useless and it means only hearing sounds. Students should have skills
of listening in order to comprehend and understand listening materials.
To help the students in comprehend the message of listening materials,
teachers should provide interesting materials, teaching aids and create positive
classroom environment.
CALL has important potential for English teacher. It can interest and motivate
learners of English. Using effective and suitable software applications, CALL can
provide communicative meaningful language learning environments.
D.
Theoretical Hypothesis
To prove the hypothesis, the data obtained from the experiment class and the
control class was calculated by using the t-test formula with the assumption as
follows:
t0>tt: the alternative hypothesis (Ha) is accepted and the null hypothesis (H0) is
rejected. It means there is a significance influence between the result of
using computer assisted language learning and without computer.
t0<tt: the alternative hypothesis (Ha) is rejected and the null hypothesis (H0) is
accepted. It means there is no significance influence between the result of
16
CHAPTER III
RESEARCH METHODOLOGY
A.
Place and Time of the Study
The research conducted at first grade students of SMK YASPIA Jakarta
which is located on Jalan Benda Gg. H. Saenan, Ciganjur, Jakarta Selatan.
The research was conducted in October – December 2013.
B.
Method of the Study
This research is categorized as an experimentalal research. It focuses on
treatment and outcome. It was proven the cause effect relationship among
independent variable and dependent variable.
In this research, there were two class; experimental class and control class.
The experimental class was taught by using computer assisted language learning
while the control class was taught without computer assisted language learning.
C.
The Population and Sampling
In this research, the population was taken of the first year students of SMK
Yaspia Jakarta. The total was 62 students from two classes. Before doing the
research, two classes was taken which had the same condition and had the same
facilities. They also taught by the same teacher, in this case, the writer.
D.
Instrument of The Study
The Instrument of research is test that divided into two tests, pre-test and
post-test. Each of test consist of 15 items are multiple choice. Both of the classes,
experimental and controlled class were given the same test.
E.
Technique of Data Collecting
Test was used in completing data. The test was done to find out the
were two tests namely pre-test and post-test for the experimental and control
class, both of them are named data. Pre-test was conducted when the writer
entered the class for the first time. The post test was done after the writer finished
presenting the content of material. In post-test, the difference of the result among
experimental class and control class was showed.
F.
Technique of Data Analysis
Data analysis is the last step in the procedure of research. In analyzing data
from the pre-test and post-test, the statistical calculation of the T-Test was used
whether the sample is not related each other. T-test is used in order to find out the
differences of the result/score of student’s achievement in studying listening by
using language laboratory.
1. Validity and reliability of instrument
In obtaining the validity of data, analysis technique by Karl Pearson was
used; therefore it often called by Pearson correlation technique. The formula that
used is:1
r
XY =√
= correlation between variable X and Y
X = Questions’ score
Y = Total of questions’ score
n = Number of students
In determining reliability of data, Alpha Cronbach formula was used:2
22
11 1 1 t i k k r 1
Anas Sudijono, Pengantar Statistik Pendidikan, (Jakarta: Rajawali Grafindo Persada, 2010), p.206
2
18
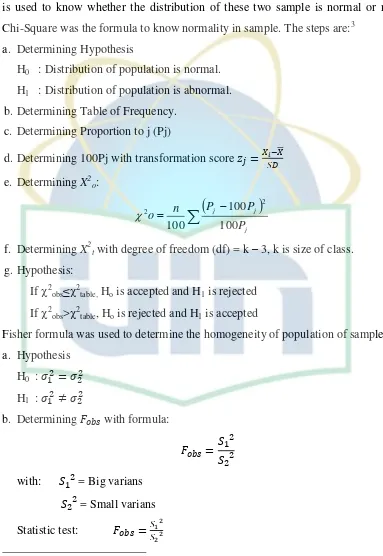
2. Normality and Homogeneity Test
Before analyzing data with T-test, normality test of data was used. This test
is used to know whether the distribution of these two sample is normal or not.
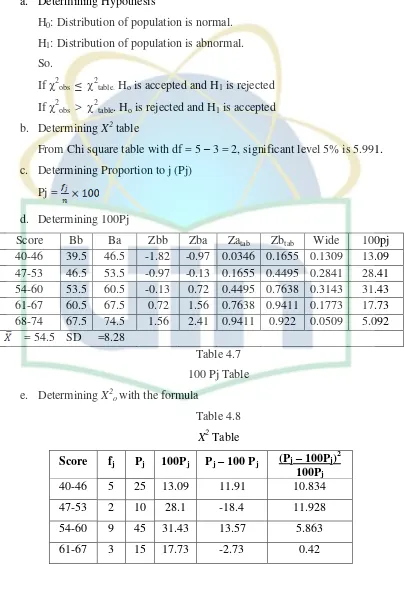
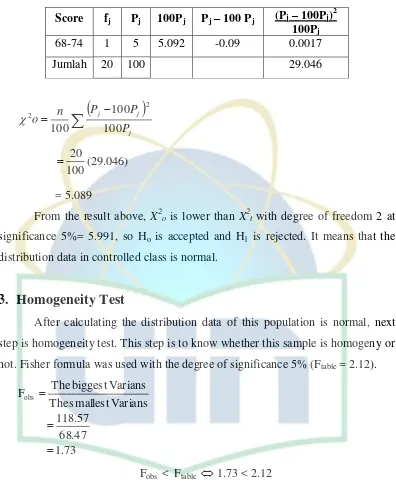
Chi-Square was the formula to know normality in sample. The steps are:3
a. Determining Hypothesis
H0 : Distribution of population is normal.
H1 : Distribution of population is abnormal.
b.Determining Table of Frequency.
c. Determining Proportion to j (Pj)
d.Determining 100Pj with transformation score
e. Determining X2o:
j j j P P P n o 100 100 100 2 2 f. Determining X2t with degree of freedom (df) = k – 3, k is size of class.
g.Hypothesis:
If 2obs≤2table, Ho is accepted and H1 is rejected
If 2obs>2table, Ho is rejected and H1 is accepted
Fisher formula was used to determine the homogeneity of population of sample.
a. Hypothesis
H0 :
H1 :
b. Determining with formula:
with: = Big varians
= Small varians
Statistic test:
3
[image:30.595.111.494.175.731.2]Varians:
c. Determining significant level
d. Determining with formula
1, 1
2 table 2 1 F F n n
e. Determining H0 , yaitu:
Jika , maka H0 accepted dan H1 rejected
Jika , maka H0 rejected dan H1 accepted.
Which:
H0: Group of sample that have same varians.
H1: Group of sampe that have different varians.
3. Statistical Test (t-test)
As mentioned before, in analyzing the data from the result of pre-test and
post-test, statistic calculation of the t-test formula was used.The formulas are:4
a. Determining Mean of variable X, with formula:
=the average of gained score (mean of variable X)
=sum of gained score (variable X)
N= number of the students
b. Determining Mean of variable Y, with formula:
=the average of gained score (mean of variable Y)
=sum of gained score (variable Y)
N= number of the students
c. Determining of Standard of Deviation score of Variable X, with
formula:
√
4
20
Standard Deviation score of Variable X
Sum of squared gained score (Variable X)
Number of the students
d. Determining Standard Deviation Score of Variable Y, with formula:
√
Standard Deviation score of Variable Y
Sum of squared gained score (Variable Y)
Number of the students
e. Determining Standard Error Mean of Variable X, with formula:
√ Standard Error Mean of Variable X
=Standard Deviation of Variable X
Number of the students
f. Determining Standard Error Mean of Variable Y, with formula:
√ Standard Error Mean of Variable Y
=Standard Deviation of Variable Y
Number of the students
g. Determining Standard Error Mean of Difference Mean of variable X and
Mean of Variable Y, with formula:
√
Standard error of difference mean of variable X and mean
of variable Y
Sum of squared standard error mean of variable X
Sum of squared standard error mean of variable Y
h. Determining t0 with formula:
t observation
Mean of variable X
Mean of variable Y
Standard error mean of difference mean of variable X and
mean of variable Y
i. Determining t- table in significant level 5% and 1 % with df.
Degree of freedom
Number of students (control class)
Number of students (experimental class)
G.
Statistical Hypothesis
The statistical hypothesis that was used in this study:
Ho : µe≤ µc
Ha : µe > µc
Which:
Ho: Hypothesis null
Ha: Hypothesis alternative
µe: Mean of the experimental class was taught by using computer assisted
language learning.
µc: Mean of the controlled class was taught without using computer assisted
22
CHAPTER IV
RESEARCH FINDINGS
A.
The Description of Data
The data of students’ achievement was divided into two kinds, namely the
data in experiment class and the data in controlled class, which was gained from
pre-test and post-test that was applied in both of class. The pre-test was given to obtain the data about the students’ listening skill, it was held before the lesson began and the post-test was given after finishing the material teaching.
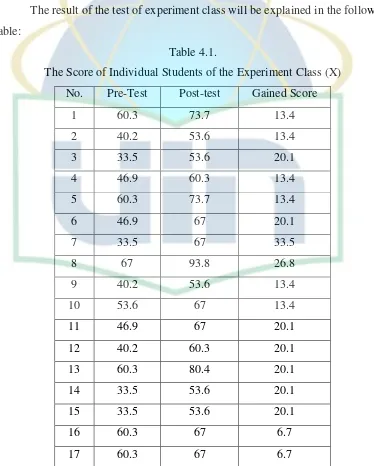
[image:34.595.119.493.286.752.2]The result of the test of experiment class will be explained in the following
table:
Table 4.1.
The Score of Individual Students of the Experiment Class (X)
No. Pre-Test Post-test Gained Score
1 60.3 73.7 13.4
2 40.2 53.6 13.4
3 33.5 53.6 20.1
4 46.9 60.3 13.4
5 60.3 73.7 13.4
6 46.9 67 20.1
7 33.5 67 33.5
8 67 93.8 26.8
9 40.2 53.6 13.4
10 53.6 67 13.4
11 46.9 67 20.1
12 40.2 60.3 20.1
13 60.3 80.4 20.1
14 33.5 53.6 20.1
15 33.5 53.6 20.1
16 60.3 67 6.7
No. Pre-test Pos-test Gained Score
18 60.3 73.7 13.4
19 53.6 80.4 26.8
20 40.2 67 26.8
∑ 971.5 ∑ 1333.3 ∑ 361.8 M=48.6 M=66.7
As mentioned in the table, it can be clarified that the mean score of pre-test
in experiment class is 48.6, while the mean score of post- test was 66.7. The total
gained score in this class was 361.8. It can be known that there was significant
difference in the pre-test and post-test.
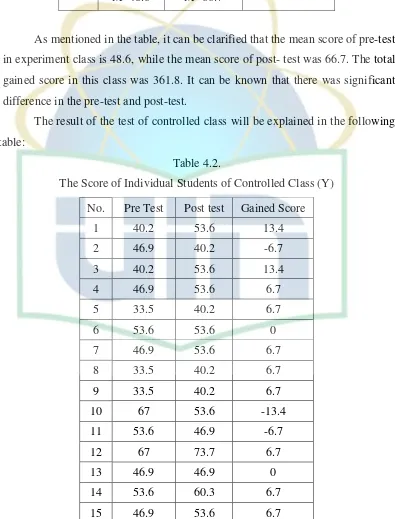
[image:35.595.115.510.230.749.2]The result of the test of controlled class will be explained in the following
table:
Table 4.2.
The Score of Individual Students of Controlled Class (Y)
No. Pre Test Post test Gained Score
1 40.2 53.6 13.4
2 46.9 40.2 -6.7
3 40.2 53.6 13.4
4 46.9 53.6 6.7
5 33.5 40.2 6.7
6 53.6 53.6 0
7 46.9 53.6 6.7
8 33.5 40.2 6.7
9 33.5 40.2 6.7
10 67 53.6 -13.4
11 53.6 46.9 -6.7
12 67 73.7 6.7
13 46.9 46.9 0
14 53.6 60.3 6.7
24
No. Pre-test Post-test Gained Score
16 53.6 60.3 6.7
17 40.2 53.6 6.7
18 33.5 40.2 6.7
19 67 67 0
20 53.6 53.6 0
958.1 1038.5 80.4
M=47.9 M=52
The table 4.2. above informs that the mean score of pre-test in controlled
class is 47.9, while the mean score of post-test here is 52. The total gained score is
80.4.
From the tables presented above the experiment class is the higher score
than controlled class.
B.
Analysis of Data
1.
Experiment Class
a. Frequency Distribution
From the table score above, the table of frequency distribution were
made. The steps are:
1) Determining the Range
R = Xmaks - Xmin
= 93.8 – 53.6
= 40.2
2) Determing the Size of Class
Class = 1 + 3.3 log (n)
= 1 + 3.3 log 20
= 1 + 3.3 (1.31)
= 1 + 4.29
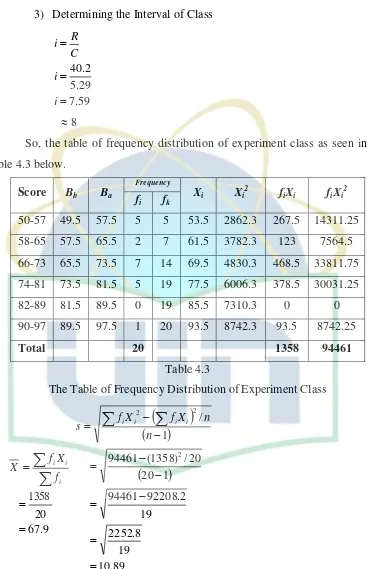
3) Determining the Interval of Class 59 . 7 29 . 5 2 . 40 i i C R i
8
[image:37.595.124.493.106.675.2]So, the table of frequency distribution of experiment class as seen in the
table 4.3 below.
Score Bb Ba
Frequency
Xi Xi2 fiXi fiXi2 fi fk
50-57 49.5 57.5 5 5 53.5 2862.3 267.5 14311.25
58-65 57.5 65.5 2 7 61.5 3782.3 123 7564.5
66-73 65.5 73.5 7 14 69.5 4830.3 468.5 33811.75
74-81 73.5 81.5 5 19 77.5 6006.3 378.5 30031.25
82-89 81.5 89.5 0 19 85.5 7310.3 0 0
90-97 89.5 97.5 1 20 93.5 8742.3 93.5 8742.25
Total 20 1358 94461
Table 4.3
The Table of Frequency Distribution of Experiment Class
9 . 67 20 1358
i i i f X f X
89 . 10 19 8 . 2252 19 2 . 92208 94461 1 20 20 / ) 1358 ( 94461 1 / 2 2 2
n n X f X fs i i i i
From the data above. mean score of experiment class is 67.9 and standard
26
b. Normality Test of The Experiment Class
From the data above, analyzing the score from the experiment class was
used Chi Square formula. The steps are:
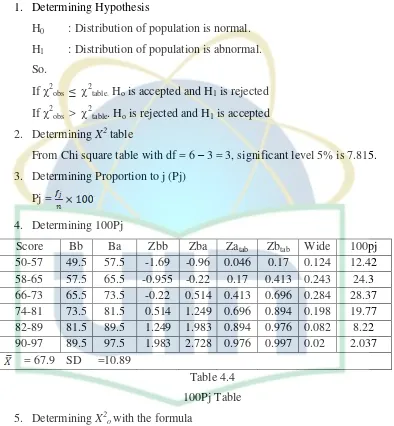
1. Determining Hypothesis
H0 : Distribution of population is normal.
H1 : Distribution of population is abnormal.
So.
If 2obs ≤ 2table. Ho is accepted and H1 is rejected
If 2obs > 2table. Ho is rejected and H1 is accepted
2. Determining X2 table
From Chi square table with df = 6 – 3 = 3, significant level 5% is 7.815.
3. Determining Proportion to j (Pj)
Pj =
4. Determining 100Pj
Score Bb Ba Zbb Zba Zatab Zbtab Wide 100pj 50-57 49.5 57.5 -1.69 -0.96 0.046 0.17 0.124 12.42 58-65 57.5 65.5 -0.955 -0.22 0.17 0.413 0.243 24.3 66-73 65.5 73.5 -0.22 0.514 0.413 0.696 0.284 28.37 74-81 73.5 81.5 0.514 1.249 0.696 0.894 0.198 19.77 82-89 81.5 89.5 1.249 1.983 0.894 0.976 0.082 8.22 90-97 89.5 97.5 1.983 2.728 0.976 0.997 0.02 2.037
= 67.9 SD =10.89
Table 4.4
100Pj Table
5. Determining X2owith the formula
Score fj Pj 100Pj Pj– 100 Pj (Pj– 100Pj) 2
100Pj 50-57 5 25 12.42 12.58 12.73
58-65 2 10 24.3 -14.3 8.415
66-73 7 35 28.37 6.633 1.551
74-81 5 25 19.77 5.232 1.384
[image:38.595.117.511.175.601.2]Score fj Pj 100Pj Pj– 100 Pj (Pj– 100Pj) 2
100Pj 90-97 1 5 2.037 2.963 4.308
[image:39.595.115.512.108.747.2]Jumlah 20 100 36.61
Table 4.5
X2 Table
j j j P P P n o 100 100 100 2 2 ) 61 . 36 ( 100 20 = 7.322
X2t with degree of freedom 3 at significance 5%= 7.815. Comparing X2
observation and X2 table (X2t), we know that X2o is lower than X2t. The result is as
follow:
7.815 > 7.322
Because of X2o is lower than X2t, so the H0 is accepted and H1 is rejected. It
means that the distribution data from this population is normal.
2.
The Controlled Class
a. Frequency Distribution
The steps are:
1) Determining the Range
R = Xmaks - Xmin
= 73.7 – 40.2
= 33.5
2) Determing the Size Class
Class = 1 + 3.3 log (n)
= 1 + 3.3 log 20
= 1 + 3.3 (1.31)
= 1 + 4.29
28
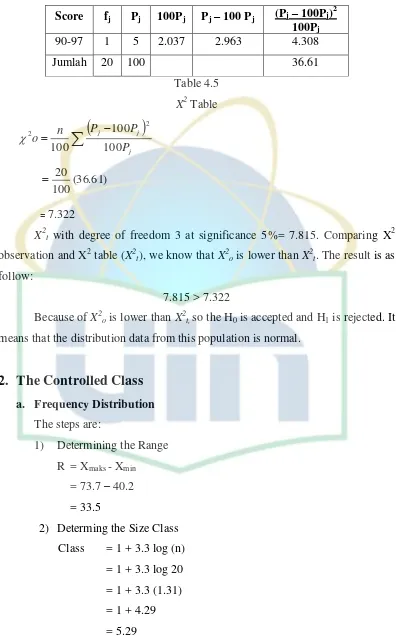
3) Determining the Interval Class
3 . 6 29 . 5 5 . 33 i i C R i
[image:40.595.112.499.124.657.2]So, the table of frequency distribution of controlled class as seen in the
table 4.6 below.
Table 4.6
The Table of Frequency Distribution of Controlled Class
Score Bb Ba
Frequency
Xi Xi2 fiXi fiXi2 fi fk
40-46 39.5 46.5 5 5 43 1849 215 9245
47-53 46.5 53.5 2 7 50 2500 100 5000
54-60 53.5 60.5 9 16 57 3249 513 29241
61-67 60.5 67.5 3 19 64 4096 192 12288
68-74 67.5 74.5 1 20 71 5041 71 5041
Total 20 1091 60815
55 . 54 20 1091
i i i f X f X
28 . 8 19 95 . 1300 19 05 . 59514 60815 1 20 20 / ) 1091 ( 60815 1 / 2 2 2
n n X f X fs i i i i
From the data above, mean score of experiment class is 54.55 and standard
b. Normality Test of Controlled Class
The steps and formula that used in this class is same with experiment
class.
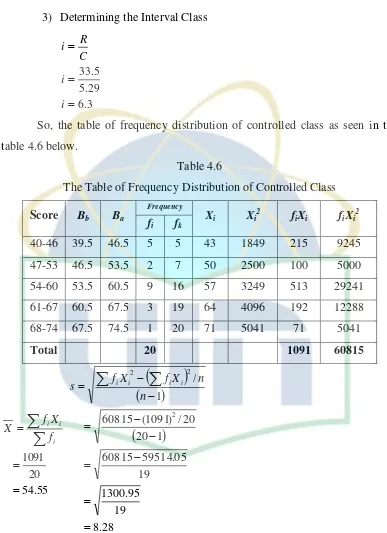
a. Determining Hypothesis
H0: Distribution of population is normal.
H1: Distribution of population is abnormal.
So.
If 2obs ≤ 2table. Ho is accepted and H1 is rejected
If 2obs > 2table. Ho is rejected and H1 is accepted
b. Determining X2 table
From Chi square table with df = 5 – 3 = 2, significant level 5% is 5.991.
c. Determining Proportion to j (Pj)
Pj =
d. Determining 100Pj
Score Bb Ba Zbb Zba Zatab Zbtab Wide 100pj 40-46 39.5 46.5 -1.82 -0.97 0.0346 0.1655 0.1309 13.09 47-53 46.5 53.5 -0.97 -0.13 0.1655 0.4495 0.2841 28.41 54-60 53.5 60.5 -0.13 0.72 0.4495 0.7638 0.3143 31.43 61-67 60.5 67.5 0.72 1.56 0.7638 0.9411 0.1773 17.73 68-74 67.5 74.5 1.56 2.41 0.9411 0.922 0.0509 5.092
= 54.5 SD =8.28
Table 4.7
100 Pj Table
e. Determining X2owith the formula
Table 4.8
X2 Table
Score fj Pj 100Pj Pj– 100 Pj (Pj– 100Pj) 2
100Pj 40-46 5 25 13.09 11.91 10.834
47-53 2 10 28.1 -18.4 11.928
54-60 9 45 31.43 13.57 5.863
[image:41.595.111.515.181.771.2]30
Score fj Pj 100Pj Pj– 100 Pj (Pj– 100Pj) 2
100Pj 68-74 1 5 5.092 -0.09 0.0017
Jumlah 20 100 29.046
j j j P P P n o 100 100 100 2 2 ) 046 . 29 ( 100 20 = 5.089From the result above, X2o is lower than X2twith degree of freedom 2 at
significance 5%= 5.991, so Ho is accepted and H1 is rejected. It means that the
distribution data in controlled class is normal.
3.
Homogeneity Test
After calculating the distribution data of this population is normal, next
step is homogeneity test. This step is to know whether this sample is homogeny or
not. Fisher formula was used with the degree of significance 5% (Ftable = 2.12).
73 . 1 47 . 68 57 . 118 Varians smallest The Varians biggest The Fobs
Fobs < Ftable 1.73 < 2.12
So, from the calculation of homogeneity test with Fisher formula, Fobs <
Ftable. It means that H0 is accepted and H1 is rejected; both of group sample have
same variants or homogeny.
4.
Statistical Test (T-Test)
As mentioned before, in analyzing the data from the result of pre-test and
post-test, the writer used statistic calculation of the t-test formula with the degree
[image:42.595.115.511.106.589.2]Table 4.9.
Standard Deviation Table
Students X Y x y x² y²
1 13.4 13.4 -4.7 9.38 22.00 87.98
2 13.4 -6.7 -4.7 -10.72 22.00 114.92
3 20.1 13.4 2.0 9.38 4.04 87.98
4 13.4 6.7 -4.7 2.68 22.00 7.18
5 13.4 6.7 -4.7 2.68 22.00 7.18
6 20.1 0 2.0 -4.02 4.04 16.16
7 33.5 6.7 15.4 2.68 237.47 7.18
8 26.8 6.7 8.7 2.68 75.86 7.18
9 13.4 6.7 -4.7 2.68 22.00 7.18
10 13.4 -13.4 -4.7 -17.42 22.00 303.46
11 20.1 -6.7 2.0 -10.72 4.04 114.92
12 20.1 6.7 2.0 2.68 4.04 7.18
13 20.1 0 2.0 -4.02 4.04 16.16
14 20.1 6.7 2.0 2.68 4.04 7.18
15 20.1 6.7 2.0 2.68 4.04 7.18
16 6.7 6.7 -11.4 2.68 129.73 7.18
17 6.7 13.4 -11.4 9.38 129.73 87.98
18 13.4 6.7 -4.7 2.68 22.00 7.18
19 26.8 0 8.7 -4.02 75.86 16.16
20 26.8 0 8.7 -4.02 75.86 16.16
361.8 80.4 0 0 830.91 933.71
18.1 4.02
This table shows that the lowest gained from experiment class (X) is 6.7
and from the controlled class (Y) is -13.4, and the highest gained from (X) is 33.5
and from (Y) is 13.4. While the sum of gained score (X) is 361.8 and (Y) is 80.4.
32
From data above, the score from the experiment and controlled class by
integrating the results was analyzed into the formula as follows:
a. Determining Mean of variable X. with formula:
b. Determining Mean of variable Y with formula:
c. Determining of Standard of Deviation score of Variable X. with
formula
=
d. Determining Standard Deviation Score of Variable Y. with formula:
e. Determining Standard Error Mean of Variable X. with formula:
f. Determining Standard Error Mean of Variable Y with formula:
g. Determining Standard Error Mean of Difference Mean of variable X
and Mean of Variable Y with formula:
=
=
= = 1.606
h. Determining t₀ with formula:
=
i. Determining t- table in significant level 5% and 1 % with df.
= (20+20)-2 = 38
T table (tt) with degree of freedom 38 at significance 5%= 2.02.
Comparing t-observation (to=8.74) and t-table (tt=2.02), to is higher than tt. The
result is as follow:
8.74 > 2.02
C.
Test of Hypothesis
To prove the hypothesis, the data obtained class and the controlled class
was calculated by using the t-test formula with the assumption as follows:
to > tt: The alternative hypothesis (Ha) is accepted and the null hypothesis
(H0) is rejected. It means there is a significance difference between
the result of using computer assisted language learning in teaching
listening and without using computer assisted language learning in
teaching listening.
to < tt: The alternative hypothesis (Ha) is rejected and the null hypothesis
(H0) is accepted. It means there is no significance difference
34
teaching listening and without using computer assisted language
learning in teaching listening.
By comparing the values of t₀= 8.74 and tt = 2.02, the data calculated with
statistic shows that t₀ is higher than tt. So, the alternative hypothesis (Ha) is
accepted and the null hypothesis (H₀) is rejected. It means there is a significance
difference between the result of using computer assisted language learning and
A.
Conclusion
Based on the results of this research above, it can be sum up that in
variable X (experiment class) there was significant difference in pre-test and
post-test score and its score was higher than controlled class (variable Y) score. After
calculating all data using t-test formula, the value of to (t-observation) is higher
than tt (t-table); to : tt = 8.74 > 2.02. Finally, it was stated that the hypothesis of the
research computer assisted language learning is effective in teaching listening
skill.
B.
Suggestions
The writer would like to give suggestions to all English teachers in
teaching learning process by using computer assisted language learning in
teaching English especially in listening.
1. Computer is important advance in language teaching efficiency. The teacher
must know something about the physical requirements of computer, how to
operate it, how to orient and train the students to use it, and what preparations
must be made for mechanical use of the computer.
2. The application of technology in teaching is very important for teachers in
teaching English effectively to changes the usual method that teachers used.
In usual method they usually speak in front of the class to explain the
material of learning.
3. The function of computer is as a media of learning that can be used for
listening, speaking and pronunciation. The use of this media can minimize
the problem that students face in learning.
4. CALL cannot replace the teacher although the development of computer
increase.
5. CALL is not a magic solution to language teaching. CALL can be used
effectively if meet language learning goals for the learners in specific
educational setting.
6. To develop students’ listening comprehension naturally, the teacher should
always use English as a medium of teaching learning process.
BIBLIOGRAPHY
Arikunto, Suharsimi. Dasar-dasar Evaluasi Pendidikan. Jakarta: Bumi Aksara, 2006.
Boyle, Joseph. Factors Affecting Listening Comprehension. English Language Teaching, XXXVIII, 1984.
Brown, Steven. Teaching Listening. New York: Cambridge University Press, 2006.
Cahyono, B.Y,.Pengajaran Bahasa Inggris: Teknik, Strategi dan Hasil Penelitian.
Malang: IKIP Malang, 1997.
Deepika, V and Kalaiarasan, M. The Role of Language Lab in Learning English as a Second Language, Journal of Technology for ELT. Vol. II no. 2, 2012.
Field, John. The Changing Face of Listening. English Teaching Professional, 1998.
Harmer, Jeremy. The Practice of English Language Teaching New Edition. New York: Longman Publishing, 1991.
Harmer, Jeremy. The Practice of English Language Teaching Third Edition.
Kuala Lumpur: Longman Publishing, 2001.
Kadir. Statistika untuk Penelitian Ilmu–Ilmu Sosial. Jakarta: Rosemata Sampurna, 2010.
Kavitha, J. The Importance of The English Laboratory in Developing Communication Skills, The Criterion: An International Journal in English. 3, 2012.
Learning Guide. Active Listening. The University of Adelaide, 2010.
Richards, Jack C. Teaching Listening and Speaking. New York: Cambridge University Press, 1996.
Rost, Michael. Listening in Language Learning. London: Longman, 1990.
Rost, Michael. Listening Tasks and Language Acquisition. Berkeley: University of California.
Savic, Vera. Developing Language Skills in Teaching English to Young Learners: Listening and Speaking.
Sudijono, Anas. Pengantar Statistik Pendidikan. Jakarta: Rajawali Grafindo Persada, 2010.
Thomas, Ina and Dyer, Brian. The Problem of Poor Listening Skills. October 28th, 2007.
Tryanuarsih.wordpress.com/2011/01/31/teaching-listening-using-Call/
Ur, Penny. A Course in Language Teaching. Cambridge: Cambridge University Press, 1996.
Web.warwick.ac.uk/CELTE//tr/ovCALL/booklet1.htm.
40
Appendix 1
Rencana Pelaksanaan Pembelajaran (RPP)
Experiment Class
Mata pelajaran : Bahasa Inggris
Kelas/Semester : X/2
Standar kompetensi : Berkomunikasi dengan bahasa inggris setara level
intermediate.
Kompetensi Dasar : Menyebutkan benda-benda, orang, ciri-ciri, waktu, hari,
bulan, dan tahun
Mendeskripsikan benda-benda, orang, ciri-ciri, waktu,
hari, bulan, dan tahun
Tujuan pembelajaran : siswa dapat menentukan topic/tema/gambaran umum dari
dialog tersebut.
Menentukan informasi tersurat dan tersirat dari dialog
tersebut.
Dapat mendeskripsikan benda/orang dengan tepat.
Materi pembelajaran : adjectives.
Langkah – langkah pembelajaran:
Pertemuan ke-1
1. Kegiatan awal (5‟)
a. Guru membuka pelajaran dengan salam
b. Guru memeriksa kehadiran siswa
c. Guru memberikan penjelasan tentang tujuan pembelajaran
d. Motivasi
2. Kegiatan inti (30‟)
a. Siswa diberikan contoh gambar.
b. Siswa mengamati dan mempelajari gambar tersebut
c. Siswa diminta mendeskripsikan gambar tersebut dengan singkat
dari masing – masing booth.
e. Sambil mendengarkan, siswa menjawab pertanyaan – pertanyaan.
f. Siswa diberikan kesempatan sekali lagi mendengarkan materi
tersebut, untuk mengkonfirmasi jawaban mereka.
g. Siswa bersama guru mendiskusikan jawaban dari tes tersebut.
3. Kegiatan akhir (5‟)
a. Membuat resume/rangkuman secara bersama tentang berbagai
hal/informasi penting dari materi tersebut.
Sumber belajar
Rekaman audio/video
Gambar yang relevan dari internet
Get along with English
Seri Pendalaman Materi Bahasa Inggris (Erlangga)
Listening Script
1. A. The men are having lunch.
B. They are shaking hands with each other.
C. There is some food on the table.
D. They are waving their hands.
2. A. They are having a birthday party.
B. They are not wearing glasses.
C. Each boy is holding a spoon.
D. They are having a chat.
3. A. It‟s a fruit market.
B. A man is buying some fruit.
C. A man is eating some fruit.
D. A lot of people is in the market.
4. A. She is paying for her goods at the cashier.
B. A shopkeeper is helping her.
C. She is in the clothing department.
D. She is carrying a shopping basket.
5. A. A waiter is talking to a customer.
42
C. The waiter is asking about the menu to a guest.
D. The waiter is cooking in the kitchen.
Listen and then guess who I am.
6. I‟m a British woman. I used to be poor but since my first „Harry Potter‟
novel a best seller, I have been one of the world‟s richest people.
7. I‟m Canadian. I used to have a normal life but since the video of my
singing performance was uploaded in Youtube, a lot of people are
interested in my singing skills. My hit is “Baby.”
8. I am Indonesian singer. In my age, I‟ve got a lot of awards in music.
Supported by my father who is a composer, I have developed my voice
quality. One of my songs is “kembang perawan.”
9. I‟m an American. I lived in Indonesia from age‟s six to ten. I‟m the first
African – American President of the USA.
10.I am known as the most expensive player of 2010 in the world and the
captain of the Portugal soccer team. I am known for my incredible speed,