A STUDY ON IMPACT RESPONSE OF ADVANCED LAMINATE COMPOSITE
MOHD FAEZ BIN SAHARUDIN
This report is submitted as partial fulfillment of the requirements for the award of Bachelor of Mechanical Engineering (Thermal Fluid)
Faculty of Mechanical Engineering University Technical Malaysia Melaka
“I admit that had read this dissertation and in my opinion this dissertation is satisfactory in the aspect of scope and quality for the bestowal of Bachelor of
Mechanical Engineering (Thermal Fluid)”
Signature :
Supervisor I Name : Pn Siti Hajar Binti Sheikh Md Fadzullah
Date :
Signature :
Supervisor II Name : Pn Nortazi Binti Sanusi
ii
“I verify that this report is my own word except citation and quotation that the source has been clarify for each one of them”
Signature :
iii
iv
ACKNOWLEDGEMENT
I would like to thank my supervisor, Pn Siti Hajar Binti Sheikh Md Fadzullah for her support, guidance and encouragement during completion of this Projek Sarjana Muda.
I also would like to thank all the lecturers, technician and laboratory assistant for assisting me in this project from the start. I would like to tell that their help are very much appreciated especially to En Azhar from FKP (UTeM) and En Wan Shahril from FKM (UTeM).
v
ABSTRACT
vi
ABSTRAK
vii
TABLE OF CONTENT
CHAPTER TOPIC PAGE
CONFESSION ii
DEDICATION iii
ACKNOWLEDGEMENT iv
ABSTRACT v
ABSTRAK vi
TABLE OF CONTENT vii LIST OF TABLE xi
LIST OF FIGURE xiii
LIST OF SYMBOL xviii
LIST OF APPENDIX xix
CHAPTER I INTRODUCTION 1
1.0 Introduction 1
1.1 Objective of this research 2 1.2 Problem Statement 2
1.3 Scope of the research 2
1.4 Planning and execution – PSM 1 and PSM 2 3 CHAPTER II LITERATURE REVIEW 5
2.1 Introduction 5
viii CHAPTER TOPIC PAGE
2.2 Compression Fatigue Failure of CFRP
Laminates with Impact Damage
2.2.1 Experimental of Compression
Fatigue Failure of CFRP Laminates. 7 2.2.2 Result and Discussion of Experimental
For Compression Fatigue Failure of
CFRP Laminates Test. 8
2.3 Impact Response of Advance Laminate
Composite 12
2.3.1 Experimental tests 13
2.4 An experimental study on the Charpy impact response of cracked aluminum plates repaired with GFRP or CFRP
composite patches 17
2.4.1 Investigation of Charpy impact response of cracked with GFRP or CFRP
composite patches 18
2.5 Impact Behavior of Laminated Composite Plates 21
CHAPTER III METHODOLOGY 26
3.1 Overview 26
3.2 Material and Specimen Preparation 28
3.2.1 Material 28
3.2.1.1 Carbon Fiber 29
ix CHAPTER TOPIC PAGE
3.3 Experimental Condition 35
3.3.1 Quasi – Static Compression Test. 35
3.4 Quasi Static Compression Test 36
3.4.1 Compression Test 37
3.5 Fractograhic Analysis Using SEM 38 3.5.1 Procedure for failure analysis component 39 3.5.2 Surface Analysis via Scanning Electron
Microscope (SEM) 40
3.5.3 Impact Damage 41
3.5.3.1 SEM Examination 41
3.6 Finite Element Analysis (FEA). 42
3.6.1 Finite Element Analysis via Solid
Work COSMOS Xpress. 42
3.6.2 Simulation Analysis vis Cosmos
Xpress under Finite Element Analysis. 44
CHAPTER IV RESULT AND DISCUSSION 45
4.1 Result of Mechanical Testing of Quasi -
Static Compression Test. 45
4.1.1 Compression Test of Uni-directional Carbon Fibre Reinforced Plastic
(CFRP) of Laminate Composite. 45 4.1.1 Compression Test of Woven Carbon
Fibre Reinforced Plastic (CFRP)
of Laminate Composite. 52
4.1.3 Compression Test of Woven Glass Fibre Reinforced Plastic (GFRP)
of Laminate Composite. 58
4.2 Comparison of Compression Properties
x CHAPTER TOPIC PAGE
4.3 Scanning Electron Micrograph, ( SEM )
Analysis 72
4.3.1 Comparison of Uni-Directional Carbon
Fibre 72
4.3.2 Comparison of Woven Carbon Fibre 74 4.3.3 Comparison of Woven Glass Fibre(GFRP) 76 4.4 Finite Element Analysis (FEA) under
Cosmos Express 78
4.4.1 FEA Analysis for Uni-Directional Carbon Fibre at Maximum and
Minimum Velocity under Compression
Test. 79
4.4.1.1 FEA Simulation Analysis and Result for Uni-Directional Carbon Fibre. 81 4.4.2 FEA Analysis for Woven Carbon Fibre
at Maximum and Minimum Velocity
under Compression Test. 86 4.4.2.1 FEA Simulation Analysis and Result for
Woven Carbon Fibre. 87
4.4.3 FEA Analysis for Woven Glass Fibre at Maximum and Minimum Velocity
under Compression Test. 92
4.4.2.1 FEA Simulation Analysis and Result for
Woven Carbon Fibre. 93
CHAPTER V CONCLUSION 98
CHAPTER VI RECOMMENDATION FOR FUTURE WORK 99
xi
LIST OF TABLE
NO TITLE PAGE
1.1 Gantt Chart of The Research for PSM I-2008 3 1.2 Gantt Chart of The Research for PSM II -2009 4
3.1 Carbon Fiber Properties. 30
3.2 The Fibre Orientation, Compression Modulus and Strength Data. 31 3.3 Compression Modulus and Strength Data for Different 32
Lay-Ups of GFRP
3.6 Dimensions for compression test follow ASTM D695. 33 3.10 Uni-Directional (UD) Carbon Fibre Reinforced Plastic. (CFRP) 35 3.11 Woven Carbon Fibre Reinforced Plastic. (CFRP) 36 3.12 Woven Glass Fibre Reinforced Plastic. (GFRP) 36
4.1 Data of Experiment for Compressive Test for Uni-directional
Carbon Fiber Reinforce. (CFRP) 47
4.2 Data of Maximum and Minimum Energy at Different
Velocity for Uni-directional Carbon Fibre. 49 4.3 Data of Maximum and Minimum Load (kN) at Different
Velocity for Uni-directional Carbon Fibre. 51 4.4 Mean Load, kN at Different Loading Rate. 52 4.5 Experiment Data for Woven Carbon Fiber Reinforce 54
(CFRP) Under Quasi-Static Compression Test.
4.6 Maximum Energy and Minimum Energy at Maximum 55 Compression Load.
xii
4.9 Experiment Data for Woven Glass Fiber Reinforce (CFRP) 60 Under Quasi-Static Compression Test.
4.10 Data of Maximum and Minimum Energy at Different Velocity 62 for Woven Glass Fibre.
4.11 Data of Maximum and Minimum Load (kN) at Different 64 Velocity for Woven Glass Fibre.
4.12 Mean Load, kN at Different Loading Rate. 65
4.13 Comparison Different Material and Orientation Laminate 67 Composite under Compression Test.
4.14 Visual Observation for Uni-directional Carbon Fibre 70 under Compression Test.
4.15 Visual Observation for Woven Carbon Fibre under 71 Compression Test.
4.16 Visual Observation for Woven Glass Fibre under 72 Compression Test.
4.17 Data Analysis of Uni-Directional Carbon Fibre at 81 maximum velocity.
4.18 Data Analysis of Uni-directional Carbon Fibre at 82 minimum velocity.
4.19 Result of Stress Analysis of Specimen at 0.2mm/min. 84 4.20 Data Analysis at Loading Rate 0.6mm/min for Woven 87
Carbon Fibre via Cosmos Xpress.
4.21 Data Analysis at Loading Rate 0.6mm/min for Woven 88 Carbon Fibre via Cosmos Xpress.
xiii
LIST OF FIGURE
NO TITLE PAGE
2.1 Properties of patch materials and adhesive 8
2.2 Specimen codes and patches types 9
2.3 Photographs of an unimpacted AS4/PEEK specimen in fatigue 10 2.4 Photographs of an impacted UT500/Epoxy specimen with
De /b =0.55 10
2. 5 Photographs of an impacted AS4/PEEK specimen 11 2.6 SEM photographs showing kink band occurred 12 2.7 Size and stitching pattern of unstitched and stitched samples 14 2.8 Typical force versus time curves of impacted 15 2.9 Typical force versus displacement curves of impacted 15 2.10 X-radiographs of unstitched [03/903]s laminates impacted 16 2.11 X-radiographs of stitched [03/903] s laminates impacted 16
2.12 Specimen with different crack lengths 18
2.13 Specimen with patch before impact test 20
2.14 Specimen 10 after impact test 20
2.15 Specimen 12 after impact test. 21
2.16 Compression after impact (CAI) test fixture. 22 2.17 (a) Horizontal and (b) Vertical damage according to
loading directions. 23
2.18 CAI Damage propagations 23
2.19 Direction of CAI damage propagation 23
2.20 Effect of impact damages on CAI damage propagation 24
2.21 CAI damage propagations 24
xiv
NO TITLE PAGE
3.2 Flow of Material Preparation for Different Type of
Composite Material 28
3.3 Uni-directional Carbon Fiber Reinforced Plastic (CFRP) 29 3.4 Woven Carbon Fiber Reinforced Plastic (CFRP) 29 3.5 Uni-Directional Glass Fiber Reinforced Plastic (GFRP) 32 3.9 A schematic diagram shows dimensions for 0º plies. 34 3.10 Process fabrication of compression test specimen 34
for woven carbon.
3.11 Specimen of carbon and glass fiber reinforced plastic 34 after cutting process.
3.12 Universal Testing Machine (UTM). 37
3.13 The position of Specimen Stating Compression Test. 38 3.14 Specimen Condition during Compression Testing Running 38 3.15 Procedure for failure analysis of composites 40
3.16 SEM Machine 41
3.17 Impact Damage Growth Prior of compression failure in
a Composite. 42
3.18 Diagram of specimen before analysis via cosmos Xpress. 44 3.19 Position of load applies to specimen under simulation analysis. 44 3.20 Cosmos Xpress process via the finite element analysis. 45
4.1 Load extension relationship for specimen under
quasi static compression test for uni-directional carbon fibre. 48 4.2 Graph of maximum energy versus different loading rate. 49 4.3 Graph of minimum energy versus different loading rate. 50 4.4 Graph of maximum loads versus difference loading 51
rate for uni-directional carbon fibre.
4.5 Graph of minimum loads versus difference loading rate 52 for uni-directional carbon fibre.
xv
NO TITLE PAGE
4.7 Load extension relationship for specimen under quasi static 54 compression test for uni-directional carbon fibre.
4.8 Maximum energy versus different loading rate
for woven carbon fibre. 55
4.9 Graph of minimum energy versus different loading rate 56 for woven carbon fibre
4.10 Graph of maximum load, kN versus loading rate (mm/min) 57 for woven carbon fibre
4.11 Graph of minimum load, kN versus loading rate (mm/min) 58 for woven carbon fibre..
4.12 Graph of mean load versus different loading rate 59 for woven carbon fibre
4.13 Compressive load versus extension for woven glass fibre. 61 4.14 Maximum energy versus different loading rate of 62
woven glass fibre.
4.15 Minimum energy versus different loading rate of 63 woven glass fibre
4.16 Maximum loads versus different loading rate of 64 woven glass fibre.
4.17 Minimum loads versus different loading rate of 65 woven glass fibre
4.18 Mean load versus different loading rate for 66 woven glass fibre.
4.19 Mean energy, J versus loading rate, mm/min
for every laminate composite under compression test. 68 4.20 Mean load, kN versus loading rate, mm/min for 69
every laminate composite under compression test
4.21 SEM Micrograph of UD carbon fibre at loading rate 74 0.2mm/min
xvi
NO TITLE PAGE
4.23 SEM Micrograph of UD carbon fibre at 75
loading rate 0.4mm/min
4.24 SEM Micrograph of Woven carbon fibre at 76 loading rate 0.2mm/min
4.25 SEM Micrograph of Woven carbon fibre at 76 loading rate 0.4mm/min
4.26 SEM Micrograph of Woven carbon fibre at 77 loading rate 0.6mm/min
4.27 SEM Micrograph of Woven Glass fibre at 78 loading rate 0.2mm/min
4.28 SEM Micrograph of Woven Glass fibre at 78 loading rate 0.4mm/min
4.29 SEM Micrograph of Woven Glass fibre at 79 loading rate 0.6mm/min
4.30 Analysis of uni-directional carbon fibre at
maximum velocity data 83
4.31 Analysis of uni- directional carbon fibre at
minimum velocity data 83
4.32 Check analysis simulation process for UD 85 carbon fibre under
4.33 Result of simulation for UD carbon fibre under 85 maximum loading rate.
4.34 Check analysis simulation process for UD carbon fibre 86 under 0.2mm/min
4.35 Result of simulation for UD carbon fibre under 86 minimum loading rate.
4.36 Analysis of woven carbon fibre at 89
maximum velocity (0.6mm/min)
4.37 Analysis of woven carbon fibre at minimum velocity (0.2mm/min) 89 under compression test.
xvii
NO TITLE PAGE
4.39 Simulation result of woven carbon fibre using loading rate 91 of 0.6mm/min under compression test.
4.40 Check analysis simulation process for woven carbon 92 fibre at loading rate 0.2mm/min
4.41 Simulation result of woven carbon fibre using loading rate 92 of 0.6mm/min under compression test.
4.42 Analysis of woven glass fibre at maximum velocity data 95 under compression test.
4.43 Analysis of woven glass fibre at minimum velocity data 95 under compression test.
4.44 Check analysis simulation process for woven glass 97 fibre at loading rate 0.6mm/min
4.45 Simulation result of woven g;ass fibre using loading rate 97 of 0.6mm/min under compression test.
4.46 Check analysis simulation process for woven glass fibre 98 at loading rate 0.2mm/min
xviii
LIST OF SYMBOL
= Engineering stress
l = Elongation
xix
APPENDIX LIST
BIL TITLE PAGE
1 ASTM D695- compression test 104
1
CHAPTER I
INTRODUCTION
1.0 Introduction
Impact may be defined as the relatively sudden application of an impulsive force, to a limited volume of material or part of a structure. The effect of impacts are widely known and yet analyzing the phenomenon and relating effects to the forces acting and the materials properties, in order to predict the outcome of a particular event, can be very difficult. The impact responses of the laminate specimens with different geometry were very different in fine details in terms of the magnitude of maximum impact force, impact duration and energy absorption, some features were common throughout.
2 1.1 Objectives
The objectives of this research are to study and discuss the effects of different velocity on impact behavior of different types of advanced composite materials.
1.2 Problem Statement
This research has been carried out due to impact problem. Impact damage is the type of damage, which most significantly affects the structural strength.
Therefore, primarily the level of impact damage that is significant to be tolerated and that has to be reliable detected needs to be specified.
1.3 Scope of the research
This research comprises of the following scope:-
a) To do literature study on composite material particularly related to impact. b) To carry out mechanical testing for different type of composite materials at
different velocity.
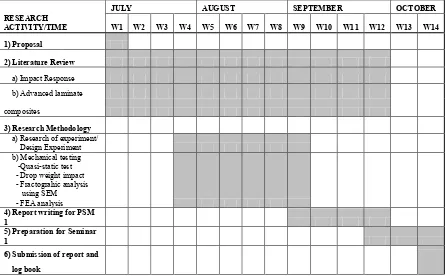
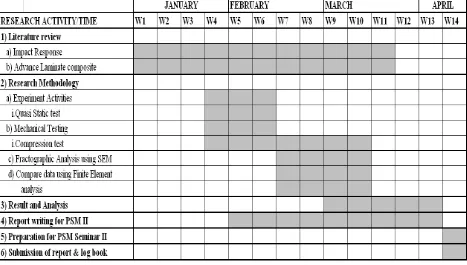
3 1.4 Planning and execution
The research activity that is carried out in this project is tabulated in the Table 1.1 and Table 1.2 for PSM I and PSM II respectively.
[image:23.595.110.555.264.540.2]
Table 1.1: GANTT CHART OF THE RESEARCH FOR PSM I-2008
JULY AUGUST SEPTEMBER OCTOBER
RESEARCH
ACTIVITY/TIME W1 W2 W3 W4 W5 W6 W7 W8 W9 W10 W11 W12 W13 W14
1) Proposal
2) Literature Review
a) Impact Response
b) Advanced laminate
composites
3) Research Methodology
a) Research of experiment/
Design Experiment
b) Mechanical testing -Quasi-static test - Drop weight impact - Fractograhic analysis using SEM
- FEA analysis
4) Report writing for PSM
1
5) Preparation for Seminar
1
6) Submission of report and