CHAPTER 6
CONCLUSION AND RECOMMENDATION
6.1. Conclusion
From the analysis and discussion in improving work
method
in
manual
page
sequencing
division
and
determining the standard time in finishing department,
it can be concluded that :
a. The
new
work
method
design
is
improved
by
eliminating, combining, simplifying, and changing
the sequences. It consist of 10 work elements with
the total time as big as 207.7 second.
b. The total standard time of finishing department is
12.701 per book.
6.2. Recommendation
This
research
is
done
only
for
determining
the
standard
time
for
finishing
department
with
the
improvement in manual page sequencing process. For the
next
research,
it
can
be
used
micromotion
study
for
work motion analysis. The micromotion study use camera
for recording the work motion so it can be more detail
in the analysis. In determining the better work method,
this research only improved for manual page sequencing
For the company, the standard time can be used for
the
tool
to
determine
how
many
times
the
worker
can
finished
the
order.
The
standard
time
is
hopefully
reduce the overtime hours for the worker and certainly
reduce the overtime cost. The better work method can be
used
as
a
tool
to
make
the
workers
more
effective,
REFFERENCES
Barnes, R. M., 1980, Motion and Time Study Design and
Measurement
of
Work,
7
thed,
John
Wiley
&
Sons,
Los Angels.
Meyers, F. E. Dan Stewart, J. R., 2002, Motion and Time
Study
for
Lean
Manufacturing,
7
thed,
Prentice
Hall, New Jersey.
Niebel, Benjamin W., 2003, Methods, Standard, amd Work
Design, 11
thed., McGraw-Hill Book Co., Inc., New
York.
Prasetya,
A.,
2006,
Analisis
Perbaikan
Metode
Kerja
(Studi Kasus di Departemen Perakitan PT. Prestige
Garden
Furniture),
Fakultas
Teknik
Industri,
Universitas Atma Jaya Yogyakarta, Yogyakarta.
Sutalaksana,
I.
Z.,
Anggawisastra,
R.,
Tjakraatmadja,
J.
H.,
2006,
Teknik
Perancangan
Sistem
Kerja,
Depatemen
Teknik
Industri,
Institut
Teknologi
Bandung, Bandung.
Susanto,
B.,2003,
Analisis
Studi
Waktu
dan
Studi
Gerakan Kerja pada Bagian Cover di CV.Andi Offset
Yogyakarta, Fakultas Teknik Industri, Universitas
Atma Jaya Yogyakarta, Yogyakarta.
APPENDIX 1
5.1.Data Analysis in Manual Page Sequencing Process
5.1.1. Current Work Method Analysis
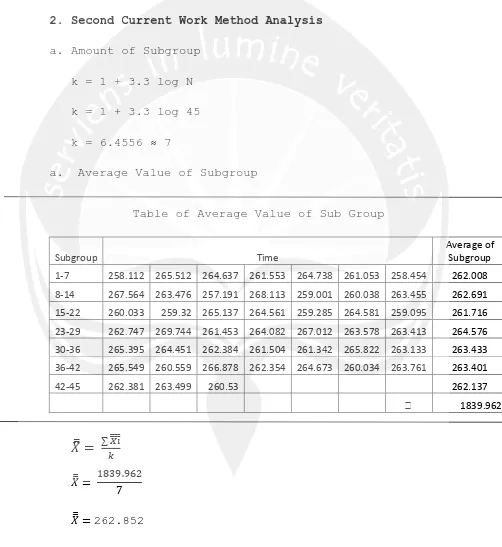
2. Second Current Work Method Analysis
a. Amount of Subgroup
k = 1 + 3.3 log N
k = 1 + 3.3 log 45
k = 6.4556
≈
7
a.
Average Value of Subgroup
Table of Average Value of Sub Group
Subgroup Time
Average of Subgroup 1-7 258.112 265.512 264.637 261.553 264.738 261.053 258.454 262.008 8-14 267.564 263.476 257.191 268.113 259.001 260.038 263.455 262.691 15-22 260.033 259.32 265.137 264.561 259.285 264.581 259.095 261.716 23-29 262.747 269.744 261.453 264.082 267.012 263.578 263.413 264.576 30-36 265.395 264.451 262.384 261.504 261.342 265.822 263.133 263.433 36-42 265.549 260.559 266.878 262.354 264.673 260.034 263.761 263.401
42-45 262.381 263.499 260.53 262.137
1839.962
ܺധ
=
∑ పധധധ b.
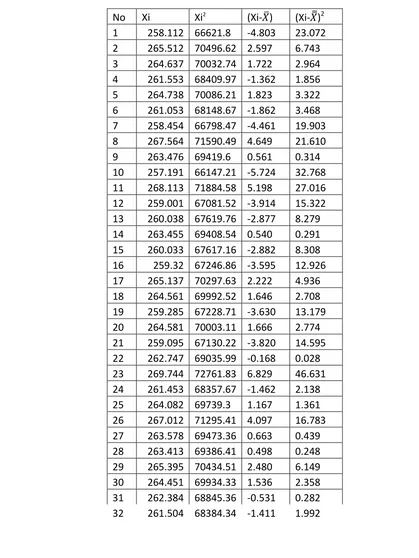
Standard Deviation of Time
Table of Standard Deviation of Time
No Xi Xi2
No Xi Xi2
(Xi-ܺത) (Xi-ܺധ)2 35 263.133 69238.98 0.218 0.047 36 265.549 70516.27 2.634 6.936 37 260.559 67890.99 -2.356 5.552 38 266.878 71223.87 3.963 15.703 39 262.354 68829.62 -0.561 0.315 40 264.673 70051.8 1.758 3.089 41 260.034 67617.68 -2.881 8.302 42 263.761 69569.87 0.846 0.715 43 262.381 68843.79 -0.534 0.286 44 263.499 69431.72 0.584 0.341 45 260.53 67875.88 -2.385 5.690
11831.19 3110962 - 362.6658
ߪ
=
ට
∑(ିധ)మ ேିଵߪ
=
ට
ଷଶ.଼ସଷ ସସߪ = 2.871
c. Standard deviation from sub group average
distribution
σ
ଡ଼ഥ=
√୬
σ
ଡ଼ഥ=
ଶ,√଼ଵd. Upper Control Limit (UCL) and Lower Control
Limit (LCL)
UCL = X
ഥ
+ (3 ×
σ
ଡ଼ഥ)
= 262.195 + (3 × 1.085)
= 265.545
LCL = X
ഥ
−
(3 ×
σ
ଡ଼ഥ)
= 262.195
−
(3 × 1.085)
= 258.940
Control data Test
LCL
≤
ܺଓ
തതത
≤
UCL
258.940
≤
262.008
≤
265.545
Data is consistent
258.940
≤
262.691
≤
265.545
Data is consistent
258.940
≤
261.716
≤
265.545
Data is consistent
258.940
≤
264.576
≤
265.545
Data is consistent
258.940
≤
263.433
≤
265.545
Data is consistent
258.940
≤
263.401
≤
265.545
Data is consistent
e.
Sufficiency data test
The test used
5 % for precision and 95% for
confidence rate.
ܰ
.=
⎣
⎢
⎢
⎡ܭܵටܰ∑ܺ
ଶ−
(
∑ ܺ
)
ଶ∑ ܺ
⎦
⎥
⎥
⎤
ଶܰ
.=
⎣
⎢
⎢
⎡
40
ටܰ ∑ ܺ
ଶ−
(
∑ ܺ
)
ଶ∑ ܺ
⎦
⎥
⎥
⎤
ଶܰ
.=
ቈ
40
√
45 ×
3110962−139977056.811831.19
ଶ
ܰ
.= 0.139036142
ܰ
. N ;
0.1855
45
Data is sufficient
f. Cycle Time Average
ܥݐ
=
∑ ܺ
ܰ
ܥݐ
=
∑ ܺ
ܰ
ܥݐ
=
11831.19
45
3.
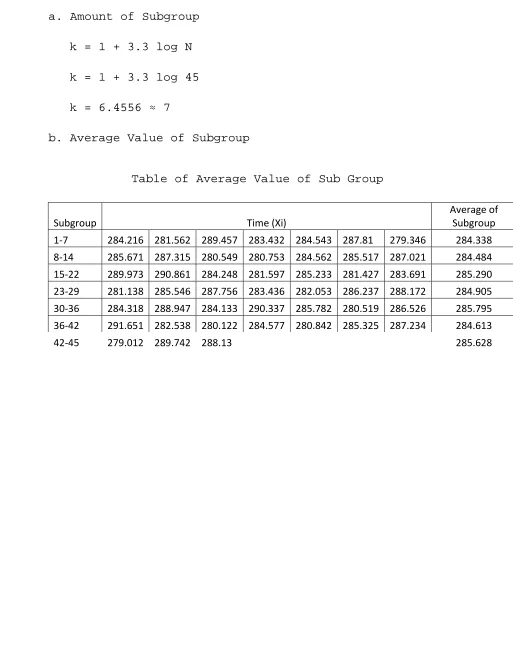
Third Current Work Method Analysis
a. Amount of Subgroup
k = 1 + 3.3 log N
k = 1 + 3.3 log 45
k = 6.4556
≈
7
b. Average Value of Subgroup
Table of Average Value of Sub Group
Subgroup Time (Xi)
Average of Subgroup 1-7 284.216 281.562 289.457 283.432 284.543 287.81 279.346 284.338 8-14 285.671 287.315 280.549 280.753 284.562 285.517 287.021 284.484 15-22 289.973 290.861 284.248 281.597 285.233 281.427 283.691 285.290 23-29 281.138 285.546 287.756 283.436 282.053 286.237 288.172 284.905 30-36 284.318 288.947 284.133 290.337 285.782 280.519 286.526 285.795 36-42 291.651 282.538 280.122 284.577 280.842 285.325 287.234 284.613
42-45 279.012 289.742 288.13 285.628
1995.053
ܺധ
=
∑ పധധധ ܺധ
=
1995.0537
c.
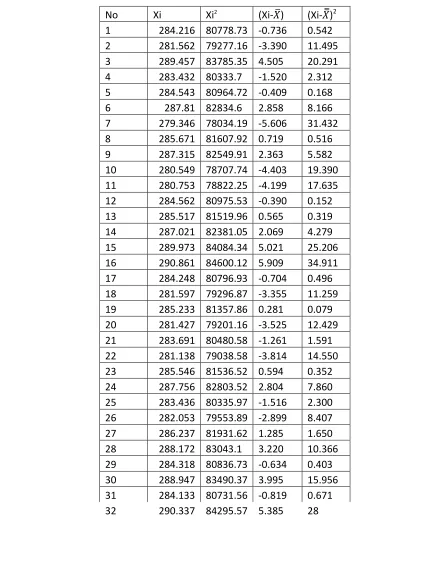
Standard Deviation of Time
Table of Standard Deviation of Time
No Xi Xi2
No Xi Xi2
(Xi-ܺത) (Xi-ܺധ)2 36 291.651 85060.31 6.699 44.871 37 282.538 79827.72 -2.414 5.830 38 280.122 78468.33 -4.830 23.333 39 284.577 80984.07 -0.375 0.141 40 280.842 78872.23 -4.110 16.896 41 285.325 81410.36 0.373 0.139 42 287.234 82503.37 2.282 5.205 43 279.012 77847.7 -5.940 35.289 44 289.742 83950.43 4.790 22.940 45 288.13 83018.9 3.178 10.097 12822.86 3654391 - 487.318
ߪ
=
ට
∑(ିധ)మ ேିଵߪ
=
ට
ସ଼.ଷଵ଼ ସସߪ
= 3.328
d.
Standard deviation from sub group average
distribution
ߪ
ത=
√ఙߪ
ത=
ଷ.√ଷଶ଼e.
Upper Control Limit (UCL) and Lower Control Limit
(LCL)
UCL = X
ഥ
+ (3 ×
σ
ଡ଼ഥ)
= 284.952 + (3 × 1.258)
= 288.726
LCL = X
ഥ
−
(3 ×
σ
ଡ଼ഥ)
= 284.952
−
(3 × 1.258)
= 281.178
Control data Test
LCL
≤
ܺଓ
തതത
≤
UCL
281.178
≤
284.338
≤
288.726
Data is consistent
281.178
≤
284.484
≤
288.726
Data is consistent
281.178
≤
285.290
≤
288.726
Data is consistent
281.178
≤
284.905
≤
288.726
Data is consistent
281.178
≤
285.795
≤
288.726
Data is consistent
281.178
≤
284.613
≤
288.726
Data is consistent
f. Sufficiency data test
The test used
5 % for precision and 95% for
confidence rate.
ܰ
.=
⎣
⎢
⎢
⎡ܭܵ ටܰ∑ܺ
ଶ−
(
∑ ܺ
)
ଶ∑ ܺ
⎦
⎥
⎥
⎤
ଶܰ
.=
⎣
⎢
⎢
⎡
40
ටܰ ∑ ܺ
ଶ−
(
∑ ܺ
)
ଶ∑ ܺ
⎦
⎥
⎥
⎤
ଶܰ
.=
ቈ
40
√
45 ×
3654391−164425738.612822.86
ଶ
ܰ
.= 0.213
ܰ
. N ;
0.213
45
Data is sufficient
g. Cycle Time Average
ܥݐ
=
∑ ܺ
ܰ
ܥݐ
=
12822.86
45
ܥݐ
= 284.952
second
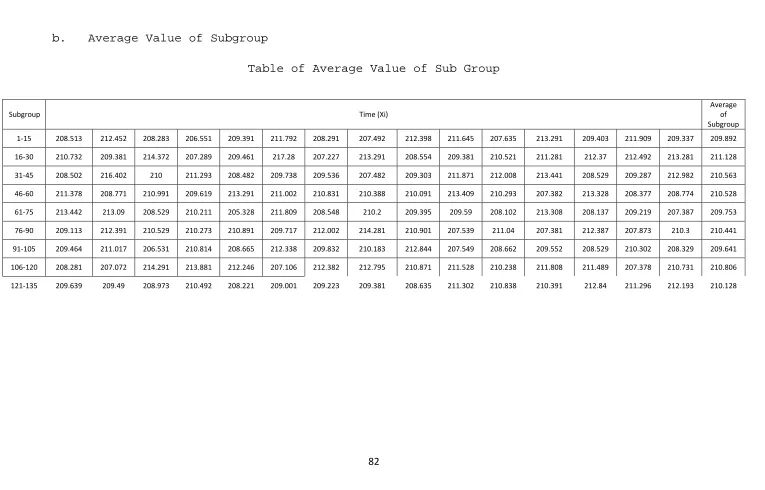
5.1.2. Recommended Work Method Analysis
a. Amount of Subgroup
k = 1 + 3.3 log N
k = 1 + 3.3 log 135
b.
Average Value of Subgroup
Table of Average Value of Sub Group
Subgroup Time (Xi)
Average of Subgroup
1-15 208.513 212.452 208.283 206.551 209.391 211.792 208.291 207.492 212.398 211.645 207.635 213.291 209.403 211.909 209.337 209.892
16-30 210.732 209.381 214.372 207.289 209.461 217.28 207.227 213.291 208.554 209.381 210.521 211.281 212.37 212.492 213.281 211.128
31-45 208.502 216.402 210 211.293 208.482 209.738 209.536 207.482 209.303 211.871 212.008 213.441 208.529 209.287 212.982 210.563
46-60 211.378 208.771 210.991 209.619 213.291 211.002 210.831 210.388 210.091 213.409 210.293 207.382 213.328 208.377 208.774 210.528
61-75 213.442 213.09 208.529 210.211 205.328 211.809 208.548 210.2 209.395 209.59 208.102 213.308 208.137 209.219 207.387 209.753
76-90 209.113 212.391 210.529 210.273 210.891 209.717 212.002 214.281 210.901 207.539 211.04 207.381 212.387 207.873 210.3 210.441
91-105 209.464 211.017 206.531 210.814 208.665 212.338 209.832 210.183 212.844 207.549 208.662 209.552 208.529 210.302 208.329 209.641
106-120 208.281 207.072 214.291 213.881 212.246 207.106 212.382 212.795 210.871 211.528 210.238 211.808 211.489 207.378 210.731 210.806
ܺധ
=
∑ పധധധ ܺധ
=
1892.8809
ܺധ
=
210.32c.
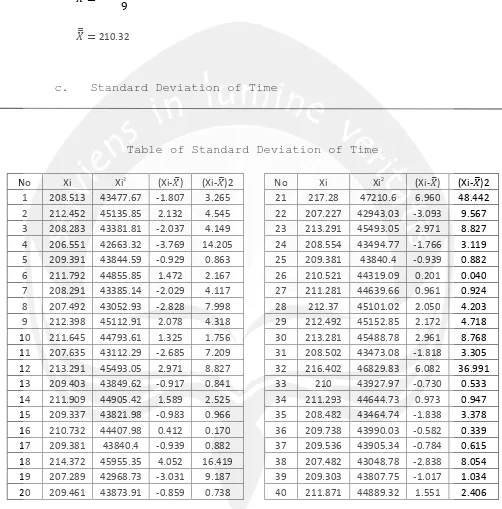
Standard Deviation of Time
Table of Standard Deviation of Time
No Xi Xi2 (Xi-ܺത) (Xi-ܺത)2 No Xi Xi2 (Xi-ܺത) (Xi-ܺത)2
No Xi Xi2
(Xi-ܺത) (Xi-ܺത)2 No Xi Xi2
No Xi Xi2
(Xi-X) (Xi-X)2 121 209.64 43948.51 -0.681 0.464 122 209.49 43886.06 -0.830 0.689 123 208.97 43669.71 -1.347 1.814 124 210.49 44306.88 0.172 0.030 125 208.22 43355.98 -2.099 4.406 126 209 43681.42 -1.319 1.740 127 209.22 43774.26 -1.097 1.203 128 209.38 43840.4 -0.939 0.882 129 208.64 43528.56 -1.685 2.839 130 211.3 44648.54 0.982 0.964 131 210.84 44452.66 0.518 0.268 132 210.39 44264.37 0.071 0.005 133 212.84 45300.87 2.520 6.350 134 211.3 44646 0.976 0.953 135 212.19 45025.87 1.873 3.508 28393 5972261 0.003 602.191
ߪ
=
ට
∑(ିധ)మ ேିଵߪ
=
ට
ଶ.ଵଽଵ ଵଷସߪ = 2.120
d.
Standard deviation from sub group average
distribution
σ
ଡ଼ഥ=
√୬
σ
ଡ଼ഥ=
ଶ.ଵଶ√ଵହ
e.
Upper Control Limit (UCL) and Lower Control Limit
(LCL)
UCL = X
ഥ
+ (3 ×
σ
ଡ଼ഥ)
= 210.32 + (3 × 0.547)
= 211.961
LCL = X
ഥ
−
(3 ×
σ
ଡ଼ഥ)
= 210.32
−
(3 × 0.547)
= 208.679
Control data Test
LCL
≤
ܺଓ
തതത
≤
UCL
208.679
≤
209.892
≤
211.961
Data is consistent
208.679
≤
211.128
≤
211.961
Data is consistent
208.679
≤
210.563
≤
211.961
Data is consistent
208.679
≤
210.528
≤
211.961
Data is consistent
208.679
≤
209.753
≤
211.961
Data is consistent
208.679
≤
210.441
≤
211.961
Data is consistent
208.679
≤
210.806
≤
211.961
Data is consistent
f. Sufficiency data test
The test used
5 % for precision and 95% for
confidence rate.
ܰ
.=
⎣
⎢
⎢
⎡ܭܵටܰ∑ܺ
ଶ−
(
∑ ܺ
)
ଶ∑ ܺ
⎦
⎥
⎥
⎤
ଶܰ
.=
⎣
⎢
⎢
⎡
40
ටܰ ∑ ܺ
ଶ−
(
∑ ܺ
)
ଶ∑ ܺ
⎦
⎥
⎥
⎤
ଶܰ
.=
ቈ
40
√
135 ×
5972261−80616244928393
ଶ
ܰ
.= 0.184
ܰ
. N ;
0.814
135
Data is sufficient
g. Cycle Time Average
ܥݐ
=
∑ ܺ
ܰ
ܥݐ
=
28393
135
APPENDIX 2
5.4. Data Analysis in Packaging and Finishing
a. Amount of Subgroup
k = 1 + 3.3 log N
k = 1 + 3.3 log 30
k = 4.875
≈
5
b. Average Value of Subgroup
Table of Average Value of Sub Group
Subgroup Time (Xi)
Average of Subgroup 1-6 45.98 51.34 47.62 46.56 52.57 43.78 47.975 7-12 45.69 43.76 49.05 46.21 50.04 48.77 47.253 13-19 52.39 47.45 45.92 51.28 48.91 46.58 48.755 19-24 46.02 50.26 51.45 45.34 47.73 46.56 47.893 25-30 48.11 45.39 51.49 47.56 49.56 52.37 49.080
240.957
ܺധ
=
∑ పധധധ
ܺധ
=
240.957
5
b.
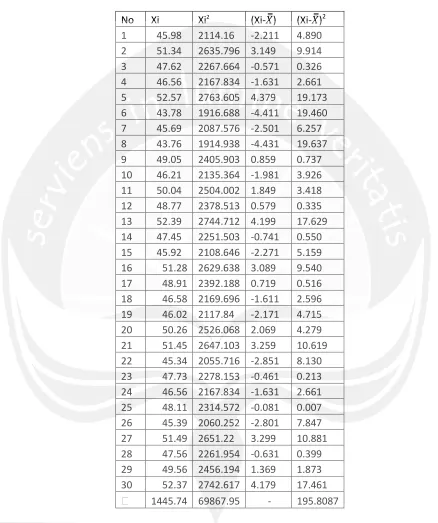
Standard Deviation of Time
Table of Standard Deviation of Time
No Xi Xi2
ߪ
=
ට
∑(ିധ)మ ேିଵߪ
=
ට
ଵଽହ.଼ଽ ଶଽߪ = 2.644
c.
Standard deviation from sub group average
distribution
σ
ଡ଼ഥ=
√୬
σ
ଡ଼ഥ=
ଶ.ସସ√
ߪ
ത= 1.079
d.
Upper Control Limit (UCL) and Lower Control Limit
(LCL)
ܷܥܮ
=
ܺധ
+ (3
x
ߪ
ത)
= 48.191 + (3
x
1.079)
= 51.428
ܮܥܮ
=
ܺധ
−
(3
x
ߪ
ത)
= 48.191
−
(3
x
1.079)
Control data Test
LCL
≤
ܺଓ
തതത
≤
UCL
44.954
≤
47.975
≤
51.428
Data is
consistent
44.954
≤
47.253
≤
51.428
Data is
consistent
44.954
≤
48.755
≤
51.428
Data is
consistent
44.954
≤
47.893
≤
51.428
Data is
consistent
44.954
≤
49.08
≤
51.428
Data is
consistent
e.
Sufficiency data test
The test used
5 % for precision and 95% for
confidence rate.
ܰ
.=
⎣
⎢
⎢
⎡ܭܵටܰ∑ܺ
ଶ−
(
∑ ܺ
)
ଶ∑ ܺ
⎦
⎥
⎥
⎤
ଶܰ
.=
⎣
⎢
⎢
⎡
40
ටܰ ∑ ܺ
ଶ−
(
∑ ܺ
)
ଶ∑ ܺ
ܰ
.=
ቈ
40
√
30 ×
69867.95−2090164.1481445.74
ଶ
ܰ
.= 4.497
ܰ
. N ;
4.497
30
Data is sufficient
f.
Cycle Time Average
ܥݐ
=
∑ ܺ
ܰ
ܥݐ
=
∑ ܺ
ܰ
ܥݐ
=
1445.74
30
ܥݐ
= 48.191
second
g.
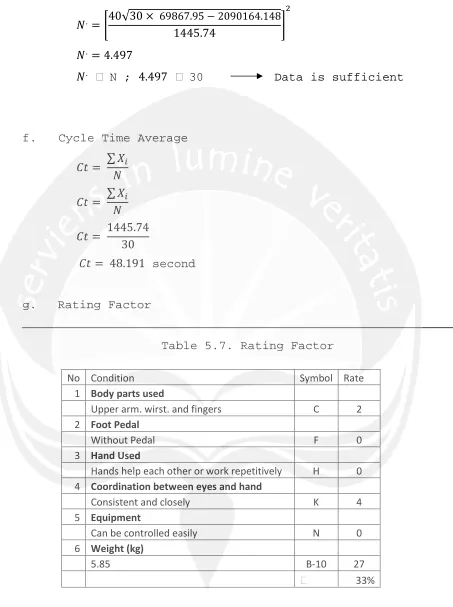
Rating Factor
Table 5.7. Rating Factor
No Condition Symbol Rate
1 Body parts used
Upper arm. wirst. and fingers C 2 2 Foot Pedal
Without Pedal F 0
3 Hand Used
Hands help each other or work repetitively H 0 4 Coordination between eyes and hand
Consistent and closely K 4
5 Equipment
Can be controlled easily N 0 6 Weight (kg)
5.85 B-10 27
The workers did the work in normally speed. so
p1 has been valued by 1 or p1 = 1
P2
= 1 + 0.33
= 1.33
P
= 1 x 1.33
= 1.33
h. Normal Time
Nt
= Ct x p
= 48.191 x 1.33
= 64.094
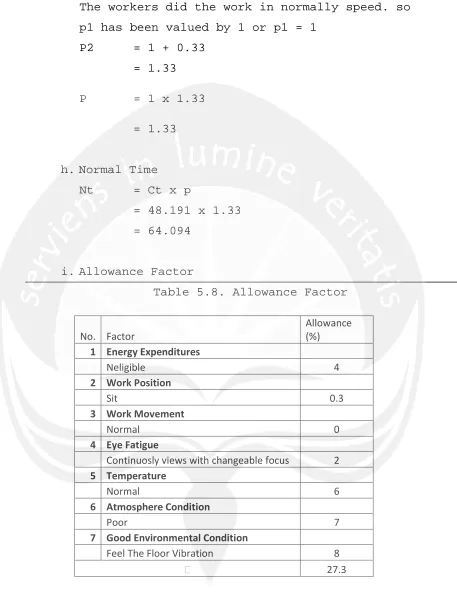
i. Allowance Factor
Table 5.8. Allowance Factor
No. Factor
Allowance (%)
1 Energy Expenditures
Neligible 4
2 Work Position
Sit 0.3
3 Work Movement
Normal 0
4 Eye Fatigue
Continuosly views with changeable focus 2
5 Temperature
Normal 6
6 Atmosphere Condition
Poor 7
7 Good Environmental Condition
Feel The Floor Vibration 8
For the personal needs
= 1 %
For inevutable obstacles
= 2 %
Allowance Factor
= 27.3 % + 1 & + 2 &
= 30.3 %
w.
Standard Time
St
= Nt x (1 + a)
= 64.094 x 1.303
= 83.515 second
x.
Standard Time for 30 box
St
= 83.515 second x 30
APPENDIX 3
5.5. Transport Time
5.5.1. Transport Time from Manual Page Sequencing
Process to Binding Process
1. Amount of Subgroup
k = 1 + 3.3 log N
k = 1 + 3.3 log 20
k = 5.293
≈
5
2. Average Value of Subgroup
Table of Average Value of Sub Group
Subgroup Time (Xi)
Average of Subgroup 1-4 72.625 73.541 72.389 71.652 72.552 5-8 73.457 72.264 71.345 74.285 72.838 9-12 72.411 71.275 73.114 72.348 72.287 13-16 71.520 73.459 71.246 70.421 71.662 17-20 72.873 69.758 72.482 73.716 72.207
361.545
ܺധ
=
∑ పധധധ ܺധ
=
361.5455
3. Standard Deviation of Time
Table of Standard Deviation of Time
No Xi Xi2 (Xi-X) (Xi-X)2 1 72.625 5274.391 0.316 0.100 2 73.541 5408.279 1.232 1.518 3 72.389 5240.167 0.080 0.006 4 71.652 5134.009 -0.657 0.432 5 73.457 5395.931 1.148 1.318 6 72.264 5222.086 -0.045 0.002 7 71.345 5090.109 -0.964 0.929 8 74.285 5518.261 1.976 3.904 9 72.411 5243.353 0.102 0.010 10 71.275 5080.126 -1.034 1.069 11 73.114 5345.657 0.805 0.648 12 72.348 5234.233 0.039 0.002 13 71.52 5115.11 -0.789 0.623 14 73.459 5396.225 1.150 1.322 15 71.246 5075.993 -1.063 1.130
16 70.421 4959.117 -1.888 3.565 17 72.873 5310.474 0.564 0.318
18 69.758 4866.179 -2.551 6.508 19 72.482 5253.64 0.173 0.030
20 73.716 5434.049 1.407 1.980 1446.181 104597.4 0 25.413
ߪ
=
ට
∑(ିധ)మ ே4. Standard deviation from sub group average
distribution
σ
ଡ଼ഥ=
√୬σ
ଡ଼ഥ=
ଵ.√ଵଶସߪ
ത= 0.564
5. Upper Control Limit (UCL) and Lower Control Limit
(LCL)
ܷܥܮ
=
ܺധ
+ (3
ݔ ߪ
ത)
= 72.309 + (3
ݔ
0.564)
= 74.001
ܮܥܮ
=
ܺധ
−
(3
ݔ ߪ
ത)
= 72.309
−
(3
ݔ
0.564)
= 70.617
Control data Test
LCL
≤
ܺଓ
തതത
≤
UCL
70.617
≤
72.552
≤
74.001
Data is consistent
70.617
≤
72.838
≤
74.001
Data is consistent
70.617
≤
72.287
≤
74.001
Data is consistent
70.617
≤
72.207
≤
74.001
Data is consistent
6. Sufficiency data test
The test used
5 % for precision and 95% for
confidence rate.
ܰ
.=
⎣
⎢
⎢
⎡ܭܵටܰ∑ܺ
ଶ−
(
∑ ܺ
)
ଶ∑ ܺ
⎦
⎥
⎥
⎤
ଶܰ
.=
⎣
⎢
⎢
⎡
40
ටܰ ∑ ܺ
ଶ−
(
∑ ܺ
)
ଶ∑ ܺ
⎦
⎥
⎥
⎤
ଶܰ
.=
ቈ
40
√
20 × 104597.4
−
2091439.485
1446.181
ଶ
ܰ
.= 0.389
ܰ
. N ;
0.389
20
Data is sufficient
7. Transport Time Average
ܶݐ
=
∑ ܺ
ܰ
ܶݐ
=
∑ ܺ
ܰ
ܶݐ
=
1446.181
20
5.5.2. Transport Time from Binding Process to Cutting
Process
1.
Amount of Subgroup
k = 1 + 3.3 log N
k = 1 + 3.3 log 20
k = 5.293
≈
5
[image:32.595.62.558.93.751.2]2. Average Value of Subgroup
Table of Average Value of Sub Group
Subgroup Time (Xi)
Average of Subgroup 1-4 44.138 42.355 42.591 45.246 43.583 5-8 41.276 43.588 42.617 43.542 42.756 9-12 42.052 43.528 44.382 41.201 42.791 13-16 43.511 45.379 42.001 43.627 43.630 17-20 41.982 40.077 44.291 42.389 42.185
214.943
ܺധ
=
∑ పധധധ ܺധ
=
214.9435
3. Standard Deviation of Time
Table of Standard Deviation of Time
No Xi Xi2
(Xi-ܺധ) (Xi-ܺധ)2 1 44.138 1948.163 1.149 1.320 2 42.355 1793.946 -0.634 0.402 3 42.591 1813.993 -0.398 0.158 4 45.246 2047.201 2.257 5.094 5 41.276 1703.708 -1.713 2.934 6 43.588 1899.914 0.599 0.359 7 42.617 1816.209 -0.372 0.138 8 43.542 1895.906 0.553 0.306 9 42.052 1768.371 -0.937 0.878 10 43.528 1894.687 0.539 0.291 11 44.382 1969.762 1.393 1.940 12 41.201 1697.522 -1.788 3.197 13 43.511 1893.207 0.522 0.272 14 45.379 2059.254 2.390 5.712 15 42.001 1764.084 -0.988 0.976
16 43.627 1903.315 0.638 0.407 17 41.982 1762.488 -1.007 1.014
18 40.077 1606.166 -2.912 8.480 19 44.291 1961.693 1.302 1.695
20 42.389 1796.827 -0.600 0.360 859.773 36996.42 - 35.935
ߪ
=
ට
∑(ିധ)మ ேσ
=
ට
ଷହ.ଽଷହ ଶ4. Standard deviation from sub group average
distribution
σ
ଡ଼ഥ=
√୬σ
ଡ଼ഥ=
ଵ.√ଽସσ
ଡ଼ഥ= 0.898
5. Upper Control Limit (UCL) and Lower Control Limit
(LCL)
ܷܥܮ
=
ܺധ
+ (3 ×
ߪ
ത)
= 42.989 + (3 × 0.898)
= 45.683
ܮܥܮ
=
ܺധ
−
(3 ×
ߪ
ത)
= 42.989
−
(3 × 0.898)
= 40.295
Control data Test
LCL
≤
ܺଓ
തതത
≤
UCL
40.295
≤
43.583
≤
45.683
Data is consistent
40.295
≤
42.756
≤
45.683
Data is consistent
40.295
≤
42.791
≤
45.683
Data is consistent
40.295
≤
43.630
≤
45.683
Data is consistent
6. Sufficiency data test
The test used
5 % for precision and 95% for
confidence rate.
ܰ
.=
⎣
⎢
⎢
⎡
40
ටܰ ∑ ܺ
ଶ−
(
∑ ܺ
)
ଶ∑ ܺ
⎦
⎥
⎥
⎤
ଶܰ
.=
ቈ
40
√
20 × 36966.42
−
739209.612
859.773
ଶ
ܰ
.= 0.257
ܰ
. N ;
0.257
20
Data is sufficient
7. Transport Time Average
ܶݐ
=
∑ ܺ
ܰ
ܶݐ
=
∑ ܺ
ܰ
ܶݐ
=
859.773
20
ܶݐ
= 42.989
second
5.5.3. Transport Time Cutting Process to Inspection and
Packaging Process
1.
Amount of Subgroup
k = 1 + 3.3 log N
2.
Average Value of Subgroup
Table of Average Value of Sub Group
Subgroup Time (Xi)
Average of Subgroup 1-4 20.481 21.056 21.562 22.411 21.378 5-8 20.788 22.56 23.761 21.927 22.259 9-12 22.304 20.552 21.889 22.371 21.779 13-16 24.872 21.746 21.435 20.819 22.218 17-20 22.001 21.938 23.402 20.376 21.929
109.563
ܺധ
=
∑ పധധധ ܺധ
=
109.5635
3.
Standard Deviation of Time
Table of Standard Deviation of Time
No Xi Xi2
(Xi-ܺധ) (Xi-ܺധ)2 1 20.481 419.4714 -1.432 2.051 2 21.056 443.3551 -0.857 0.734 3 21.562 464.9198 -0.351 0.123 4 22.411 502.2529 0.498 0.248 5 20.788 432.1409 -1.125 1.266 6 22.56 508.9536 0.647 0.419 7 23.761 564.5851 1.848 3.415 8 21.927 480.7933 0.014 0.000 9 22.304 497.4684 0.391 0.153 10 20.552 422.3847 -1.361 1.852 11 21.889 479.1283 -0.024 0.001 12 22.371 500.4616 0.458 0.210 13 24.872 618.6164 2.959 8.756 14 21.746 472.8885 -0.167 0.028 15 21.435 459.4592 -0.478 0.228
16 20.819 433.4308 -1.094 1.197 17 22.001 484.044 0.088 0.008
18 21.938 481.2758 0.025 0.001 19 23.402 547.6536 1.489 2.217
20 20.376 415.1814 -1.537 2.362 438.251 9628.465 - 25.268
ߪ
= 1.263
4. Standard deviation from sub group average
distribution
ߪ
ത=
√ఙߪ
ത=
ଵ.ଶଷ√ସ
ߪ
ത= 0.632
5. Upper Control Limit (UCL) and Lower Control Limit
(LCL)
ܷܥܮ
=
ܺധ
+ (3 ×
ߪ
ത)
= 21.913 + (3 × 0.632)
= 23.809
ܮܥܮ
=
ܺധ
−
(3 ×
ߪ
ത)
= 21.913
−
(3 × 0.632)
= 20.017
Control data Test
LCL
≤
ܺଓ
തതത
≤
UCL
20.017
≤
43.583
≤
23.809
Data is consistent
20.017
≤
43.583
≤
23.809
Data is consistent
20.017
≤
43.583
≤
23.809
Data is consistent
6. Sufficiency data test
The test used
5 % for precision and 95% for
confidence rate.
ܰ
.=
⎣
⎢
⎢
⎡ܭܵටܰ∑ܺ
ଶ−
(
∑ ܺ
)
ଶ∑ ܺ
⎦
⎥
⎥
⎤
ଶܰ
.=
⎣
⎢
⎢
⎡
40
ටܰ ∑ ܺ
ଶ−
(
∑ ܺ
)
ଶ∑ ܺ
⎦
⎥
⎥
⎤
ଶܰ
.=
ቈ
40
√
20 × 9628.465
−
192063.939
438.251
ଶ
ܰ
.= 2.052
ܰ
. N ;
2.052
20
Data is sufficient
7. Transport Time Average
ܶݐ
=
∑ ܺ
ܰ
ܶݐ
=
438.251
20
APPENDIX 4
OBJECTIVE RATING FACTOR TABLE
Condition Symbol Rating Body Parts Used
Fingers A 0
Wrist hand from fingers B 1
Lower Arm, Wrist Hand, and Fingers C 2
Upper Arm, Lower Arm, etc D 5
Body E 6
Lift weight from the floor E2 10
Foot Pedal
Without pedal or one pedal with the point
below the foot F 0
One or two pedal with point is not below
the foot G 5
Hand Used
hand help each other or work repetitively H 0 Two of hands work with the same motion H2 18
Coordination between eyes and hand
Very small I 0
Close enough J 2
Constant and close K 4
Very close L 7
Smaller than 0,04 cm M 10
Equipment
Can be control easily N 0
With few control O 1
Need to control and pressure P 2
Need to be solved carefully Q 3
Easily broken R 5
Weight (kg)
0.45 B-1 2
0.90 B-2 5
1.35 B-3 6
1.80 B-4 10
2.25 B-5 13
2.70 B-6 15
3.15 B-7 17
3.60 B-8 19
4.05 B-9 20
4.50 B-10 22
4.95 B-11 24
Continue to Allowance Factor Table
Factor Work Example
E. Temperature **) Temperature Normal Weakness Excessiveness
1.Freeze Below 0 Above 10 above 12
2.Low 0-13 10-0 12 - 5
3. Medium 13-22 5-0 8 - 0
4. Normal 22-28 0-5 0 - 8
5. High 28-38 5-40 8 - 100
6. Very High Above 38 Above 40 Above 100
F. Atmosphere Condition ***)
1. Good Good ventilation room, fresh air
2. Fair Poor ventilation, there is smell (not dangerous) 3. Poor Poisonous dust, or unpoisonous but in high quantity
4. Bad There is dangerous smell which must used breathing equipment
*) Color contrast is noted
0 0 - 5 5 - 10 10 - 20 Allowance (%)
7. Special condition (smell, clean, ect) G. Good Environmental Condition
0 0 - 1 1 - 3 0 - 5 0 - 5 5 - 10 5 - 15 1. Clean, Health, Bright with low noise
2. Repetitive work cycle between 5 -10 3. Repetitive work cycle between 0 - 5 4. Very noisy
Factor
A. Energy expenditure Weight Equivalent (kg) Male Female
1.Negligible Work in table, sit down Without weight 0,0 - 6,0 0,0 - 6,0 2. Very light Work in table, stand up 0,00-2,25 6,0 - 7,5 6,0 - 7,5
3. Light Lightweight shovel 2,25-9,00 7,5 - 12,0 7,5 - 16,0
4. Medium Hoe 9,00-18,00 12,0 - 19,0 16,0 - 30,0
5. Heavy Swinging a heavy hammer 18,00-27,00 19,0 - 30,0
6. Very Heavy Shouldering weight 27,00-50,00 30,0 - 50,0
7. Extraordinary Heavy Carrying heavy sack above 50 B. Work Position
1. Sit
2.Stand on two leg 3. Stand on one leg 4.Lie
5.Bend
C. Work Movement 1. Normal
2, Rather limited 3. Hard
4. In the limited body part 5. All of body part is limited D. Eye Fatigue *)
Good Bad
1.Disjoint views 0 1
Lighting
Work in the hallway mining 10,0 - 15,0
0 - 5,0 0 - 5,0 5,0 - 10
Read measurement tool Bend body relies on two leg free swing of the hammer limited swing of the hammer
carrying heavy weight with one hand Work with hand upper the head
APPENDIX 5 Allowance Factor Table
4,0 - 10,0
Work Example Allowance (%)
0,0 - 1,0 1,0 - 2,5 2,5 - 4,0 Work with sit easily
Upright body, supported on two leg One leg did the control
On the body side, back, or front body 2,5 - 4,0
Job : Manual page sequencing Department : Finishing
No Chart : 1
Observer : Randi Selo Abi Date : January 3rd, 2011
Current (v ) Recommended ( )
1 : Bundle 1 5 : Bundle 5F : Finished Product
2 : Bundle 2 6 : Bundle 6
3 : Bundle 3 7 : Bundle 7
4 : Bundle 4 8 : Bundle 8
No
Description Distance Time Time Distance Description (cm) (second) (second) (cm)
1 Reach bundle 5 72,5 0,7 RE RE 0,7 60,5 Reach bundle 1 2 Reach bundle 6 74 0,7 RE G 0,7 Hold bundle 1 3 Hold bundle 5 and 6 0,7 G RE 0,7 75 Reach bundle 2 4 Reach bundle 7 55 0,7 RE RE 0,7 71,5 Reach bundle 3 5 Hold bundle 5,6 and 7 0,7 G RE 0,7 66 Reach bundle 4 6 Reach bundle 8 48,5 0,7 RE G 0,7 Hold bundle 1,2,3, and 4 7 Put bundle 5,6,7, and 8 to the table 0,5 RL G 0,5 Hold bundle 1,2,3, and 4 8 Idle 0,5 D RL 0,5 Put bundle 1,2,3 and 4 to the table 9 Arrange the bundle into one 1 P P 1 Arrange the bundle into one 11 Put the bundle vertically in table 0,6 RL RL 0,6 Put the bundle vertically in table 12 Set the bundle vertically (2 x ) 0,8 P P 0,8 Set the bundle vertically (2 x)
13 Idle 240 D RL 240 48,5 Put the bundle into the finish place (30 x)
14 Idle 1 D G 1 Take the finish bundle
16 Bring the finished bundle to the pallet 137,5 8 M M 8 137,5 Bring the finished bundle to the pallet 17 Put the finished bundle to the pallet 0,7 RL RL 0,7 Put the finished bundle to the pallet
TOTAL 249,7 249,7
Symbol
LEFT HAND RIGHT HAND
RIGHT HAND LEFT HAND CHART
APPENDIX 6
Job : Manual page sequencing Department : Finishing
No Chart : 2
Observer : Randi Selo Abi Date : January 3rd
Current (v ) Recommended ( )
1 : Bundle 15 : Bundle 5F : Finished Product
2 : Bundle 26 : Bundle 6
3 : Bundle 37 : Bundle 7
4 : Bundle 48 : Bundle 8
No
Description Distance Time Time Distance Description (cm) (second) (second) (cm)
1 Reach bundle 5 72,5 0,7 R R 0,7 60,5 Reach bundle 1 2 Reach bundle 6 74 0,7 R G 0,7 Hold bundle 1 3 Hold bundle 5 and 6 0,7 G R 0,7 75 Reach bundle 2 4 Reach bundle 7 55 0,7 R G 0,7 Hold bundle 1 and 2 5 Hold bundle 5,6 and 7 0,7 G R 0,7 71,5 Reach bundle 3 6 Hold bundle 5,6 and 7 0,6 G R 0,6 66 Reach bundle 4 7 Reach bundle 8 48.5 0,4 R G 0,4 Hold bundle 1,2,3, and 4 8 Put bundle 5,6,7, and 8 to the table 0,5 RL G 0,5 Hold bundle 1,2,3, and 4 9 Idle 0,5 D RL 0,5 Put bundle 1,2,3 and 4 to the table 10 Arrange the bundle into one 1 P P 1 Arrange the bundle into one 12 Put the bundle vertically in table 0,4 RL RL 0,4 Put the bundle vertically in table 13 Set the bundle vertically (3 x ) 0,8 P P 0,8 Set the bundle vertically (3 x) 14 Set the bundle horizontally 0,5 P P 0,5 Set the bundle horizontally
15 Idle 258 D RL 258 48,5 Put the bundle into the finish place (30 x) 16 Take the finished bundle 1 D G 1 Take the finish bundle
18 Bring the finished bundle to the pallet 137,5 8 M M 8 137,5 Bring the finished bundle to the pallet 19 Put the finished bundle to the pallet 0,7 RL RL 0,7 Put the finished bundle to the pallet
TOTAL 267,7 267,7
Symbol
RIGHT HAND LEFT HAND CHART
RIGHT HAND LEFT HAND
APPENDIX 7
Job
Department : Finishing
No Chart : 3
Obs erver : Randi Selo Abi
Dat e : January 3rd, 2011
Current ( v ) Recommended ( )
1 : Bundle 1 5 : Bundle 5 F : Finished Product 2 : Bundle 2 6 : Bundle 6
3 : Bundle 3 7 : Bundle 7 4 : Bundle 4 8 : Bundle 8
No
Description Distance Time Time Distance Description (cm) (second) (second) (cm)
1 Idle 0,7 D R 0,7 45 Reach the bundle 1 2 Idle 0,7 D R 0,7 75 Reach the bundle 2 3 Reach the bundle 5 72,5 0,7 R R 0,7 74 Reach the bundle 3 4 Reach the bundle 6 74 0,7 R R 0,7 66 Reach the bundle 4 5 Reach the bundle 7 55 0,7 R G 0,7 Hold the bundle 1,2,3, and 4 6 Reach the bundle 8 48,5 0,5 R G 0,5 Hold the bundle 1,2,3, and 4 7 Put the bundle 5,6,7, and 8 to the table 0,4 RL D 0,4 Idle
8 Idle 0,4 D RL 0,4 Put the bundle 1,2,3, and 4 to the table 9 Arrange bundles into 1 bundle 1 P P 1 Arrange bundles into 1 bundle 10 Take the bundle from table 0,4 G G 0,4 Take the bundle from table 12 Put the bundle vertically 0,5 RL RL 0,5 Put the bundle vertically 13 Set the bundle vertically (2 x) 0,8 P P 0,8 Set the bundle vertically (2 x) 15 Rotate the bundle horizontally 0,4 P P 0,4 Rotate the bundle horizontally 16 Put the bundle horizontally 0,4 RL RL 0,4 Put the bundle horizontally 17 Set the bundle horizontally (2 x) 0,8 P P 0,8 Set the bundle horizontally (2 x) 18 Idle 273 D RL 273 43 Put the bundle to the finish place (30x) 19 Take the finished bundle 1 G G 1 Take the finished bundle
21 Bring the finished bundle to the pallet 137,5 8 M M 8 137,5 Bring the finished bundle to the pallet 22 Put the finished bundle to the pallet 0,7 RL RL 0,7 Put the finished bundle to the pallet
TOTAL 282,7 282,7
Symbol
RIGHT HAND LEFT HAND
APPENDIX 8
RIGHT HAND LEFT HAND CHART
No Symbol
Description Distance Time Time Distance Description (cm) (second) (second) (cm)
1 Reach bundle 5 72,5 0,9 R R 0,9 60,5 Reach bundle 1 2 Reach bundle 6 74 0,9 R R 0,9 74 Reach bundle 2 3 Reach bundle 7 71,5 0,9 R R 0,9 71,5 Reach bundle 3 4 Reach bundle 8 48,5 0,8 R R 0,8 66 Reach bundle 4
5 Arrange the bundle into one vertically 1,2 P P 1,2 Arrange the bundle into one vertically 6 Set the bundle (2 x ) 1,5 P P 1,5 Set the bundle (2 x)
7 Idle 198 D RL 198 45 Put the bundle to the finished bundle place (30 x) 8 Take the bundle from finished bundle place 1 G G 1 Take the bundle from finished bundle place 9 Bring the finished bundle to the pallet 137,5 8 M M 8 137,5 Bring the finished bundle to the pallet 10 Put the finished bundle to pallet 0,7 RL RL 0,7 Put the finished bundle to pallet
TOTAL 207,7 207,7
APPENDIX 9
Right Hand-Left Hand Chart of Recommended Work Method
113
LEFT HAND RIGHT HAND
No
Recommended Current Current Recommended
1 Reach bundle 5 Reach bundle 5 Reach bundle 1 Reach bundle 1 2 Reach bundle 6 Reach bundle 6 Hold bundle 1
3 Hold bundle 5 and 6 Reach bundle 2
4 Reach bundle 7 Reach bundle 3 Reach bundle 3
5 Hold bundle 5,6 and 7 Reach bundle 4
6 Reach bundle 8 Hold bundle 1,2,3, and 4
7 Put bundle 5,6,7, and 8 to the table Hold bundle 1,2,3, and 4
8 Idle Put bundle 1,2,3 and 4 to the table
9 Arrange the bundle into one Arrange the bundle into one Arrange the bundle into one Arrange the bundle into one
10 - Put the bundle vertically in table Put the bundle vertically in table
-11 Set the bundle vertically (2 x ) Set the bundle vertically (2 x ) Set the bundle vertically (2x) Set the bundle vertically (2x) 12 Idle Idle Put the bundle into the finish place Put the bundle into the finish place
13 Take the finished bundle Take the finished bundle Take the finished bundle Take the finished bundle
14 Bring the finished bundle to the pallet Bring the finished bundle to the pallet Bring the finished bundle to the pallet Bring the finished bundle to the pallet
15 Put the finished bundle to the pallet Put the finished bundle to the pallet Put the finished bundle to the pallet Put the finished bundle to the pallet
Combine
Eliminate Reach bundle 8
Reach Bundle 7
1st Work Method Analysis
Left Hand Right Hand
APPENDIX 10
Put bundle 1,2,3 and 4 to the table Reach bundle 4
Reach bundle 2
No
Recommended Current Current Recommended
1 Reach bundle 5 Reach bundle 5 Reach bundle 1 Reach bundle 1 2 Reach bundle 6 Reach bundle 6 Hold bundle 1
3 Hold bundle 5 and 6 Reach bundle 2
4 Reach bundle 7 Hold bundle 1 and 2
5 Hold bundle 5,6 and 7 Reach bundle 3
6 Hold bundle 5,6 and 7 Reach bundle 4
7 Reach bundle 8 Hold bundle 1,2,3, and 4
8 Put bundle 5,6,7, and 8 to the table Hold bundle 1,2,3, and 4
9 Idle Put bundle 1,2,3 and 4 to the table
10 Arrange the bundle into one Arrange the bundle into one Arrange the bundle into one Arrange the bundle into one
11 - Put the bundle vertically in table Put the bundle vertically in table -12 Set the bundle vertically (2 x ) Set the bundle vertically (3 x ) Set the bundle vertically (3 x) Set the bundle vertically (2 x)
13 - Set the bundle horizontally Set the bundle horizontally
-14 Idle Idle Put the bundle into the finish place Put the bundle into the finish place
15 Take the finished bundle Take the finished bundle Take the finish bundle Take the finish bundle
16 Bring the finished bundle to the pallet Bring the finished bundle to the pallet Bring the finished bundle to the pallet Bring the finished bundle to the pallet 17 Put the finished bundle to the pallet Put the finished bundle to the pallet Put the finished bundle to the pallet Put the finished bundle to the pallet
Combine
Eliminate
2nd Work Method Analysis
APPENDIX 11
Right Hand Left Hand
Put bundle 1,2,3 and 4 to the table Reach bundle 4
Reach bundle 3 Reach bundle 2 Reach bundle 7
Reach bundle 8
No Left Hand Right Hand
Recommended Current Current Recommended
1 Reach the bundle 5 Idle Reach the bundle 1 Reach the bundle 1
2 Idle Reach the bundle 2 Reach the bundle 2
3 Reach the bundle 5 Reach the bundle 3 Reach the bundle 3
4 Reach the bundle 6 Reach the bundle 6 Reach the bundle 4 Reach the bundle 4
5 Reach the bundle 7 Reach the bundle 7 Hold the bundle 1,2,3, and 4 Put the bundle 1,2,3, and 4 to the table
6 Reach the bundle 8 Reach the bundle 8 Hold the bundle 1,2,3, and 4 7 Put the bundle 5,6,7, and 8 to the table Put the bundle 5,6,7, and 8 to the table Idle
8 Idle Put the bundle 1,2,3, and 4 to the table
9 Set bundle into 1 bundle Set bundle into 1 bundle Set 8 bundle into 1 bundle Set 8 bundle into 1 bundle
10 - Take the bundle from table Take the bundle from table
-11 - Put the bundle vertically Put the bundle vertically
-12 Set the bundle vertically (2 x) Set the bundle vertically (2 x) Set the bundle vertically (2 x) Set the bundle vertically (2 x)
13 - Rotate the bundle horizontally Rotate the bundle horizontally
-14 - Put the bundle horizontally Put the bundle horizontally -15 - Set the bundle horizontally (2 x) Set the bundle horizontally (2 x)
-16 Idle Idle Put the bundle to the finish place Put the bundle to the finish place 17 Take the finished bundle Take the finished bundle Take the finished bundle Take the finished bundle
18 Bring the finished bundle to the pallet Bring the finished bundle to the pallet Bring the finished bundle to the pallet Bring the finished bundle to the pallet 19 Put the finished bundle to the pallet Put the finished bundle to the pallet Put the finished bundle to the pallet Put the finished bundle to the pallet
Combine