Gene expression
Multivariate analysis of variance test for gene set analysis
Chen-An Tsai
1,∗and James J. Chen
2,∗1Graduate Institute of Biostatistics and Biostatistics Center, China Medical University, Taichung, Taiwan and
2Division of Personalized Nutrition and Medicine, National Center for Toxicological Research, FDA, Jefferson,
AR 72079, USA
Received on October 7, 2008; revised on February 13, 2009; accepted on February 16, 2009
Advance Access publication March 2, 2009
Associated Editor: John Quackenbush
ABSTRACT
Motivation: Gene class testing (GCT) or gene set analysis (GSA) is a statistical approach to determine whether some functionally predefined sets of genes express differently under different experimental conditions. Shortcomings of the Fisher’s exact test for the overrepresentation analysis are illustrated by an example. Most alternative GSA methods are developed for data collected from two experimental conditions, and most is based on a univariate gene-by-gene test statistic or assume independence among genes in the gene set. A multivariate analysis of variance (MANOVA) approach is proposed for studies with two or more experimental conditions. Results: When the number of genes in the gene set is greater than the number of samples, the sample covariance matrix is singular and ill-condition. The use of standard multivariate methods can result in biases in the analysis. The proposed MANOVA test uses a shrinkage covariance matrix estimator for the sample covariance matrix. The MANOVA test and six other GSA published methods, principal component analysis, SAM-GS, analysis of covariance, Global, GSEA and MaxMean, are evaluated using simulation. The MANOVA test appears to perform the best in terms of control of type I error and power under the models considered in the simulation. Several publicly available microarray datasets under two and three experimental conditions are analyzed for illustrations of GSA. Most methods, except for GSEA and MaxMean, generally are comparable in terms of power of identification of significant gene sets.
Availability: A free R-code to perform MANOVA test is available at http://mail.cmu.edu.tw/∼catsai/research.htm
Contact:jamesj.chen@fda.hhs.gov; catsai@mail.cmu.edu.tw Supplementary information: Supplementary data are available at Bioinformaticsonline.
1 INTRODUCTION
Biological phenomena often occur through the interactions of multiple genes, via signaling pathways, networks or other functional relationships. In microarray data analysis, after selecting the list of significant genes, investigators are often interested in knowing whether some functionally predefined classes of genes are differentially expressed. A gene class refers to a group of genes with related functions or a set of genes grouped together based on biologically relevant information, such as a metabolic pathway, protein complex, or GO (gene ontology) category. A statistical test
∗To whom correspondence should be addressed.
to determine significance of a gene class is referred to as gene class testing (GCT) or gene set analysis (GSA). The common approach to the GSA is first to identify a list of genes that express differently among two groups of samples. The list of differentially expressed genes is then examined with biologically pre-defined gene sets to determine whether any set is overrepresented in the list
compared with the whole list (e.g. Draghici et al., 2003; Khatri
and Draghici, 2005; Rivalset al., 2007). This approach is known as
the over-representation analysis (ORA).
The Fisher’s exact test is typically used to assess the significance
for an overrepresentation (Draghiciet al., 2003). TheP-value for
significance of gene set from the Fisher’s exact test is calculated as
p(x)=
whereMis the total number of genes in the array,Nis the number
of genes in the class,K is the number of genes in the significant
list andxis the number of genes in the list from the class. There
are a number of shortcomings with the ORA approach (e.g. Pavlidis
et al., 2004; Subramanianet al., 2005; Tianet al., 2005). First, the division of genes into differential and non-differential expression groups is arbitrary, and the genes in the non-differential expression
list are discarded, regardless of theirP-values. Second, the Fisher’s
exact test assumes the genes are independent, and it does not take the correlation structure in the gene class into consideration. Third, the approach simply counts the number of genes in the list; the order of genes is not taken into consideration. These shortcomings are highlighted by an analysis of a gene set from the diabetes dataset
presented by Moothaet al. (2003) given below.
The diabetes dataset consists of 149 gene classes from 10 526 genes measured on 17 subjects with normal glucose tolerance and 18 subjects with type 2 diabetes mellitus. Of the 149 gene classes analyzed, the gene class OXPHOS (oxidative phosphorylation) was one of the most significance gene classes identified (e.g. Chenet al.,
2007; Moothaet al., 2003; Tianet al., 2005). Table 1 shows the
P-values from the Fisher’s exact test according to the significant
cutoff probability. It can be seen that theP-value fluctuates as the
cutoff changes.
Recently, Subramanian et al. (2005) and Mootha et al.
(2003) proposed the Gene Set Enrichment Analysis (GSEA) by considering the entire distribution of genes in the class, rather than
by guest on April 12, 2016
http://bioinformatics.oxfordjournals.org/
Table 1. An ORA of the diabetes data from the Fisher’s exact test
OXPHOS (M= 206)
Cutoff K X P-values
0.0025 36 1 0.2951
0.0500 573 11 0.0221↓
The gene OXPHOS with the class size of (M=) 206 is one of the most significance gene classes identified. For a given cutoff,Kis the number of genes in the significant list and
Xis the number of gene in the list from the class. TheP-value fluctuates,↑indicating increasing and↓indicates decreasing, as the cutoff changes.
individual genes. The GSEA approach is able to identify a significant gene set between the diabetic samples and normal muscles for which no single gene was found to be differentially expressed using the
ORA approach. The work of Moothaet al. (2003) has inspired the
development of various GSA methods for alternatives to the ORA
approach. Tianet al. (2005) and Chenet al. (2007) proposed test
statistics based on the two-sample t-statistics. Dinu et al. (2007)
proposed a SAM-GS test based on the SAM statistic (Tusheret al.,
2001) and Adewaleet al. (2008) generalized the SAM-GS statistic
from the framework of regression model. Their tests for a gene set are an aggregate of each individual gene test statistics within the gene set. The SAM-GS test is the only GSA method to address the small variability present in microarray gene expression studies
by incorporating the SAM constant (Tusheret al., 2001) into the
test statistic. The small variability can lead to inflation of thet-test statistic due to very small denominator, and therefore genes whose average expressions corresponding to the two groups are extremely close can be identified as significant. Efron and Tibshirani (2007) proposed a MaxMean statistic for summarizing gene-sets, and a restandardization for more accurate inferences. These approaches utilize an aggregate of individual statistics based on univariate per gene analysis.
Alternatively, Tomfohr et al. (2005) used a t-statistic but after
reducing the dimension of the gene expression data matrix to its first
principal component. Konget al. (2006) proposed using Hotelling’s
T2-statistic with a similar dimensional reduction approach. Goeman
et al. (2004) proposed a global score test by modeling gene expressions as random effects in a logistic regression model.
Mansmann and Meister (2005) and Hummelet al. (2008) proposed
an ANCOVA (analysis of covariance) test, which is similar to the
Goemanet al. (2004) model except that the roles of condition and
gene are exchanged in the regression models. A third approach is a
meta-analysis based the individualP-values from the univariate test
(e.g. Pavlidiset al., 2004). Recently, Goeman and Mansmann (2008)
proposed a focus-level method for GSA analysis of GO terms. It made use of the hierarchical structure of GO graphs. They proposed
using the closed testing procedure (Marcuset al., 1976) to account
for multiple testing in the GSA analysis.
Liu et al. (2007) compared statistical performance of the
global test (Goemanet al., 2004), ANCOVA test (Mansmann and
Meister, 2005) and SAM-GS (Dinuet al., 2007). In the simulation
experiment, they found that the asymptotic distributions of the global and ANCOVA tests can lead to an incorrect type I error (size). A proper standardization across genes is necessary for the global and ANOCOVA tests in order to obtain more accurate inference. After a proper standardization, the two tests with permutation-based inference gave a correct size. SAM-GS showed slightly higher power than the global and ANCOVA tests. In the analysis of three microarray datasets, the three methods showed similar power using permutation inference.
Tian et al. (2005) presented two fundamental hypotheses for GSA. The first hypothesis (Q1) tests the same level of association of a gene set with the given phenotype as the complement of the gene set. The second hypothesis (Q2) tests if there is no gene in the gene set associated with the phenotype. The null distribution of the statistic for Q1 was generated by permuting genes (gene sampling), and the null distribution for Q2 was generated by permuting samples (subject-sampling). Goeman and Bühlmann (2007) provided detailed discussions of the Q1 versus Q2 hypothesis and the generation of their respective null distributions via gene-sampling versus subject gene-sampling. Nam and Kim (2008) provided a list of GSA methods with their hypotheses (either Q1 or Q2 or both) and the sampling methods, and the references.
Almost all GSA methods considered studies only for two experimental conditions, although some approaches can be generalized to more than two conditions. Many microarray experiments involve multiple experimental conditions. The different experimental conditions can be dose levels, time points or treatment
combinations. The Goeman et al. (2004) logistic model for two
conditions recently has been extended to multinomial model for multiple conditions (http://www.bioconductor.org/) in R package. The ANCOVA test (Mansmann and Meister, 2005) can be directly used to analyze data from three or more conditions.
This article proposes a modified multivariate analysis of variance (MANOVA) test for GSA for data collected from studies with two or more experimental conditions. When there are two conditions,
the MANOVA test becomes the Hotelling T2-test. Hotelling’s
T2 has already been applied to identify differentially expressed
genes (Kim et al., 2005; Lu et al., 2005; Szabo et al., 2003).
One commonly known challenge of the use of the MANOVA
or Hotelling’s T2-test for GSA is that it requires the number of
samples to be larger than the number of genes in the gene set in order to avoid singularity in the inversion of the sample covariance matrix. An intuitive approach to account for the singularity is to use the generalized inverse matrix to compute the test statistic. However, this approach does not perform well (data not shown). A less known problem is that the sample covariance matrix is not a good estimate of the true population covariance matrix when the number of genes is more than the number of samples (Schafer and Strimmer, 2005). Simply using the sample covariance matrix can lead to poor performance in the subsequent analysis. This article applies the shrinkage covariance matrix estimator (Schafer and Strimmer, 2005) to compute the MANOVA test statistic. The analysis focuses on the Q2 hypothesis since it is consistent with the conventional approach of identifying differentially expressed
genes. TheP-values are computed by permuting the samples that are
obtained independently by the experimental design. TheP-values
by guest on April 12, 2016
http://bioinformatics.oxfordjournals.org/
are comparable across the gene sets and can be used for gene ranking as well as significance assessment.
2 METHOD
Consider a microarray study ofmgenes withcexperimental conditions (phenotypes) of sample sizesn1,…,nc. Without loss of generality, consider a
gene set consisting ofmgenes. Letyijbe the m-vector of intensities for simple
j(j=1,…,ni) in conditioni(i=1, …,c). The MANOVA model (Johnson
and Wichern, 2000) can be expressed asyij=µi+eij, whereeijis m-vector
of residuals with Var(eij) =andµi is the m-vector of means for thei-th
condition. The null hypothesis of no difference in gene expressions among thecconditions is given as:µ1=µ2… =µc. The alternative is at least one
gene express differently in at least two conditions. There are four MANOVA tests: Wilks’, Pillai’s tract, Hotelling’sT2and Roy’s largest root. The four
tests are equivalent to Hotelling’sT2 when there are only two conditions. The Wilks’is used in this article given as
=
sum of squares matrix (sample covariance matrix) and H is the between sum of squares matrix. The number of eigenvaluesKis equal to the minimum of the number of genes (m) and the number of conditions minus one (c−1). When the number of genes in the gene set is grater than the number of samples, the matrix E is singular and ill-condition. The shrinkage covariance matrix estimator (S∗ij) proposed by Schafer and Strimmer (2005) is used to make the matrix well-condition, and is given as
s∗ij=
wheresii andrij, respectively, denote the empirical sample variance and
sample correlation, and the optimal shrinkage intensityλˆ∗is estimated by
ˆ
The null distribution of ‘standard’ Wilks’(or Hotelling’sT2), based on
the sample covariance matrix, can be approximated by aFdistribution for some special cases (Johnson and Wichern, 2000). For the ‘modified’ Wilk’s
λusing the shrinkage estimator, its distribution does not have a close form. Using a similar approach to the commonly used GSA methods, theP-values of the modified Wilk’sλare computed using the permutation method.
3 SIMULATION STUDY
The proposed MANOVA approach is evaluated and compared with six published GSA methods using the Monte Carlo simulation for two experimental conditions. These six methods are: principal
component analysis (PCA) by Konget al. (2006), SAM-GS by Dinu
et al. (2007), ANCOVA by Mansmann and Meister (2005), Global
by Goemanet al. (2004), GSEA by Subramanianet al. (2005) and
MaxMean by Efron and Tibshirani (2007). A brief description of each method is given in Supplementary Material 1.
The simulation design was similar to that considered by Liuet al.
(2007). It considered 100 genes (m= 100) in a gene set. In the null
model, the 100 genes were simulated from a multivariate normal
(MVN) distribution with a mean vectorµand a diagonal variance–
covariance matrix. The 100 elements ofµwere generated from the
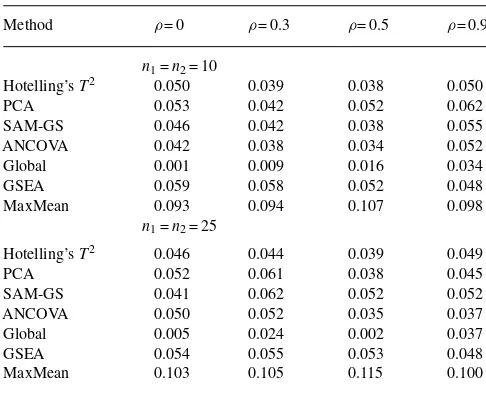
Table 2. Type I error of seven GSA methods: Hotelling’sT2, PCA,
SAM-GS, ANCOVA, Global, GSEA and MaxMean tests
Method ρ= 0 ρ= 0.3 ρ= 0.5 ρ= 0.9
n1=n2= 10
Hotelling’sT2 0.050 0.039 0.038 0.050
PCA 0.053 0.042 0.052 0.062
SAM-GS 0.046 0.042 0.038 0.055
ANCOVA 0.042 0.038 0.034 0.052
Global 0.001 0.009 0.016 0.034
GSEA 0.059 0.058 0.052 0.048
MaxMean 0.093 0.094 0.107 0.098
n1=n2= 25
Hotelling’sT2 0.046 0.044 0.039 0.049
PCA 0.052 0.061 0.038 0.045
SAM-GS 0.041 0.062 0.052 0.052
ANCOVA 0.050 0.052 0.035 0.037
Global 0.005 0.024 0.002 0.037
GSEA 0.054 0.055 0.053 0.048
MaxMean 0.103 0.105 0.115 0.100
uniform random variables U[0, 10], and the 100 diagonal elements
ofwere generated from the uniform random variable U[0.1, 10].
The first 20 genes had a common correlation coefficient of ρ as
were the next 20 genes. That is, had compound symmetry (CS)
structures in the first 20 genes and the next 20 genes. The correlation
ρwas set at 0 (to include the independent model), 0.3, 0.5 and 0.9.
The alternative model had the same variance–covariance structure.
But, the first 20 genes had a mean difference of 2γ and the next
20 genes had the mean difference of−2γ. The mean differenceγ
was set at 0.2, 0.4, 0.6, 0.8, 1.0 and 1.2. The numbers of samples in each condition considered were 10 and 25. The simulation data
were replicated 1000 times in each model. TheP-values were based
on 1000 permutations.
The R-code performing SAM-GS was downloaded from http://
www.ualberta.ca/∼yyasui/homepage.html, as well as R-packages,
GlobalAncova and Globaltest, respectively, to implement ANCOVA and Global tests were available from http://www.bioconductor.org. The R-code for GSEA was downloaded from http://www.broad. mit.edu/gsea, and MaxMean was from the GSA package in R. The MANOVA and PCA were implemented using the R statistical software. It should be noted that GSEA and MaxMean are a one-sided test to identify either up- or down-regulated gene sets; they are considered in the evaluation since these two methods have been used widely.
Table 2 shows the empirical type I errors using the nominal level
of 0.05. The type I errors from Hotelling’sT2and ANCOVA are
reasonably close to or below the nominal level. Both tests show
slight conservatism for ni= 10 and ρ= 0.3. PCA, SAM-GS and
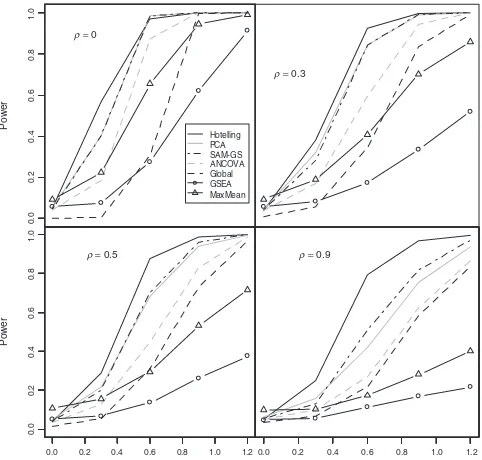
GSEA show anti-conservatism in few cases. Global appears to be very conservative. MaxMean appears to have an overly inflated size. Figure 1 illustrates the empirical powers using the nominal
level of 0.05 forγ= 0.2, 0.4, 0.6, 0.8, 1.0 and 1.2. It can be seen
that Hotelling’sT2performs the best among the seven tests in all
cases. The one-sided GSEA and MaxMean tests have lower powers since the alternative models consist of mixture of up- and down-regulated genes in the gene sets. For the two-sided test, the Global
by guest on April 12, 2016
http://bioinformatics.oxfordjournals.org/
Po
Fig. 1. Power analysis of five GSA methods: Hotelling’sT2, PCA, SAM-GS,
ANCOVA, Global, SEA and MaxMean tests.
test has the lowest power, consistent with the results in Table 2. SAM-GS and PCA appear to be comparable. More discussion on the simulation results, the one-sided versus two-sided tests and Q1 and Q2 hypotheses are given in Section 5.
4 APPLICATIONS
4.1 Two experimental conditions
We applied the proposed MANOVA and the six other GSA methods to three microarray studies: Gender, Leukemia and p53. The three
studies are frequently used for GSA illustrations (e.g. Dinuet al.,
2007; Subramanian et al., 2005). The three studies are publicly
available at the GSEA web site (http://www.broad.mit.edu/gsea), each study consists of two catalogs of gene sets, chromosomes and cytogenetic catalog (C1) and functional catalog (C2). The gender dataset includes 15 056 mRNA expression profiles from 15 male and 17 female samples of lymphoblastoid cell lines. The leukemia dataset is used to study lymphoid leukemia (ALL) and acute myeloid leukemia (AML) by comparing 10 056 expression profiles derived from 24 ALL patients and 24 AML patients. The p53 dataset is a study to identify targets of the transcription factor p53 from 10 100 gene expression profiles in the NCI-60 collection of cancer cell lines. The mutation status of the p53 gene has been reported for 50 of the NCI-60 cell lines with 17 normal and 33 mutation samples. Dinu
et al. (2007) analyzed the three datasets Gender (C1), Leukemia (C1) and p53 (C2) in SAM-GS and GSEA comparisons. The seven GSA methods were applied to the four datasets: Gender (C1), Gender (C2), Leukemia (C1) and p53 (C2). The numbers of gene sets are 212, 308, 182 and 308, respectively.
Table 3 shows the number of gene sets with P-values<0.01
and 0.05 from the seven GSA methods. The P-values were used
instead of the false discovery rate (FDR) because P-values are
more informative for the comparison purpose. For example, for
Table 3. The number of gene sets withP-values < 0.01 and 0.05 from the Hotelling’sT2, PCA, SAM-GS, ANCOVA, Global, GSEA and MaxMean
tests for the four datasets: gender (C1), gender (C2), leukemia (C1) and p53 (C2), the numbers of gene sets are 212, 308, 182 and 308, respectively
Methods P-value Datasets
the Leukemia study the number of gene sets with an FDR≤0.25,
which was been used by Dinuet al. (2007), is 182 in all five
two-sided tests (the number is 3 for GSEA and 0 for MaxMean). For the two-sided methods, there are some discrepancies between the simulation result and the data analysis. It seems that MANOVA, PCA and SAM-GS perform better on the simulation and on the p53 and Leukemia datasets, whereas Global and ANCOVA perform better on the two Gender datasets. For the one-sided methods, MaxMean identify slightly more gene sets than GSEA. However, MaxMean
is shown to have an inflated size in the simulation analysis. TheP
-values andq-values (FDR) of each gene set of the four studies for
the seven GSA methods are provided in Supplementary Material 2.
The two-sided methods, in particularT2, generally identify more
gene sets than the one-sided GSEA test. The biggest discrepancy between the two-sided and one-sided tests is the leukemia data set in which the two-sided methods identify 171 (the least) out of the 182 gene sets whereas the one-sided methods identify 15
(the most). Dinuet al(2007) discussed large discrepancies between
the GSEA and SAM-GS methods in their analysis of the p53 and leukemia datasets. In the p53-comparison analysis, SAM-GS identified more gene sets than GSEA, and many of those additional gene sets identified by SAM-GS were associated with p53 genes or
p53 signaling. In the leukemia dataset, Dinuet al. (2007) pointed
out to a high percentage of individual genes were significant, and commented that a GSA analysis should be consistent with the individual gene analysis. In the present analysis, all methods, except
for GSEA and MaxMean, identified >90% of genes sets and are
consistent with the individual gene analysis.
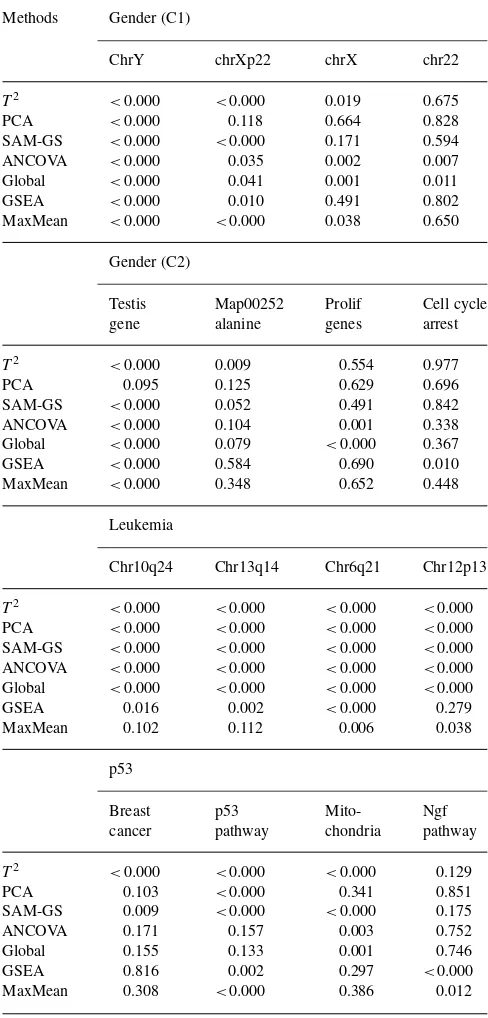
Table 4 illustrates the similarities and discrepancies among the five two-sided and two one-sided methods for some gene sets observed. These are selected from the top 10 ranked gene sets from each of the seven GSA methods. ANCOVA and Global appear to be very similar, as are the two one-side methods. The complete list of the 10 top ranked gene sets is given in Supplementary Material 3.
by guest on April 12, 2016
http://bioinformatics.oxfordjournals.org/
Table 4. A list of gene sets for illustrating the similarities and discrepancies observed in the GSA analysis among Hotelling’s T2, PCA, SAM-GS,
ANCOVA, Global, GSEA and MaxMean tests
Methods Gender (C1)
ChrY chrXp22 chrX chr22
T2 <0.000 <0.000 0.019 0.675
PCA <0.000 0.118 0.664 0.828
SAM-GS <0.000 <0.000 0.171 0.594 ANCOVA <0.000 0.035 0.002 0.007 Global <0.000 0.041 0.001 0.011
GSEA <0.000 0.010 0.491 0.802
MaxMean <0.000 <0.000 0.038 0.650
Gender (C2)
Testis Map00252 Prolif Cell cycle
gene alanine genes arrest
T2 <0.000 0.009 0.554 0.977
PCA 0.095 0.125 0.629 0.696
SAM-GS <0.000 0.052 0.491 0.842 ANCOVA <0.000 0.104 0.001 0.338 Global <0.000 0.079 <0.000 0.367
GSEA <0.000 0.584 0.690 0.010
MaxMean <0.000 0.348 0.652 0.448
Leukemia
MaxMean 0.102 0.112 0.006 0.038
p53
ANCOVA 0.171 0.157 0.003 0.752
Global 0.155 0.133 0.001 0.746
GSEA 0.816 0.002 0.297 <0.000
MaxMean 0.308 <0.000 0.386 0.012
The gene sets are selected from the 10 top-ranked gene sets from each method.
4.2 More than two experimental conditions
The MANOVA approach was also applied to a breast cancer dataset
(van’t Veer et al., 2002) to illustrate a GSA analysis with more
than two experimental conditions. This dataset was a study of gene expression profiling to predict the clinical outcome of breast cancer. A subset of normalized gene expression data consisting of
Table 5. Results of the GSA analysis of breast cancer data for nine pathways using MANOVA and ANCOVA
Gene set Size P-values
Wilks’ ANCOVA
Androgen receptor signaling 72 0.0005 <0.0000
Apoptosis 187 0.0015 0.0005
Cell cycle control 31 <0.0000 <0.0000
Notch delta signaling 34 0.0025 0.0545
p53 signaling 33 <0.0000 0.0370
Ras signaling 266 0.0055 <0.0000
Tgf beta signaling 82 0.0535 0.1165
Tight junction signaling 326 <0.0000 <0.0000
Wnt signaling 176 <0.0000 0.0005
1113 genes from 96 samples without BRCA1 or BRCA2 mutations was mapped to nine cancer related pathways. The experimental conditions analyzed were three ordered levels of tumor grade, 1, 2 and 3, with the sample sizes of 11, 25 and 60, respectively. Table 5
shows theP-values of the nine pathways using the MANOVA and
ANCOVA. MANOVA and ANCOVA appear to be comparable for
gene sets with very smallP-values. The MANOVA and ANCOVA,
respectively, have theP-values of 0.0025 and 0.0545 for the Notch
delta signaling pathway, andP-values of 0.0535 and 0.1165 for Tgf
beta signaling pathway.
5 DISCUSSION
Genes in a gene set are functionally related and are not independent; the complex structure of gene interactions within a gene set are not fully captured using univariate approaches. The methods such as the Fisher’s exact test or the ANCOVA asymptotically
parametric test which calculated theP-values under the assumption
of independence between genes will have incorrect type I error if genes are in fact correlated (Goeman and Buhlmann, 2007; Liu
et al., 2007). Most GSA test methods, such as SAM-GS, Global, ANCOVA and GSEA, do not involve an estimate of the covariance matrix among genes in the test statistics. These methods use the permutation method to generate the null distribution and calculate
theP-values. Permutation approach involves an implicit estimate of
the covariance matrix between the genes. A permutation test does not require any assumption on the underlying distribution of the intensity data; with the use of an appropriate test statistic a permutation test provides a valid statistical inference in terms of the type I error.
Multivariate methods, such as Tomfohr et al. (2005) and
Kong et al. (2006), take the variance or correlation matrix into consideration in the analysis. The covariance matrix should be positive definite. But when the number of genes is greater than the number of samples, the sample covariance matrix is singular (non-positive definite). Furthermore, Schafer and Strimmer (2005) showed that the sample covariance matrix is ill-conditioned and its eigenvalues can be very different from the true eigenvalues. The use of the sample covariance matrix in a multivariate method for the analysis of data with high dimensional variables and low dimensional sample sizes is inefficient and can result in biases
in the analysis (Table 2). Both Tomfohret al. (2005) and Kong
et al. (2006) applied dimensional reduction techniques to find the
by guest on April 12, 2016
http://bioinformatics.oxfordjournals.org/
orthogonal linear combinations of variables that showed the greatest variability of the data. The dimensional reduction techniques define a smaller number of hybrid components that are a composite of the original variables. Since the underlying dimensionality is not known, these techniques must search for the number of components that can account for much of data variation based on some ‘subjective
cutoff criterions’. The Tomfohret al. (2005) approach simply used
the largest principal component, based on the gene expression data matrix instead of the sample covariance matrix. This approach can be effective if there is a single dimensional space that can explain much of data variation sufficiently. The analysis of searching for the component that optimizes differences between conditions is
considered to be apost hocanalysis in the sense that it is performed
after a significance difference in the whole gene set is observed.
The MANOVA (Hotelling’sT2) is a multivariate generalization
of the univariate analysis of variance (or t-test). The ANOVA
and t-test are used to identify differentially expressed genes,
while the MANOVA and Hotelling’s T2 are used to identify
differentially expressed gene sets. The univariate ANOVA or t
-test compares the mean differences in expression among the
phenotypes for an individual gene; MANOVA or T2 compares
the mean differences for a set of genes simultaneously. The null hypothesis is rejected if one or more of the mean differences or some combination of mean differences among the genes in the gene set differs from zero. The parametric MANOVA (and
T2) test has been used for analyzing multivariate data in many
applications. The test statistics were well studied and robust to the skew distribution. The proposed modified MANOVA test uses a shrinkage covariance matrix estimator (Schafer and Strimmer, 2005) to incorporate the correlations structure among the genes in the test statistic and to account for the singularity and ill-condition of the sample covariance matrix. The modified MANOVA
test uses the permutation method to compute the P-values. The
proposed MANOVA (orT2) test to identify significant gene sets
is a generalization of the univariate test such as SAM, which uses an alternative variance estimate to identify significant genes with the permutation method. Furthermore, after appropriate filtering and normalization, gene-expression data appear rather symmetrical (e.g.
Irrizarryet al., 2003; Mansmann and Meister, 2005), gene expression
data appear rather symmetrical. The proposed T2test appears to
perform well in terms of controlling the type I error and power as compared with the six other existing methods in simulation and data analysis. Since the comparison between two conditions is the simplest study, similar results could be expected for cases involving multiple conditions.
The proposed MANOVA test is designed to identify genes sets consisting of differentially expressed genes for two or more experimental conditions. When there are more than two conditions, the changes of gene expressions between any two conditions can be up, down or both. In the context of two experimental conditions,
the original GSEA statistic (Moothaet al., 2003) was a one-sided
test to identify gene sets containing down-regulated genes in type 2 diabetes mellitus subjects. The basic idea in this analysis is that the gene sets are closely related and, hence, will have similar expression patterns, either up or down. In GCT, the one-sided test means that the changes of gene expressions in the gene set are in one direction:
either up- or down-regulation. Chen et al. (2007) recommend
the ordinary least squares (OLS) statistic (O’Brien, 1984) or the standardized weighted sum statistic (LWS) (Laüter, 1996) for a
one-sided test. These two global statistics used the similar concept of restandardization of MaxMean (Efron and Tibshirani, 2007) to account for random selection of genes. These three tests can identify either up- or down-regulated gene sets, while the GSEA test performs up- and down-regulation separately. If the goal is to detect coordinated changes in one direction, then the one-sided hypothesis is appropriate. The one-sided tests can be very powerful when the changes are in the same direction, such as the pathway cell cycle arrest in the Gender C2 data and Ngf-pathway in the p53 dataset.
This article mainly considers the two-sided GSA tests,T2, PCA,
SAM-GS, ANCOVA and Global. The two-sided test means that changes of gene expressions in the gene set can be both up- and
down-regulation (Chenet al, 2007). In the exploratory context, it
may not be possible to pre-specify how individual genes in a gene set will respond between two conditions. Nevertheless, whether to use a one-sided or two-sided test should be guided by biology.
The simulation models were based on the block CS correlation with heterogeneous variance structure. The block CS is the simplest correlation structure to model gene expression data. It provides a basic assessment of the behaviors and performances of GSA methods. Table 2 suggests that MaxMean does not seem to have correct size using the codes downloaded from the GSA package in R. The GSEA and MaxMean methods compare the given gene-set score not only to scores from permutations of the samples (Q2), but also take into account scores from sets formed by random selections of genes (Q1) (Efron and Tibshirani, 2007). Figure 1 shows that the power decreases as the correlation increases in all GSA methods. As described, the simulation models was generated containing both up- and down-regulated genes, therefore, two-sided tests are more powerful than the one-two-sided tests. Among the two-sided tests, the ANCOVA and Global have the lower
power than T2, PCA and SAM-GS. Since ANCOVA is based
on the model of an equal variance across all genes, additional
simulations with an equal variance model of σ= 5 for all genes
were also evaluated. Under the equal variance model, SAM-GS
and ANCOVA perform the best; it follows by PCA. T2 and
Global have the lowest power. These results are provided in Supplementary Material 4.
In summary, the proposed modified MANOVA (andT2) statistic
takes into account some aspects of the complex multivariate correlations of genes by incorporating a shrinkage sample covariance matrix in the test statistics. The proposed MANOVA or
T2test is useful for identifying differentially expressed gene sets that contain both up- and down-regulated genes under the Q2 hypothesis.
ACKNOWLEDGEMENTS
The views presented in this article are those of the authors and do not necessarily represent those of the US Food and Drug Administration. The authors would like to thank a reviewer raising the issues of independence among genes in the GSA test statistics and three other reviewers provide valuable comments and suggestions that improved this article considerably.
Funding: National Science Council of Taiwan, R. O. C. (NSC 97-2118-M-039-003 and NSC 97-3112-B-001-020) in the National Research Program for Genomic Medicine (in part).
Conflict of Interest: none declared.
by guest on April 12, 2016
http://bioinformatics.oxfordjournals.org/
REFERENCES
Adewale,A.J. et al. (2008) Pathway analysis of microarray data via regression.
J. Comput. Biol.,15, 269–277.
Chen,J.J.et al. (2007) Significance analysis of groups of genes in expression profiling studies.Bioinformatics,23, 2104–2112.
Draghici.S.et al. (2003) Global functional profiling of gene expression.Genomics,81, 98–104.
Dinu,I.et al. (2007) Improving gene set analysis of microarray data by SAM-GS.BMC Bioinformatics,8, 242.
Efron,B. and Tibshirani,R. (2007) On testing the significance of set s of genes.Ann. Appl. Stat.,1,107–129.
Goeman,J.J. and Bühlmann,P. (2007) Analyzing gene expression data in terms of gene sets: methodological issues.Bioinformatics,23, 980–987.
Goeman1,J.J. and Mansmann,U. (2008) Multiple testing on the directed acyclic graph of gene ontology.Bioinformatics,24, 537–544.
Goeman,J.J.et al. (2004) A global test for groups of genes: testing association with a clinical outcome.Bioinformatics,20, 93–99.
Hummel,M.et al. (2008) GlobalANCOVA: exploration and assessment of gene group effects.Bioinformatics,24, 78–85.
Irrizarry,R.A.et al. (2003) Exploration, normalization, and summaries of high density oligonucleotide array probe level data.Biostatistics,4, 239–264.
Johnson,R.A. and Wichern,D.W. (2000)Applied Multivariate Statistical Analysis.5th edn. Prentice Hall, NY.
Khatri,P. and Draghici,S. (2005) Ontological analysis of gene expression data: current tools, limitations, and open problems.Bioinformatics,21, 3587–3595.
Kim,B.S.et al. (2005) Statistical methods of translating microarray data into clinically relevant diagnostic information in colorectal cancer.Bioinformatics,21, 517–528. Kong,S.W.et al. (2006) A multivariate approach for integrating genome wide expression
data and biological knowledge.Bioinformatics,22, 2373–2380.
Läuter,J. (1996) Exact t andFtests for analyzing studies with multiple endpoints.
Biometrics,52, 964–970.
Liu,Q.et al. (2007) Comparative evaluation of gene-set analysis methods.BMC Bioinformatics,8, 431.
Lu,Y.et al. (2005) Hotelling’s T2 multivariate profiling for detecting differential expression in microarrays.Bioinformatics,21, 3105–3113.
Mansmann,U. and Meister,R. (2005) Testing differential gene expression in functional groups: Goeman’s global test versus an ANCOVA approach.Method. Inform. in Med.,44, 449–453.
Marcus,R.et al. (1976) On closed testing procedures with special reference to ordered analysis of variance.Biometrika,63, 655–660.
Mootha,V.K. et al. (2003) PGC-1 alpha-responsive genes involved in oxidative phosphorylation are coordinately downregulated in human diabetes.Nat. Genet.,
34, 267–273.
Nam,D. and Kim,S.Y. (2008) Gene-set approach for expression pattern analysis.Brief. Bioinformatics,9, 189–197.
O’Brien,P.C. (1984) Procedure for comparing samples with multiple endpoints.
Biometrics,40, 1079–1087.
Pavlidis,P.et al. (2004) Using the gene ontology for microarray data mining: a comparison of methods and application to age effects in human prefrontal cortex.
Neurochem. Res.,29, 1213–1222.
Rivals,I.et al. (2007) Enrichment or depletion of a GO category within a class of genes: which test?Bioinformatics,23, 401–407.
Schäfer,J. and Strimmer,K. (2005) A shrinkage approach to large-scale covariance matrix estimation and implications for functional genomics.Statist. Appl. Genet. Mol. Biol.,4, 32.
Subramanian,A. et al. (2005) Gene set enrichment analysis: a knowledge-based approach for interpreting genome-wide expression profiles.Proc. Natl Acad. Sci. USA,102, 15545–15550.
Szabo,A.et al. (2003) Multivariate exploratory tools for microarray data analysis.
Biostatistics,4, 555–567.
Tian,L. et al. (2005) Discovering statistically significant pathways in expression profiling studies.Proc. Natl Acad. of Sci. USA,102, 13544–13549.
Tomfohr,J.et al. (2005) Pathway level analysis of gene expression using singular value decomposition.BMC Bioinformatics,6, 225.
Tusher,V.G.et al. (2001) Significance analysis of microarrays applied to the ionizing radiation response.Proc. Natl Acad. Sci. USA,98, 5116–5121.
Van’t Veer,H. (2002) Gene expression profiling predicts clinical outcome of breast cancer.Nature,415, 530–536.
by guest on April 12, 2016
http://bioinformatics.oxfordjournals.org/