A SENTIMENT KNOWLEDGE DISCOVERY MODEL IN
TWITTER’S TV CONTENT USING STOCHASTIC
GRADIENT DESCENT ALGORITHM
LIRA RUHWINANINGSIH
GRADUATE SCHOOL
BOGOR AGRICULTURAL UNIVERSITY BOGOR
STATEMENT OF THESIS AND SOURCES OF
INFORMATION AND DEVOLUTION COPYRIGHT
Hereby, I genuinely stated that the thesis entitled “A Sentiment Knowledge Discovery Model in Twitter’s TV Content using Stochastic Gradient Descent Algorithm” is my own work and to the best of my knowledge, under supervision by Dr. Eng. Taufik Djatna, STP, M.Si and Dr. Ir. Agus Buono, M.Si, M.Kom. It has never previously been published in any university. All of incorporated originated from other published as well as unpublished papers are stated clearly in the texts as well as in the references.
Hereby, I devolve the copyright of my thesis to Bogor Agricultural University.
Bogor, October 2015
Lira Ruhwinaningsih
SUMMARY
LIRA RUHWINANINGSIH. A Sentiment Knowledge Discovery Model in Twitter’s TV Content using Stochastic Gradient Descent Algorithm. Supervised by TAUFIK DJATNA and AGUS BUONO.
Explosive usage of social media can be a rich source for data mining. Meanwhile, increasing and variation of TV shows or TV programs motivate people to write comments via social media. Social network contains abundant information which is unstructured, heterogeneous, high dimensional and a lot of noise. Abundant data can be a rich source of information but it is difficult to be manually identified.
This research proposed an approach to perform preprocessing of unstructured, noisy and very diversed data; to find patterns of the information and knowledge of user activities on social media in form of positive and negative sentiment on Twitter TV content.
Some methodologies and techniques were used to perform preprocessing. There were removing punctuation and symbols, removing number, replacing numbers into letters, translation of Alay words, remove stop word, and Stemming using Porter Algorithm. The methodology to used find patterns of information and knowledge of social media in this study is Stochastic Gradient Descent (SGD).
The text preprocessing produced a more structured text, reduced noise and reduced the diversity of text. Thus, preprocessing affected to the accuracy and processing time. The experiment results showed that the use of SGD for discovery of the positive and negative sentiment tent to be faster for large and stream data. The Percentage of maximum accuracy to find sentiment patterns is 88%.
Keywords: Stochastic Gradient Descent, opinion mining, sentiment analysis,
RINGKASAN
LIRA RUHWINANINGSIH. A Sentiment Knowledge Discovery Model in Twitter’s TV Content using Stochastic Gradient Descent Algorithm. Di bawah bimbingan TAUFIK DJATNA and AGUS BUONO.
Penggunaan media sosial yang eksplosif dapat menjadi sumber yang kaya untuk data mining. Sementara itu, perkembangan program televisi semakin meningkat dan beragam sehingga memotivasi orang untuk memberi komentar melalui akun media sosial. Data sosial media memilki informasi yang melimpah tetapi tidak terstruktur, heterogen, berdimensi tinggi dan banyak noise. Data yang melimpah dapat menjadi sumber yang kaya informasi tetapi sulit diidentifikasi secara manual.
Kontribusi dari penelitian ini adalah untuk melakukan praproses dalam mengatasi data yang tidak terstrukur, banyak noise dan sangat beragam; menemukan pola informasi dan pengetahuan kegiatan pengguna sosial media dalam bentuk sentimen positif dan negatif pada Twitter TV konten.
Beberapa metodologi dan teknik digunakan untuk melakukan praproses. Metodologi tersebut adalah menghilangkan tanda baca dan simbol, menghilangkan nomor, mengganti nomor ke huruf, menterjemahankan kata-kata Alay, menghilangkan stop word, dan Algoritma Stemming Porter. Metodologi untuk menemukan pola sentimen dalam penelitian ini menggunaka Stochastic Gradient Descent (SGD).
Teks yang telah melalui preprocessing menghasilkan teks lebih terstruktur, mengurangi noise dan mengurangi keragaman teks. Jadi, praproses berdampak pada akurasi klasifikasi dan waktu proses. Hasil percobaan menunjukkan bahwa penggunaan SGD dalam penemuan sentimen positif dan negatif cenderung lebih cepat untuk data yang besar atau stream data. Persentasi maksimum akurasi untuk menemukan pola sentimen sebesar 88%.
Kata kunci: Stochastic Gradient Descent, opinion mining, sentimen analisis,
© Copyright of This Thesis Belongs to Bogor Agricultural
University (IPB), 2015
All Rights Reserved
Prohibited citing in part or whole of this paper without include or citing sources. The quotation is only for educational purposes, research, scientific writing, report writing, criticism, or review of a problem; and citations are not detrimental to the interests of IPB.
Thesis
as partial fulfillment of the requirements for the degree of Master of Computer
in
the Department of Computer Science
A SENTIMENT KNOWLEDGE DISCOVERY MODEL IN
TWITTER’S TV CONTENT USING STOCHASTIC
GRADIENT DESCENT ALGORITHM
GRADUATE SCHOOL
BOGOR AGRICULTURAL UNIVERSITY BOGOR
2015
PREFACE
I would like to thank Allah subhanahu wa ta’ala for all his gifts so that this research is successfully completed. The theme chosen in the research is visual usability conducted since July 2013, with the title of Sentiment Knowledge Discovery in Twitter’s TV Content Using Stochastic Gradient Descent.
I would like to express my sincere gratitude to Dr. Eng. Taufik Djatna, STP, M.Si as Chair of Advisory Committee for his support and encouragement during my study in Bogor Agricultural University. I am very grateful to Dr.Ir. Agus Buono, M.Si, M.Kom. as Member of Advisory Committee for his advice and supervision during the thesis work. I am very grateful to Dr. Imas Sukaesih Sitanggang S.Si, M.Kom who give a lot of advice for this research.
I would like to say many thanks to my beloved family Fery Dergantoro (husband), Euis Winarti (mother), I. Ruhayat (father) Lisda Ruhwinawati (sister), Linda Ruhwina Fauziah (sister), Asriwati (mother in law) for their true and endless love, for never failing patience and encouragement.
I would like to thank all lectures and staff of Computer Science Department, all of colleagues, especially my classmate of Computer Science Department namely Probo Kusumo, Zaenal Abidin, Wahyu, Novan, Agung, Ayu and Sriyono. Least but not last, I would like to thank to Rinto, Loren, Setiaji, Haryadi, Latief and all my team (Tyo, Meli, Ika, Garbel, Reza, Danu, Ika) as my office colleagues for understanding and support.
Hopefully this research useful.
Bogor, September 2015
TABLE OF CONTENT
TABLE OF CONTENT vi
TABLE OF FIGURE vi
1 INTRODUCTION 1
Background 1
Problem Statement 2
Objectives 2
Benefits 3
Scope 3
2 LITERATURE REVIEW 4
Social Media 4
Data Mining 4
Content Analysis 6
TV Content 6
Preprocessing 6
Stochastic Gradient Descent (SGD) 8
3 METHODOLOGY 9
Preprocessing 12
Classification Model using SGD 19
Model Evaluation 29
4 RESULT AND DISCUSSION 29
Evaluation Model using Split Test 31
Evaluation Model Using Cross validation 35
5 CONCLUSION 36
LIST OF TABELS
1 List of converting the numbers into letters 15
2 Testing with learning rate 0.01 and epoch 100 32
3 Correctly Classified Instances and Total Time Execution using Cross
Validation 35
TABLE OF FIGURE
1 Scope of research 3
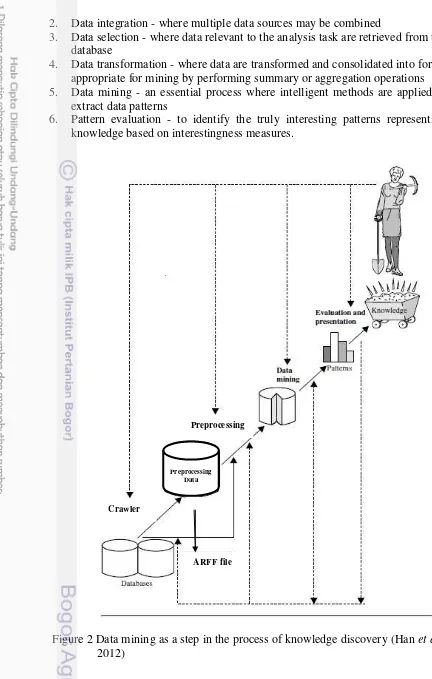
2 Data mining as a step in the process of knowledge discovery 5
3 General Flow 10
4 Data Flow Diagram level 0 11
5 Data Flow Diagram level 1 11
6 Data Flow Diagram level 2 12
7 Preprocessing stages 12
8 Eliminate all punctuation and symbols algorithm 13 9 Algorithm of eliminate numbers in front of words 14
10 Relace number with letter 15
11 Algorithm for eliminate repeated letters 16
12 Algorithm for translate “Alay” words into normal words 17
13 Algorithm for eliminate stop words 18
14 Stemmig Algorithm 19
15 Flow classification model 20
16 Stage to create a classifier and training data 21 17 Training flow referenced from Weka libraries 22 18 Flow upate classifier part 1 referenced from Weka libraries 22 19 Flow update classifier part 2 referenced from Weka libraries 23 20 Flow tokenizer referenced from Weka libraries 24 21 Flow “dotprod” referenced from Weka libraries 27 22 Testing flow and prdicted value referenced from Weka libraries 28 23 Estimating Accuracy with holdout method (Han et al. 2012) 29 24 Chart execution time on preprocessing variations 31
25 Correctly classified instances chart 32
26 Total time execution Chart 33
27 Chart of ratio on changing learning rate 33
28 Chart of learning rate changes on execution time 34 29 Chart of epoch changes to correctly classified instances 34 30 Chart correctly classified instances using Cross Validation 35
1
INTRODUCTION
Background
The variety of TV Program was presented to the audiences can be good quality content, touching, making people annoyed, monotonous and so forth. People may comment on the Twitter TV content. Twitter TV content is twitter account that used by TV program providers as a media to comment on their TV shows, example: @Kikandyshow, @matanajwa and other.These comments can be useful information for TV content provider or become a rich source of information for data mining. Billions of information can be taken from social media web pages. Text comments are good indicators of user satisfaction. Sentiment analysis algorithms offer an analysis of the users’ preferences in which the comments may not be associated with an explicit rating. Thus, this analysis will also have an impact on the popularity of a given media show (Peleja et al. 2013). Automatic TV content analysis is very important for the efficient indexing and retrieval of the vast amount of TV content available not only for end users so that they can easily access content of interest, but also for content producers and broadcasters in order to identify copyright violations and to filter or characterize undesirable content (Kompatsiaris
et al. 2012). The informations were captured from social media produce gold useful information for the organization. Mining thousands of viewing choices and millions of patterns, advertisers and TV networks identify household characteristics, tastes, and desires to create and deliver custom targeted advertising (Spangler et al. 2003). TV content that taking a lot of audience needs continuous improvement to avoid monotony and lose audiences. TV content providers need to do improvement in every episode so that the content useful, qualified and give a positive value to the society. There is a number of quality attributes from the TV viewer view point there are: relevance, coverage, diversity, understandability, novelty, and serendipity (Bambini et al. 2012).
Social media data were very diversed, a lot of noise and unstructured so it is need some preprocessing stage for further data processing. Vast, noise, distributed and unstructured are characteristics of social media data (Gundecha and Liu 2012). Preprocessing can improve the accuracy and efficiency of mining algorithms involving distance measurements (Han et al. 2012). The next process is to find patterns and gold information from social media data that has been done preprocessing. Social media data is a stream data that requires methodologies and algorithms can operate with a limited resource both in terms of time or memory hardware. Moreover, it can handle data that changes over time (Bifet and Frank 2010).
2
Preprocessing was made for Indonesia language and modules of preprocessing algorithm created by the author except stemming algorathm which adopted the Porter algorithm for Indonesa language. Classification algorithm was used to find patterns and information in this study is Stochastic Gradient Descent (SGD). SGD suitable for large and stream data (Bifet and Frank 2010). Stochastic Gradient Descent is versatile techniques that have proven invaluable as a learning algorithms for large datasets (Bottou 2013). From the research that has been done, SGD model give effect to a short processing time to process a lot of data or data streams.
Research about knowledge discovery on Twitter streaming data had been done by Bifet and Frank (2010). Tweet data was taken using Twitter Streaming API. Several approaches that had been done for classification of data, was such as Multinomial Naive Bayes, Stochastic Gradient Descent, and Hoeffding Tree. Then the evaluation of the changes in time and accuracy of its data stream in that research was using Kappa statistic. The experimental results showed that the method Hoeffding Tree poorly suited for data stream, both in terms of accuracy, kappa, and processing time. Naïve Bayes have the better performance than Hoeffding Tree. Based on some tests that have been carried out, SGD models recommended for the data stream with the determination of the appropriate learning rate. The data that used was not using real data, but it was using data of research from Edinburgh Corpora and website reference twittersentiment.appspot.com, so it was not known behavior of each method for real data (Bifet and Frank 2010). Further studies of them are to expand research using the geographic scope, the number of followers or friends, and also use the real data. Previous research on the positive and negative sentiment has been done by Putranti and Winarko (2014), namely twitter sentiment analysis for Indonesian language with the Maximum Entropy and Support Vector Machine. Classification implementation 86,81 % accuration at examination of 7 validation cross fold for the type of kernel of Sigmoid.
Problem Statement
Here are the problems to be challenges in the research:
1. Social media data contains abundant information which is unstructured, heterogeneous, high dimensional and a lot of noise.
2. Abundant data can be a rich source of information but it is difficult to identify manually. How to find patterns of information and knowledge of social media user activities in the form of positive and negative sentiment on twitter TV content.
Objectives
3 Benefits
The benefits of this research are :
1. Preprocessing provides convenience in the process of finding a pattern of positive and negative sentiment.
2. This research as a basis for further research to build a system recommendation and improvement scenarios for providers TV content and audience.
Scope
The data source used in this study was data twitter TV content for @kickandyshow with Indonesian language text. Here is the overview scope of research ilustrated on Figure 1. Data taken for this study were 760 tweets from @kickandyshow account. The period of data collection from the date of May 14, 2015 until May 17, 2015. After the selection and pre-processing, the data ready to be processed to the next step as much as 751 tweets.
Scope
4
Base on Figure 1, a crawler is a program that visits Web sites and reads their pages and other information in order to create entries for a search engine index. Social media used in this research is Twitter. Twitter provides Application Programming Interface (API) that developers can be used to access the data. Twitter Streaming API allows users to access subsets of public status descriptions in almost real time, including replies and mentions created by public accounts. The result data of crawler is inserted into the database. In the part of the target class, the task labels the data twit manually whether positive or negative sentiment. Positive sentiment rated 1 and the negative sentiment rated 0. This task is for the learning process in the classification. Before the preprocessing phase, the data were taken from database. The next step is to perform preprocessing. The steps of preprocessing consists of remove punctuation a symbol, symbol number at the beginning word, replace number with letter, remove repeat letter, translate "alay" word, remove stop word, and stemming. The next step is to find patterns of information and knowledge of social media user activities in the form of positive and negative sentiment on twitter TV content use Stochastic SGD for succeeding. This algorithm generates data mining modeling to predict the pattern of positive and negative sentiment. The modeling that has been formed evaluated by measuring accuracy and processing time.
2
LITERATURE REVIEW
Social Media
Social media is defined as a group of Internet-based applications that build on the ideological and technological foundations of Web 2.0 and that allow the creation and exchanges of user-generated content (Kaplan and Henlein 2010).
The following are characteristics of social data media (Gundecha and Liu 2012):
1. Vast - contents generated by the user are very large number
2. Noisy - social media data can often be very noisy. Removing the noise from the data is essential before performing effective mining.
3. Distributed - Social media data are distributed because there is no central authority that maintains data from all social media sites.
4. Unstructured - social media sites serve different purposes and meet different needs of users.
5. Dynamic - Social media sites are dynamic and continuously evolving. For example, Facebook recently brought about many concepts including a user's timeline, the creation of in-groups for a user, and numerous user privacy policy changes.
Data Mining
5 2. Data integration - where multiple data sources may be combined
3. Data selection - where data relevant to the analysis task are retrieved from the database
4. Data transformation - where data are transformed and consolidated into forms appropriate for mining by performing summary or aggregation operations 5. Data mining - an essential process where intelligent methods are applied to
extract data patterns
6. Pattern evaluation - to identify the truly interesting patterns representing knowledge based on interestingness measures.
Figure 2 Data mining as a step in the process of knowledge discovery (Han et al. 2012)
Preprocessing
Crawler
Preprocessing Data
6
7. Knowledge presentation - where visualization and knowledge representation techniques are used to present mined knowledge to users.
Content Analysis
Content analysis is used to study a broad range of ‘texts’ from transcripts of interviews and discussions in clinical and social research to the narrative and form of films, TV programs and the editorial and advertising content of newspapers and magazines (Macnamara 2005). Berelson (1952) suggested five main purposes of content analysis as follows:
1. To describe substance characteristics of message content; 2. To describe form characteristics of message content; 3. To make inferences to producers of content;
4. To make inferences to audiences of content; 5. To predict the effects of content on audiences.
TV Content
There are three important variables that affect the methodologies employed in the image analysis part namely, the content properties, the quality of the data, and the given computational and memory (Ekin 2012). Social media are definitely one of the easiest ways of linking TV and web. It is a place for audiences to influence and to create content for the actual TV broadcasts. Since it is free, it is also a very cost-effective place for advertisements. It can be argued that the potential of the non-chargeable ways of linkage between TV and web rely heavily on the features and possibilities of social media. To make convergence of TV and web contents entirely successful in both countries, the following are necessary (Bachmayer and Tuomi 2012):
1. Connect TV sets to the web by default.
2. Connect TV content to web content by defining hook points on both parts. 3. Provide adequate interfaces and input devices.
4. Provide automatism - analyzing TV content, analyzing web activity, updating information, connecting to TV content.
5. Provide nonlinear television content to invite the viewer to web activity. The content structure describes the geometric design or the media narrative space of a story. A narrative is defined as a series of events that are linked in various ways, including by cause and effect, time, and place. Something that happens in the first event causes an action in the second event, and so on (Samsel and Wimberley 1998). Smart TV is expected to combine TV and Internet, and provide more applications, contents, and multimedia, as well as evolve into a device that serves as a digital hub for households in the future. Smart TV seems to be changing current TV watching patterns, and bringing about the promotion of active and intelligent broadcasting and communication convergence services (Kim 2011).
Preprocessing
There are some major steps Involved in data preprocessing, namely, data
7
Data Cleaning
Data cleansing is the process of detecting and correcting or removing corrupt or inaccurate records from a record set, table, or database. Data cleansing routines work for "clean" data to fill in missing values, smoothing noisy data, identify or remove outliers, and resolve inconsistencies. The missing values can be addressed with a few steps (Han et al. 2012), namely:
1. Ignore the tuple
2. Fill in the missing value manually
3. Use a global constant to fill in the missing value 4. Use a measure of central tendency for the attribute
5. Use the attribute mean or median for all samples belonging to the same class as the given tuple
6. Use the most probable value to fill in the missing value
Noise is a random error or variance in a measured variable. The Following are data smoothing techniques (Han et al. 2012):
1. Binning - Binning methods smooth a sorted data value by consulting its “neighborhood,” that is, the values around it.
2. Smoothing by bin medians - each bin value is replaced by the bin median 3. Regression - a technique that conforms data values to a function
4. Outlier analysis - values that fall outside of the set of clusters may be considered outliers.
Data Integration
Data integration is the combination of technical and business processes used to combine data from disparate sources into meaningful and valuable information. Data Integration can help reduce and avoid redundancies and inconsistencies in the resulting data set. This can help improve the accuracy and speed of the subsequent data mining process.
Data Reduction
Data reduction techniques can be applied to obtain a reduced representation of the data set that is much smaller in volume, yet closely maintains the integrity of the original data. That is, mining on the reduced data set should be more efficient yet produce the same (or almost the same) analytical results. Data reduction strategies include dimensionality reduction, numerosity reduction, and data compression (Han et al. 2012).
Data Transformation
A data transformation converts a set of data values from the data format of a source data system into the data format of a destination data system. Data transformation assist mining process becomes more efficient and patterns found easier to understand.
8
redundant, and the data that tend to misunderstanding of the target class that makes immediate effect for application (Djatna and Morimoto 2008). Feature selection could reveal hidden important pairwise attributes that abandoned by conventional algorithms as their nonlinear correlation properties. These unique results support for both categorical and continuous problems (Djatna and Morimoto 2008).
Stochastic Gradient Descent (SGD)
SGD is the methodology used to find patterns of information in the form of positive and negative sentiment on twitter TV content on this research. Stochastic Gradient Descent (SGD) is an algorithm that is used for large-scale learning problems. SGD has an excellent performance in solving large-scale problems. Let us first consider a simple supervised learning setup. Each example z is a pair (x,y) composed of an arbitrary input x and a scalar output y. We consider a loss function
ℓ(̂,y) that measures the cost of predicting ̂ when the actual answer is y, and we choose a family F of functions fw(x) parametrized by a weight vector w. We seek the function f
ϵ
F that minimizes the loss Q(z,w) = ℓ(fw(x),y) averaged on the examples. Although we would like to average over the unknown distribution dP (z) that embodies the Laws of Nature, we must often settle for computing the average on a sample … (Bottou 2013)= ∫ ℓ , = ∑�= ℓ � , � (1)
The empirical risk En(f) measures the training set performance. The expected risk E(f) measures the generalization performance, that is, the expected performance on future examples. The stochastic gradient descent (SGD) algorithm is a drastic simplification. Instead of computing the gradient of En(fw) exactly, each iteration estimates this gradient on the basis of a single randomly picked example
zt (Bottou 2013):
+ = − � � , (2)
The stochastic process {wt; t =1, . . .} depends on the examples randomly picked at each iteration. SGD efficient in performing classification even if it is based on non-differentiable loss function (F(θ)) (Bottou 2013).
� = �|| || + ∑[ − + ] (3) Where w is the weight vector of twit data, b is the bias , � is a regulation parameter, and the class label y assumed {+1, -1}. Explicit specification of learning rate is an important thing that relates to the time change in the data stream.
9 process the data stream. The formulation of update classifier in SGD is (Fnew) (Bifet
and Frank 2008) :
� = ∑�= [∑�= . − �.� + � . | + |] (4)
Where :
n = number of data tweet rows i = sum of iteration
w = weight
� = Learning Rate
= Lambda
y = Status of sentiment (yes or no) = accumulation of weight (per word) b = bias.
3
METHODOLOGY
The case study in this research was to determine the positive or negative sentiment based on tweet of TV content. The tweet data taken using Twitter Streaming API. Then it is taken continuously and stored in a table in real time. In the database, the tweets that have been collected at the table, processed (parsed), and its result distributed to several tables in preparation for the next process. Software and tools used in this study were:
1. PHP to build crawler
2. MySQL to store the result of crawler
3. Visual Studio 2012 for preprocessing development 4. Sql Server to store preprocessing data
5. Java to implement SGD with Weka library 6. NetBeans for Java development tool
7. Weka for visualizing the pattern of sentiment
8. Excel for visualizing the accuracy and processing time.
This application usage environment for the next researchers that will explore the sentiment analysis on the data stream with the case of TV content. The achievement of long term is expected to create a system that could provide an assessment and recommendation for the TV audience and scenarios improvement for the TV content provider.
10
Here are some modules were made in this study:
1. The crawler module used an existing application from 140Dev (http://140dev.com/). This module was made using PHP script
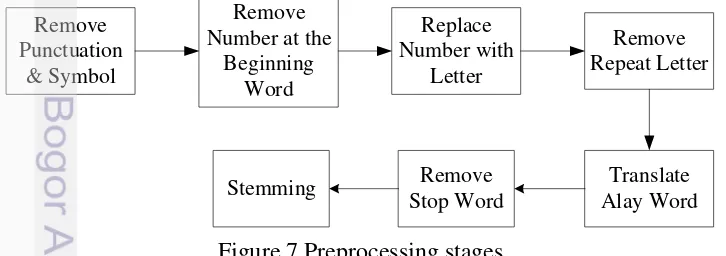
2. Preprocessing modules consist of some sub modules namely eliminate all punctuation and symbols; eliminate numbers in front of words; replace number with a letter; eliminate repeated letters; translating the "Alay" normal words into words; eliminating the stop word and perform the word stemming. All modules and preprocess algorithms were made by the author except Porter Algorithms for stemming preprocess. The modules were made using Visual studio .Net 2012 with C # programming language
3. Model classifier module using Java programming language. It was developed from Weka library(http://www.cs.waikato.ac.nz/ml/weka/contributors.html) 4. Module for evaluation of preprocess using C # Visual Studio .NET 2012. This
module was created by the author
5. Module for evaluation of the model using Java programming language. This
module was developed from Weka library
(http://www.cs.waikato.ac.nz/ml/weka/contributors.htm). System Design
Here are flow diagram of sentiment analysis system. In this study involved only two entities ilustrated in Figure 4, they are as user that give comments on
Database MySql
Watching TV Comments on twitter
Crawler Application
Tweets Data
Preprocess Application
Result of preprocessing
Classifier Application
ARFF File
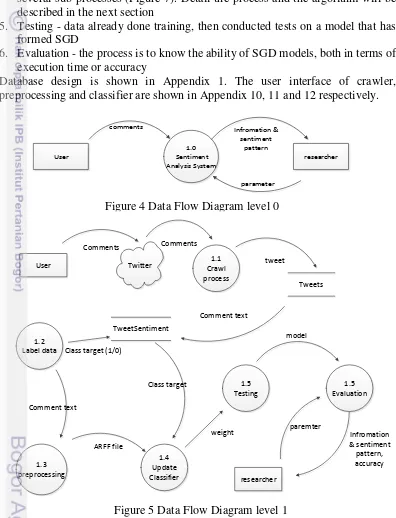
11 twitter and researcher as an entity that consume information and patterns of sentiment for the development of further research. On this system, there are several processes ilustrated in Figure 5, namely:
1. Crawl process - to get tweet data and stored the data in Table tweets
2. labeling data manually for training process and stored in the table tweetsentimen 3. Preprocessing - at this stage there are several sub preprocessing as shown in Figure 6. The process details and the algorithm will be described in the next section
4. Update classifier - in this process SGD model applied. At this stage there are several sub-processes (Figure 7). Detail the process and the algorithm will be described in the next section
5. Testing - data already done training, then conducted tests on a model that has formed SGD
6. Evaluation - the process is to know the ability of SGD models, both in terms of execution time or accuracy
Database design is shown in Appendix 1. The user interface of crawler, preprocessing and classifier are shown in Appendix 10, 11 and 12 respectively.
1.0
Figure 4 Data Flow Diagram level 0
1.1
12
Preprocessing
To answer the problem of unstructured data, diverse and lots of noise some preprocessing methods and techniques carried out. The following are the techniques and methodologies was used in the preprocessing in this research. In general, the preprocessing can be described as follows in Figure 7:
Remove
Figure 7 Preprocessing stages
1.3.7
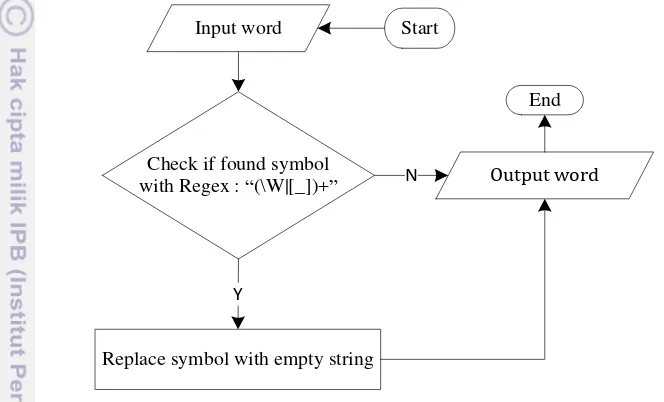
13 Eliminate All Punctuation and Symbols
This information generally does not add to the understanding of text and will make it harder to parse the words on some comments on Twitter. This information includes single and double quotation marks, parentheses, punctuation, and other symbols such as dollar signs and stars. For examples, "Haruskah kita membayar kembali negeri ini !!, tp selama kita terus bertanya apa negara ini dapat memberikan." Christine Hakim #MN, and after the process of removing punctuation and symbols, the sentence becomes "Haruskah kita membayar kembali negeri ini, tp selama kita terus bertanya apa negara ini dapat memberikan." Christine Hakim #MN. The algorithm is shown at Figure 8.
To eliminate the symbol of each word using the replace function to replace symbol with empty character by regular expression of .net library. Regular expressions were designed to represent regular languages with a mathematical tool, a tool built from a set of primitives and operations. This representation involves a combination of strings of symbols from some alphabet Σ parentheses, operators +, and * (Xavier 2005). Here is the formulation: Regex.replace (String Input, string pattern, MatchEvaluator evaluator) and the combination of regex code is " (\W|[_]+)". Characters "\W" means not word, matches any character that is not a word character (alphanumeric & underscore). Character "|" means alteration, act like a boolean OR. Matches the expression before or after the "|". Characters "[_]" means character set, match character in the set. Meaning each character is taken from http://www.regexr.com/ created by Grant Skinner & The Gskinner Team in 2008. Input is the string to search for a match, string pattern is combination of regex characters for grapping of symbol and replace all string that match a specified regular expression.
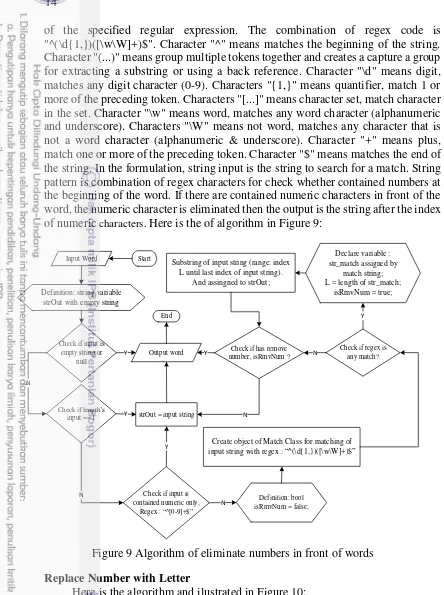
Eliminate Numbers in front of Words
For examples, "2hari" becomes "hari". Just like remove symbol, remove number also use match character function to remove number by regular expression of .net library. Here is the formulation: Regex.Match(string input, string pattern). This formulation means searches the specified input string for the first occurrence
Input word
Check if found symbol with Regex : “(\W|[_])+”
Replace symbol with empty string
Y
Output word
N
Start
End
14
of the specified regular expression. The combination of regex code is "^(\d{1,})([\w\W]+)$". Character "^" means matches the beginning of the string. Character "(...)" means group multiple tokens together and creates a capture a group for extracting a substring or using a back reference. Character "\d" means digit, matches any digit character (0-9). Characters "{1,}" means quantifier, match 1 or more of the preceding token. Characters "[...]" means character set, match character in the set. Character "\w" means word, matches any word character (alphanumeric and underscore). Characters "\W" means not word, matches any character that is not a word character (alphanumeric & underscore). Character "+" means plus, match one or more of the preceding token. Character "$" means matches the end of the string. In the formulation, string input is the string to search for a match. String pattern is combination of regex characters for check whether contained numbers at the beginning of the word. If there are contained numeric characters in front of the word, the numeric character is eliminated then the output is the string after the index of numeric characters. Here is the of algorithm in Figure 9:
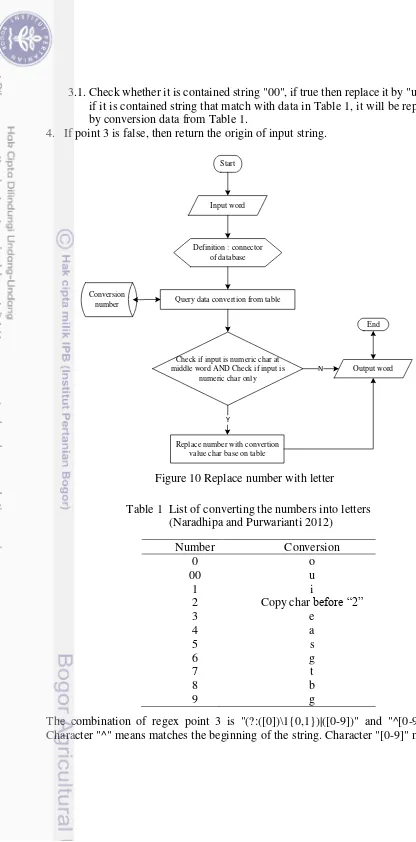
Replace Number with Letter
Here is the algorithm and ilustrated in Figure 10: 1. Get list data conversion from database base on Table 1 2. Insert list data conversion to hash variable
3. Check numeric character in the middle of input string and check if it is not contained all numeric character using regex, if true then
Input Word
Create object of Match Class for matching of input string with regex : “^(\d{1,})([\w\W]+)$”
Check if regex is any match? Check if has remove
number, isRmvNum ? N
Declare variable : str_match assigned by
match string; L = length of str_match;
isRmvNum = true;
Y Substring of input string (range: index
L until last index of input string). And assingned to strOut;
15 3.1.Check whether it is contained string "00", if true then replace it by "u" else if it is contained string that match with data in Table 1, it will be replaced by conversion data from Table 1.
4. If point 3 is false, then return the origin of input string.
Definition : connector of database
Query data convertion from table Conversion
number
Check if input is numeric char at middle word AND Check if input is
numeric char only
Replace number with convertion value char base on table
Y
Output word N
Input word Start
End
Figure 10 Replace number with letter
The combination of regex point 3 is "(?:([0])\1{0,1})|([0-9])" and "^[0-9]+$". Character "^" means matches the beginning of the string. Character "[0-9]" means
Table 1 List of converting the numbers into letters (Naradhipa and Purwarianti 2012)
Number Conversion
0 o
00 u
1 i
2 Copy char before “2”
3 e
4 a
5 s
6 g
7 t
8 b
16
matches character in the range "0" to "9". Character "+" means plus, match one or more of the preceding token. Character "$" means matches the end of the string. Eliminate Repeated Letters
Here is the algorithm:
Examples: "Pagiiiiiiiiiii" becomes "pagi". In Figure 11, check if it has repeated letter then take the first character only. The combination of regex code for checking that only numeric character is "^[0-9]+$". And the combination of regex code for checking repeated letter is "([a-zA-Z0-9])\1{1,}". Characters "a-z" means matches a character in the range "a" to "z". Characters "A-Z" means matches a character in the range "A" to "Z". Characters "0-9" means matches a character in the range "0" to "9". Characters "\1" means matches the results of capture group 1 (refers to "([a-zA-Z0-9])"). Characters "{1,}" means match one or more of the preceding token.
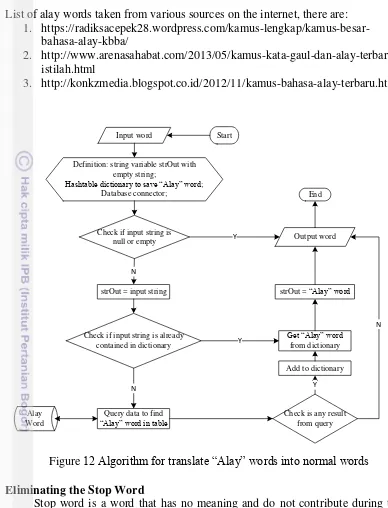
Translating the “Alay” Words into Normal Words
“Alay” word is excessive or strange words and also use writing mixed numbers at once or using uppercase and lowercase letters that are not reasonable (Meyke 2013). It is stored in the database and called as alay data dictionary. The program will check into database whether the word included the Alay words or not, and then translate the words Alay into normal words. Examples: "eM4Nk 4LaY GhHeToO" becomes "emang alay gitu”. The following is algorithm for translate the "Alay" word into normal word and ilustrated in Figure 12:
1. Check to the dictionary hash table, if the word is not exist in the data dictionary then
1.1.Get data to database base on alay word input
1.2.If any result from query, then add the data to dictionary (hash table) 1.3.data result of query will be returned as output translate word
2. If the word exist in the data dictionary, then return the translate result from dictionary hash table
Input word
Check if input is contained numeric only, Regex : “^[0-9]+$”
Check if string input is contained consecutive repeat chars, Regex : “([a-zA-Z0-9])\1{1,}”
N
Output word Y
Replace repeat chars with result of substring for repeat chars with range index 0 until 1
Y
N Start
End
17 List of alay words taken from various sources on the internet, there are:
1. https://radiksacepek28.wordpress.com/kamus-lengkap/kamus-besar-bahasa-alay-kbba/
2. http://www.arenasahabat.com/2013/05/kamus-kata-gaul-dan-alay-terbaru-istilah.html
3. http://konkzmedia.blogspot.co.id/2012/11/kamus-bahasa-alay-terbaru.html
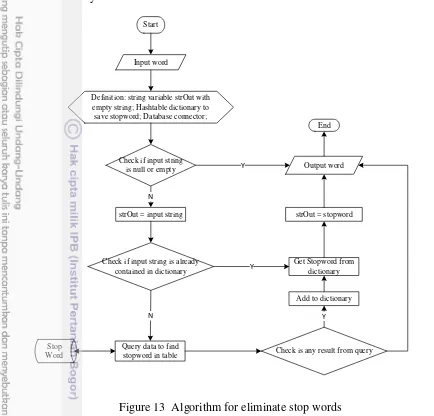
Eliminating the Stop Word
Stop word is a word that has no meaning and do not contribute during the processing of the data. Stop word is also stored in the database data as data stop words dictionary are like Alay data. If there are words that are listed in the table stop word, the word is removed. Examples: "Jika dia pergi" becomes "pergi”. The following is an algorithm for eliminate stop word and ilustrated in Figure 13: 1. Check to the dictionary hash table, if the word not exist in the stop word data
dictionary then
1.1.Get data to database base on stop word input
1.2.If any result from query, then add the data to stop word dictionary (hash table)
1.3.Data result of query will be returned as output translate word
Input word
Definition: string variable strOut with empty string;
Hashtable dictionary to save “Alay” word; Database connector;
Check if input string is null or empty
strOut = input string N
Check if input string is already contained in dictionary
Query data to find
“Alay” word in table
N
Alay Word
Check is any result from query
18
2. If the word exist in the data dictionary, then return the translate result from dictionary hash table
Perform the Word Stemming
Stemming is the process of transformation of words contained in a document to basic word (root word) with certain rules. The algorithm that used to stemming is called Porter Algorithm for the Indonesia language (Agusta 2009) and ilustrated in Figure 14. The following is Porter algorithm:
Step 1 : Removing the particles
Step 2 : Removing possessive pronoun
Step 3 : Delete the first prefix. If there is a second prefix, go to step 4.1, if there is suffix then go to step 4.2
Step 4 :
Step 4.1 Removing second prefix, proceed to step 5.1.
Step 4.2 Removing suffix, if it is not found then the word is assumed to be the root word. If found then proceed to step 5.2
Step 5 :
Step 5.1 Removing suffix, then the final word is assumed to be the root word.
Input word
Definition: string variable strOut with empty string; Hashtable dictionary to save stopword; Database connector;
Check if input string is null or empty
strOut = input string N
Check if input string is already contained in dictionary
Query data to find stopword in table
N
Stop
Word Check is any result from query
Add to dictionary
19 Step 5.2 Deleting a second prefix, then the final word is assumed to be the
root word.
Classification Model using SGD
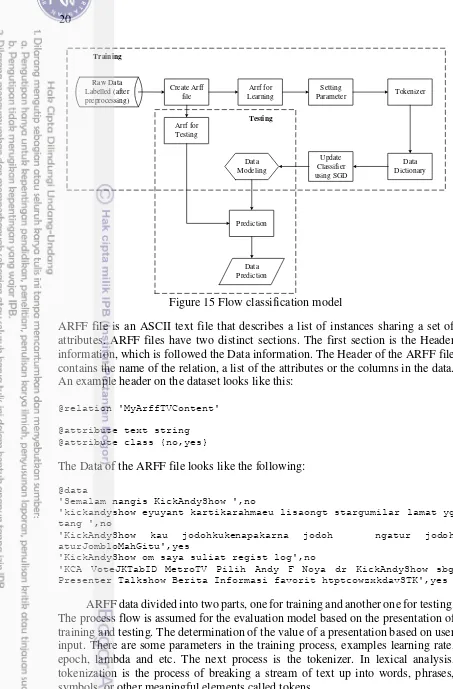
The reason of the use of SGD in this study because the data being processed is a data stream that is continuously updated each time. The stream data has characteristics that flows continuously, very large and real time. SGD has the ability to use only one training sample from training set to do the update for a parameter in a particular iteration. In the processing of stream data, the data do not wait until pilling up but the data processing is done continuously in real time as long as the data is being streamed. In most machine learning, the objective function is often the cumulative sum of the error over the training examples. But the size of the training examples set might be very large and hence computing the actual gradient would be computationally expensive. In SGD method, compute an estimate or approximation to the direction move only on this approximation. It is called as stochastic because the approximate direction that is computed at every step can be thought of a random variable of a stochastic process. There are two main parts in machine learning namely, training and testing. The data model generated from the training process is used for the prediction process in sentiment discovery. This is an answer to the second problems in thisresearch. Figure 15 shows a general overview of the training and testing process.
First of all, the tweet data that have been labeled positive (yes) and negative (no) stored in Attribute-Relation File Format (ARFF) file. The reason for using the file ARFF because SGD library that is used comes from the Weka application. An
Input word Definition: string variable
strOut with empty string
Check if input string is null or empty by checking into particle
table (database)
Identifying input string
by checking into prefix’s
first person table
Identifying input string
by checking into prefix’s
second person table
Identifying input string
by checking into prefix’s
first person table
Start End
20
ARFF file is an ASCII text file that describes a list of instances sharing a set of attributes. ARFF files have two distinct sections. The first section is the Header information, which is followed the Data information. The Header of the ARFF file contains the name of the relation, a list of the attributes or the columns in the data. An example header on the dataset looks like this:
The Data of the ARFF file looks like the following:
@data
'Semalam nangis KickAndyShow ',no
'kickandyshow eyuyant kartikarahmaeu lisaongt stargumilar lamat yg tang ',no
'KickAndyShow kau jodohkukenapakarna jodoh ngatur jodoh aturJombloMahGitu',yes
'KickAndyShow om saya suliat regist log',no
'KCA VoteJKTabID MetroTV Pilih Andy F Noya dr KickAndyShow sbg Presenter Talkshow Berita Informasi favorit htptcowzxkdavSTK',yes
ARFF data divided into two parts, one for training and another one for testing. The process flow is assumed for the evaluation model based on the presentation of training and testing. The determination of the value of a presentation based on user input. There are some parameters in the training process, examples learning rate, epoch, lambda and etc. The next process is the tokenizer. In lexical analysis, tokenization is the process of breaking a stream of text up into words, phrases, symbols, or other meaningful elements called tokens.
Raw Data
21 From Figure 16 shows that contents of ARFF file is called as data instances. Selection of evaluation model is done at the beginning whether using "Simple Split" or "K-Fold Cross-Validation". Simple Split is divide instance of data become two parts, namely as training and testing data. In other case, if selecting to use K-Fold Cross-Validation, that instance of data was divided by its k-folds. Evaluation model will be described more detail on below evaluation model section. Every evaluation model that used, both of them are containing training and testing steps. Training and testing process steps as shown in flow chart above has sub processes that contained several method and it will be described more detail using illustration of next flow chart. Shaded blocks indicate sub processes and algorithms in it, like the shaded block Training and Testing in Figure 16.
Figure 17 is a flow chart for training process. Instance data is stored in hashmap of dictionary, which is a structure of data based on hashing, and allows to store the object as key value pair. In this case HashMap (key, object value) means that each record data has a key word and an object value. Beside that, its object value is an object that contained two data values, which are number of word and weight. If data instance is greater than zero, then data raw position to be placed at random position. The goal is data input can be closer to the real condition in implementation with different inputs. Main process on this algorithm is update classifier on shaded block as ilustrated in Figure 17. Update classifier is repeated as much as epoch and data instance in looping process. More detail explanation of update classifier can be found at Figure 17 and 18. Calculations on Figure 17 and 18 is refer to the formulation number 3.
Create percentage of data
training and percentage of data testing
Create an array 2 dimension: Data[0][folds_number] for training and
Data[1][folds_number] for testing
Y
End
i=0;
Create object vector for collecting prediction.
i < folds_number Create split for cross validation
Start
22
Check if instance data has instance > 0
Swap with randomize rows of data instance Y
e = 0
Check if e < m_epoch
i = 0
Figure 17 Training Flow referenced from Weka libraries
Input : Instance, bool updateDictionary, m_bias
Class index < 0 (negative number if it's
undefined)
double multiplier = 1; Check if instance data
count (rows) == 0
multiplier = 1 - (m_learningRate * m_lambda) / m_t;
Y
multiplier = 1 - (m_learningRate * m_lambda) / instance data count;
N
Update weight with multiplier, By looping for all weight from dictionary:
weight(index) *= multiplier; N
End Y
Start
23
Update classifier on shaded block has a main process for updating weight in every tweets. In the function Update classifier there are several sub-processes, namely "tokenizer" and "dotprod". Tokenizer (tokenization) has a main process for breaking a stream of text up into words, phrases, or other meaningful elements called tokens. If class index is greater than zero, then next process is tokenizer. Algorithms of tokenizer is shown in Figure 20. Input data of tokenizer is an instance data, and in this case, an instance data is one tweet data, that represented in hashmap. Tokenizer has some checking processes to validate data, before going to its main process. First, it validates input instance data, to check if it is NULL or not, and second checking if its attribute type is a string data type. Why must string type?, because its raw input ARFF file consists two attributes, such as string data type (tweet data) and class data type (label). Its filtering target is to take tweet data only, so data that has string data type will be processed. For its detail, here for example:
@attribute text string @attribute class {no,yes}
'KCA VoteJKTabID MetroTV Pilih Andy Noya dr KickAndyShow sbg Presenter Talkshow Berita Informasi favorit'
Tweet sentence above cut into words :
[0] KCA
[1] VoteJKTabID
[2] MetroTV
[3] Pilih
[4] Andy
[5] Noya
Check if z < 1 Y dLoss = 1
dLoss = 0 N
double factor = m_learningRate * y * dloss;
Input_map has more entry N M_bias += factor
m_t++;
Output: Hashmap dictionary Get word from entry element;
Get count word from entry element; Y
Check if weight is not null Result += count word * factor
Y N
Start
End
24
Check if input_map is null
Check if instance for index i is string;
AND not missing (undifined)
Y
Get word list from instance Y
Word list has more element Output:
Get count of word from input_map Y
Check if weight still not created yet
Update weight of word to input_map base on key (word) N
Add weight of word to input_map. (key : word, value : weight of word) Y
updateDictionary Get weight of word
from dictionary
Y
N
Check if weight still not created yet Update weight of word to
dictionary base on key (word) Add weight of word to dictionary. (key : word, value : weight of word)
N
Y N
Start
End
25
Next step, count the number of words in data tweet above. If the number of words are taken has not been exist before, then add the initial weights into hashmap. If word as key of hashmap has been found, then its value as weight is updated. Beside that, update for number of word and weight value from dictionary only performed on first looping of update classifier or when epoch is zero.
[0] KCA
Update classifier process contained sub process that called dotprod. Flow of dotprod is illustrated in Figure 21. Sub process “dotprod” is sum of the whole process of multiplication the number of words with the weights. The number of words in this case is accumulated by looping of the step. Input of dotpord process is instance data and hashmap dictionary that resulting from tokenizer. Hashmap instance data and hashmap dictionary is different thing. Hashmap instance data is unique words collection in one tweet, while hashmap dictionary is unique words collection from all tweets data that has been processed. In this section, it has main process to perform multiplication of the number of words (cw) and its weights (w) cumulatively as much as number of dictionary (nd). Results of dotprod stored in variable wx referenced from Weka libraries.
= ∑�= � . � (5)
The next update classifier step is calculating z value. z is obtained by multiplying value of class attribute and the result of additional operation between
wx and bias (b). Class attribute (y) consists of two values (1 and -1). Positive value (1) is represented for positive sentiment (from label “yes") and otherwise, negative value (-1) indicate for negative sentiment (from label "no") referenced from Weka libraries.
26
Next, calculating multiplication (m) of weight referenced from Weka libraries. If count of instance data equal with zero, then:
= − � . � (7)
If not equal with zero then the m value is:
= − � � �� . � � (8)
Update weight with multiplier by looping for all weight from dictionary referenced from Weka libraries:
= � . (9)
Process of updating weight has main calculating, that multiplying by multiplier value. Multiplier is value that less than 1, so the weight that has been updated to be smaller than before. Multiplier value is determined by some parameters, such as lambda and learning rate. The greater of lambda and learning rate makes multiplier become smaller. In addition, multiplier also influenced by
Input: Hashmap input_map,
Hashmap dictionary Definition:
double result = 0;
Check if input_map has more entry
Get entry element from input_map
Y
Get word from entry element; Get count word from entry element;
Get weight of word from dictionary. By using key : word Check if weight is
not null
Result += count of word * weight Y
N
Output: Result, input_map,
dictionary N
Start
End
27 amount of training data. It inversely with lots of training data, so its value is decreasing when amount of training data to be increased. Therefore, it can be concluded that the process of updating weight is decreasing gradually because of multiplying result by multiplier that has been updated too.
If value of z above is less than 1, then giving loss value 1 and otherwise is 0. Loss function or cost function is a function that maps an event or values of one or more variables intuitively onto a real number representing some "cost" associated with the event. The hinge loss ( � ) is a loss function used for training classifiers. Next is calculating its factor (f) by multiplying learning rate (α), target value ( , and loss value (dloss) referenced from Weka libraries.
= � . . � (10)
For each input map, this process gets the word and count of word (cw) from result of fetching entry element referenced from Weka libraries. If the weight is not equal to NULL then:
= ∑ . (11)
After all input map has been updated, so the bias (b) is calculated based on accumulated between it and factor value (f) of this step referenced from Weka libraries:
= ∑ + (12)
From all of the formulas Fnewwhich is provided in equation 4:
� = ∑�= [∑�= . − �.� + � . | + |] (13)
Where n = number of rows; i = sum of iteration; w = weight; � = Learning Rate; = Lambda; y = label; = accumulation of weight (per word); b = bias.
Here is example of a dictionary or data model to determine the class label: Dictionary size: 1252
class =
28
0.1699 On 1.0 -0.04 akses 21.0
0.12 htptcobIYZaplNs 2.0 -1.4895 MataNajwa 56.0 ...
0.05 htptcoOeRkaQgeyA 1.0 -0.2499 sbaga 1.0
-0.2499 year 1.0 0.66
The above data dictionary consists of three columns, namely weight, word value and number of words. Wight is the result of a calculation referenced from the formula number 8. Complete data contained in Appendix 9. This is the model generated from the training process. Weight and number of words reused during the testing process. Every word in the sentence is searched on a dictionary to get the weight and number of words. Every word have the number of words (cw) and weight (wi) which is multiplied, then the result is added as a count of word in the
sentence (wx). To get the class of positive and negative values of the above
29
Bias value results from training process same as weight. Formulation 14 and 15 are referernced from Weka libraries. If the z value is greater than 0 then the result value is 1 else -1. A value of 1 indicates positive sentiment (yes) and -1 indicates negative sentiment (no). Figure 22 ilustrate a flow for testing process.
Model Evaluation
After building a classification model, the next question is how to evaluate the model that has been created and how to measure accuracy. The method used to evaluate the model in this study is Simple Split and K-Fold Cross-Validation. In Simple Split or holdout, the given the data are randomly partitioned into two independent sets, a training set and a test set (Han et al. 2012) ilustrated in Figure 23. Training set is used for training and test sets are used to test the suitability.
In k-folds cross-validation, sometime called rotation estimation, the dataset is randomly split into k mutually exclusive subsets (the folds) D1, D2, D3,...,Dk of approximately equal size. The inducer is trained and tested k times; each time time { , , . . . , k}, It is trained on D\Dt ad tested on Dt. The cross validation estimate is the overall number of correct classifications from the k iterations, divided by the total number of tuples in the initial data (Han et al. 2012).
4
RESULT AND DISCUSSION
Preprocessing Experiment and Evaluation
Experiment and evaluation of preprocessing is performed to determine the ability and execution time quantitatively of the preprocess algorithm that was made in this study. Evaluation seen both in terms of accuracy and execution time. Number of data sources were used in the preprocess evaluation are 760 tweets derived from @kickandyshow account. Here are the results of testing and experimentation for each stage of preprocessing:
Figure 23 Estimating Accuracy with holdout method (Han
30
Eliminate All Punctuation and Symbols
Steps of testing performed to evaluate eliminating all punctuation and symbols:
1. Counting all punctuation and symbols in the data source
2. Then do the preprocess to Eliminate all punctuation and symbols in the data source
3. Recalculating number of punctuation and symbols in the results of the preprocessing.
The results of this preprocessing phase that 100% all punctuations and symbols can be eliminated. The time required to perform this preprocessing is 2 milliseconds. Result sample of eliminate all punctuation and symbols is shown in Appendix 2 Eliminate Numbers in front of Words
Steps of testing was performed to evaluate eliminating numbers in front of words:
1. Counting numbers in front of words in the data source
2. Then do the preprocess to Eliminate numbers in front of words in the data source 3. Recalculating of numbers in front of words in the results of the preprocessing The results of this preprocessing phase that 100% all numbers in front of words can be eliminated. The time required to perform this preprocessing is 2 milliseconds. Result sample of eliminate numbers in front of words is shown in Appendix 3. Replace Number with Letter
Steps of testing was performed to evaluate replace number with letter: 1. Counting all the words that have numbers in the middle word at the data source 2. Then do the preprocessing replace number with letter
3. Recalculating words that have numbers in the middle word after preprocessing The results of this preprocessing phase that 100% all numbers in front of words can be replaced. The time required to perform this preprocessing is 2 milliseconds. Result sample of replace number with letter is shown in Appendix 4.
Eliminate Repeated Letters
Steps of testing was performed to evaluate eliminating repeated letters: 1. Counting numbers repeated letters in the data source
2. Then do the preprocessing to Eliminate repeated letters in the data source 3. Recalculating of numbers repeated letters in the results of the preprocessing The results of this preprocessing phase that 100% all repeated letters can be eliminated. The time required to perform this preprocessing is 1 millisecond. Result sample of eliminate repeated letters is shown in Appendix 5.
Translating the “Alay” Words into Normal Words
31 Eliminating the Stop Word
Similar to the preprocess of alay word, eliminating the stop word requires dictionary registered in the database. The more numbers of stop words was stored in the dictionary, then percentage of accuracy will be increased. The Number of stop word was collected to support this preprocessing is 757 words. Execution time for this preprocessing step is 111 milliseconds. Result sample of eliminating the stop word is shown in Appendix 7.
Perform the Word Stemming
At this process there are list of words stored in the database. The data is the collection of root words to support Porter Algorithm. Execution time for this preprocessing step is 1230 milliseconds. Result sample of perform the word stemming is shown in Appendix 8.
The second purpose of this experiment was to determine the accuracy of the method SGD by changing some parameters. Moreover, to know how to influence some differences preprocessing process against classification results in accuracy and processing time. Total data is used for testing and learning are 745 tweets. And here are some of the experiments were conducted:
Evaluation Model using Split Test
Preprocessing on the Classification Accuracy and Processing Time
The first test is the analysis of preprocessing on the classification accuracy and processing time. Data is divided into two parts, 90% training data and 10% testing data. The graph below shows the variation of the preprocessing of the classification accuracy which tends to rise, when the data has gone through several stages of preprocessing. Correctly classified instance is accuracy in classifying the data. Significant increases occurred for data that has been through preprocessing step, those are remove stop word and the stemming. Step Remove stop word means to eliminate words that include a Stop word in the data tweet, because it does not
Figure 24 Chart execution time on preprocessing variations
32
contribute to process of classification. While the Stemming will make words of tweet to be consist the root word only. The suffix, prefix particle, suffix will be eliminated in the process of stemming. The time required process tends to decrease if the data has been through in several preprocessing steps, shown in graph as illustrated in Figure 24
The next testing used learning rate = 0.01, epoch = 100, with variations of learning data, and also data testing. Data testing 90% until 10% using decrement step 10% and Data training 10% until 90%, and using increment step 10%. The following, Table 2 is the test results on the second test:
Testing table with learning rate = 0.01 and epoch = 100. In the table above, the data is divided into training data and data testing. In the first experiment, the training data are set by 10% of the total data and data testing by 90% of the total data. Further testing by adding the data training and reduce the data testing.
Figure 25 shows that the more training data, the classification accuracy will tends to rise. And more training data will require increasing the execution time, it is shown in Figure 26:
Table 2 Testing with learning rate 0.01 and epoch 100 Data
Testing (%)
Data Training
(%)
Learning Rate
Correctly Classified Instances (%)
Total Time Execution (seconds)
90 10 0.010 78.39 0.06
80 20 0.010 83.39 0.15
70 30 0.010 83.72 0.18
60 40 0.010 84.12 0.26
50 50 0.010 82.04 0.33
40 60 0.010 82.21 0.44
30 70 0.010 83.04 0.59
20 80 0.010 84.56 0.77
10 90 0.010 88.00 0.87
33
Changing Learning Rate
The next experiment on changing learning rate, in conditions with epoch 100 for each variation of the amount of training and testing. The below chart shows the variations on learning rate and the amount of training data in Figure 27. Learning rate 0.001 gives the classification accuracy values which tend to rise. However, the effect of changing learning rate against the execution time is not too significant. In addition that illustrated in Figure 28, the learning rate is getting smaller, so the process will take a long time tend execution when the number of training data increases. Here are the results of the comparison of experiment on changing learning rate:
Figure 27 Chart of ratio on changing learning rate
72.00 74.00 76.00 78.00 80.00 82.00 84.00 86.00 88.00 90.00
10 20 30 40 50 60 70 80 90
Co
rr
ec
tly
Cla
ss
if
ied
Ins
ta
nces
(%)
Data Training (%)
Learning Rate 0.01
Learning Rate 0.001
Learning Rate 0.0001
34
Epoch Changes to Correctly Classified Instances
Figure 29 shows that correctly classified Instances is highest during high training set and high epoch.
Figure 29 Chart of epoch changes to correctly classified instances
72.00
Figure 28 Chart of learning rate changes on execution time
35 Evaluation Model Using Cross validation
Testing by using cross validation with folds 2, 3, 4, 5, 6, 7, 8, 9, and 10 obtained correctly classified instances tend to be stable at around 84% it is seen in the following chart and table:
Figure 30 shows measurement of correctly classified instance using cross validation with variations of folds number. Correctly classified instance looks to be around 84% whatever the number of folds.
The following is a sentiment pattern formed by SGD process. "Yes” is positive sentiment and "no" is negative sentiment in Figure 31. From the figure below shows that there are two classes are concentrated in two places. Top right is a class "Yes" the positive sentiment. While on the bottom left is a collection of class "No" is negative sentiment.
Table 3 Correctly Classified Instances and Total Time Execution using Cross Validation
Folds Correctly Classified Instances (%)
36
In Figure 31 shows that sample pattern output captured that describe how sentiment point distribution for each word is placed. Red dot represented for positive sentiment words, and otherwise, blue dot describe for negative sentiment word. If its position is closer to tip, so it is signifies that sentiment is getting stronger and it makes its accuracy becomes high.
As the description of findings and computation above, the advantages of this study revealed the strength of information hiding from TV audience’s Twitters. Our preprocessing approach has succeeded to dicovered information from unstructured and noisy data. As so far, the whole processing time tended to shorter than previous studies aboutsentiment analysis on the stream data using Multinomial Naive Bayes and Hoeffding Tree. Some disadvantages include current problem in accuracy as well as the partial representation of how the evaluation of public media such as TV content scientifically computed. Based on the results of previous studies (Bifet and Frank 2010) accuracy Multinomial Naive Bayes methods better than SGD.
5
CONCLUSION AND RECOMMENDATION
The data used in this study is derived from the data twitter TV content such as comments or user tweet. Twitter account which became the object of this study is @kickandyshow.Tweet data that has been through preprocessing can be more structured text, reducing noise and reducing the diversity. Preprocessing accuracy in eliminating all punctuation and symbols, eliminating numbers, replace numbers with letters, eliminating repeated letter reaches 100 % with the execution time of each approximately 2 milliseconds for 760 tweets. Whereas, the execution time for translating the stop word, eliminating stop words and stemming is 77, 111 and 1230 milliseconds respectively. Preprocessing stages affect to the higher accuracy of the classification and reduce processing time. This study successfully extracted patterns