Appl Journal of Applied Horticulture, 17(2): 129-139, 2015
Suitable and available land for cashew (
Anacardium occidentale
L.) in the island of Lombok, Indonesia
Widiatmaka1*, Wiwin Ambarwulan2, Atang Sutandi1, Kukuh Murtilaksono1, Khursatul Munibah1 and Usman Daras3
1
Department of Soil Soil Science and Land Resources, Bogor Agricultural University, Indonesia. 2
Geospatial Information Agency, Indonesia. 3Indonesian Agency for Agricultural Research and Development, Ministry of Agriculture, Indonesia. *E-mail: [email protected]
Abstract
Cashews have a potential economic value for local people, and as a conservation plant that is appropriate for small islands, which usually have limited resource capacities. The research for this paper was conducted on Lombok Island, Indonesia with the objective to delineate the potential areas for cashew, based on land availability and land suitability. Land availability was analyzed by taking into
account the land use and land cover maps interpreted from SPOT-6 imagery, a Forest Areas Status map and a map from the Oficial
Spatial Land Use Plan. The evaluation of the land’s suitability for cashews was conducted at a land mapping unit resulting from a soil survey, carried out at a scale of 1:25,000. The suitability analysis was done using a maximum limitation method, where the suitability
level was deined by the lowest soil characteristics which determined the plant’s requirements. The land evaluation criteria were
established in previous research, which included this island as an area of criteria establishment. The research results show that the land on this island has suitability status for cashews ranging from S2 (moderately suitable) to N (not suitable). The limiting factors include water availability, nutrient retention, available nutrients and rooting media, some of which can be improved. According to the
available and suitable land, an area of 4,075.6 ha can be assigned as irst priority, 18,167.3 ha as second priority and 43,582.8 ha as
third priority for cashew expansion areas.
Key words: Geographic information system, horticultural crop, land evaluation, land use planning
Introduction
Cashew (Anacardium occidentale L.) is an important export-oriented horticultural crop (Rejani and Yadukumar, 2010; Rupa
et al., 2013) and its cultivation has increased in Indonesia
during recent years. Previously in Indonesia, this plant was used as a greening plant; however, as its economic potential has increased, the plant has been cultivated for commercial purposes. In Indonesia, small land holders conduct 95% of its cultivation, while the state or private estates operate only on 5% (Statistics
Indonesia, 2013a). The data of the Indonesian Directorate General
of Plantation (2014) show that the cashew area in Indonesia in
2008 was 573,721 ha and that it increased to 598,503 ha in 2013. The data of Statistics Indonesia (2013b) indicate that Indonesian cashew production increased from 84,200 tons in 2000 to 117,400 tons in 2013. This commodity has apparently attracting farmers’
attention because of its high economic value, and as a perennial
crop, it does not require as intensive maintenance as many other
food crops.
One of the problems agriculture faces all over the world is land availability. The extensive and rapid conversion of productive lands around the world in response to multiple demands for land raises the concern that globally, we risk running out of productive land (Lambin, 2012). In the world, land is limited, whereas the number of people who need the land continues to grow. From 2010 to 2014, the average population growth from 212 countries
was at the speed of 1.325% per year (The World Bank, 2014); and even in developing countries, its speed reached more than 3%
per year (Soubbotina, 2004; The World Bank, 2014). Increased
development and population pressure in future will impact the
land competitiveness causing land utilization conlicts. Land
allocation for various purposes thus needs to be regulated. This land allocation setting is also part of sustainable land resources utilization (Ma et al., 2011; Feizizadeh and Blaschke, 2012;
Akinci et al., 2013). In this setting, the selection of available land with high suitability for a speciic use is important. This is valid
for cashew because of its long-lived perennial nature, planting in an unsuitable land will lead to lower production, which means an
unoptimal investment for a long time, ineficient use of capital investment as well as ineficient land utilization (Hallam et al.,
2001; Bell, 2013).
Another problem Indonesia faces in cashew cultivation is low productivity. Currently, the average productivity of cashews in Indonesia is less than 500 kg ha-1 (Statistics Indonesia, 2013b).
This productivity is much lower than the productivity of cashews
in other countries (Widiatmaka et al., 2014a). In India, cashew
productivity has reached 1,180 kg ha-1 (Rao, 2013), and even in
Nigeria the cashew productivity has reached 1,970 kg ha-1 (FAO,
2011). Indonesia’s low productivity can indeed be caused by many factors such as seeds, fertilizer, plant maintenance, eradication of pests and diseases (Nair, 2010), and other factors, but also land
suitability. The suitable land for a commodity should be relected
Indonesia has many cashew production regions, among which is
West Nusa Tenggara Province. In this province, Lombok Island, which had an actual total area of cashews in 2012 of 21,834.8 ha (Statistics of West Nusa Tenggara Province, 2013), has the
potential to expand the planting of cashews, especially on land which is available for use. In this region, the cashew plant has a high economic contribution for local people, so its expansion areas is of great interest to the local people.
Natural resource use on small islands needs to be managed on
a sustainable basis (WCED, 1987; Lallianthanga and Sailo, 2013) because small islands have limited resource capacities
(Cushnahan, 2001; Reenberg et al., 2008). Small islands
must also contend with ongoing developmental pressures in addition to growing pressures from risks associated with global environmental change and economic liberalization that threaten their physical and economic security (Pelling and Uito, 2001). The sustainability of resources on small islands is very dependent on the asset management of their resources, which are generally under pressure (UNGA, 1994). Therefore, efforts should be made to avoid usage that exceeds their natural carrying capacities.
When agriculturalists want to plan cultivation, they should choose
a commodity that provides not only economic gain, but also ecological protection to the island. Cashew plants, in addition to
providing economic beneits, are also conservation plants widely used in Indonesia for greening and afforestation (Daras, 2007; Hadad, 2008) because they can adapt to various agroclimatic
conditions; therefore, the ecological aspect of sustainability is reached. Thus, the development of cashews on a small island, in
addition to providing economic beneits, will also enhance the
social aspect, as well as the island’s ecological protection, in line with the concept of sustainable agriculture (Salazar-Ordonez et al., 2013; Fauzi and Oxtavianus, 2014).
The objectives of this study were to analyze the potential expansion areas for cashew plants on Lombok Island based on the following: (i) land availability, (ii) land suitability for cashew plants, and (iii) spatial delineation and prioritization of potential land for cashew expansion areas, based on land availability and land suitability.
Materials and methods
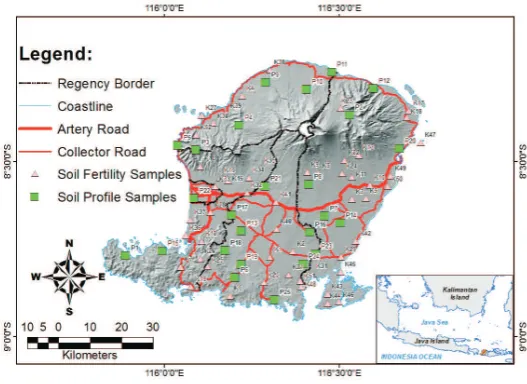
The study was carried out on Lombok Island, West Nusa Tenggara
Province, Indonesia (Fig. 1). Geographically, the island is located
in 115.46°-116.20°E, and 8.25°-8.55°S. This island covers an area of 5,435 km².
Lombok Island has an average rainfall of 1,586 mm year-1, with
fairly diverse regions. The highest annual rainfall of 2,855 mm
year-1 is reached in Sembalun District in East Lombok, while the
lowest annual rainfall of 281 mm year-1 is recorded in Keruak
District in East Lombok (Statistics of East Lombok Regency,
2012). The topography of the island is dominated by Mount
Rinjani in the northern part, whose height reaches 3,726 meters
above sea level, making it the third highest mountain in Indonesia.
The southern part of the island consists mostly of lat land that
can be used for agriculture.
Data: Land use and land cover were delineated using SPOT-6
imagery from 2013, with an accuracy of 2.5 m (Widiatmaka et al., 2013; 2014b). Image interpretation and classification was performed by supervised classification using ERDAS Imagine software, followed by ield checking. Field checking
was performed for each type of land use and land cover. The
technique of ield checking involves the observation of land use and land cover characteristics in the ield, which were then
matched with their appearance in the image. Interviews with the community were also conducted to gather information that could
not be identiied from the image, such as the type of plants, plant canopy strata, and historical land use changes. The results of ield
checks were used as a basis for reinterpretation in order to obtain
the inal land use and land cover map. Imagery interpretation of SPOT-6 produced 28 kinds of land use and land cover based
on standard national of imagery interpretation (SNI, 2010), but
for the purposes of simpliication in this article, land use and
land cover are grouped into 14 kinds of land use and land cover.
Especially for paddy ields, veriication was done using IKONOS
imagery from 2012, as interpreted by the Indonesian Ministry of
Agriculture (Widiatmaka et al., 2014b).
Land Mapping Units (LMUs) were obtained from a soil survey
and land evaluation project conducted in 2013 on the initiative
of the Geospatial Information Agency, Indonesia. The soil survey
was performed in an area of 289,049 ha outside the forest area
and settlement area. Morphological observation of the soil was conducted by auger observation following the soil survey method
of Soil Survey Division Staff (1993). In total, there were 842
morphological observations of the soil, which were input to
delineate LMUs’. The 103 soil samples representing LMUs were
then taken for laboratory analysis (Fig. 1.). Physical and chemical
soil properties were analyzed in the laboratory of the Department of Soil Science, Bogor Agricultural University using standard
laboratory methods (Tan, 2009). The survey results were outlined in a soil map at a scale of 1:25,000, which is currently available
in the Geospatial Information Agency, Indonesia (Widiatmaka et al., 2013, 2014b).
Spatial data of the areas with different forest status was obtained from a map of Forest Area Status (FAS) at a scale of 1:250,000 and was provided by the Ministry of Forestry (Forestry Planning Agency, 2002). In this map, various states of the forest areas are presented, including information about the different areas’
allowance for cultivation. The oficial land use plan was obtained from spatial data from the document of Oficial Spatial Land Use Plan (OSLUP) of West Nusa Tenggara Province, available at a scale of 1:100,000 (Regional Goverment of West Nusa Tenggara Province, 2010). In the OSLUP, land has been oficially allocated
for different uses.
Analysis: The analysis procedure used in this research is described in Fig. 2. Land availability analysis was done by overlaying land use and land cover maps resulting from the SPOT-6 interpretation, a map of FAS and a map of OSLUP. The land suitability analysis for cashews was conducted using soil survey
data. Both were then spatially overlaid to obtain spatial data for
the suitability of the available land.
The land suitability analysis for cashews was conducted using
Automated Land Evaluation System (ALES) (Rossiter, 2001). The maximum limitation method (FAO, 1976; De la Rosa and van Diepen, 2002) was used for land evaluation. In this method, the
degree of limitations of land use is imposed by land characteristics
on the basis of permanent properties, a criterion is so needed (De la Rosa and van Diepen, 2002).
Theoretically, there are two approaches in land evaluation, i.e.
direct land evaluation and indirect land evaluation (FAO, 1976). In direct land evaluation, the assessment is done directly to the growth or production of plants: lands in which a plant produces a high yield are described as suitable for such a plant, while lands in which plants produce lower yields are described as less
suitable. These classiications can further be delineated as very
suitable, suitable, marginally suitable and not suitable. In indirect
land evaluation, the suitability of speciic lands for speciic plants is described according to land quality, based on experience and
previously known empirical data. In this case, land suitability
assignments needed a criteria of a land’s requirement for a speciic
plant, which criteria was established based on experience in various other places. Assessment was then carried out, using the maximum limitation method, by matching the criteria of land characteristics of the area being assessed, compared to the land
requirements of the plant (De la Rosa and van Diepen, 2002).
Such a method is the most widely practiced in Indonesia because
it can be done quickly (Ritung et al., 2007). Nevertheless, one of the weaknesses in land evaluation in Indonesia is the lack of criteria. Several criteria are available; however, they have not been
Fig. 2. Research steps followed to define suitable and available land for cashew plants in the island of Lombok, Indonesia
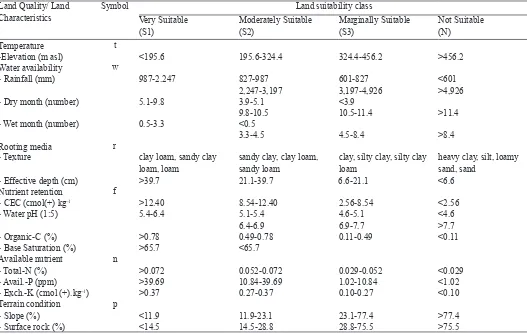
Table 1. Land suitability criteria for cashew
Land Quality/ Land Characteristics
Symbol Land suitability class
Very Suitable (S1)
Moderately Suitable (S2)
Marginally Suitable (S3)
Not Suitable (N)
Temperature t
-Elevation (m asl) <195.6 195.6-324.4 324.4-456.2 >456.2
Water availability w
- Rainfall (mm) 987-2.247 827-987 601-827 <601
2,247-3,197 3,197-4,926 >4,926
- Dry month (number) 5.1-9.8 3.9-5.1 <3.9
9.8-10.5 10.5-11.4 >11.4
- Wet month (number) 0.5-3.3 <0.5
3.3-4.5 4.5-8.4 >8.4
Rooting media r
- Texture clay loam, sandy clay
loam, loam
sandy clay, clay loam, sandy loam
clay, silty clay, silty clay loam
heavy clay, silt, loamy sand, sand
- Effective depth (cm) >39.7 21.1-39.7 6.6-21.1 <6.6
Nutrient retention f
- CEC (cmol(+) kg-1 >12.40 8.54-12.40 2.56-8.54 <2.56
- Water pH (1:5) 5.4-6.4 5.1-5.4 4.6-5.1 <4.6
6.4-6.9 6.9-7.7 >7.7
- Organic-C (%) >0.78 0.49-0.78 0.11-0.49 <0.11
- Base Saturation (%) >65.7 <65.7 Available nutrient n
- Total-N (%) >0.072 0.052-0.072 0.029-0.052 <0.029
- Avail.-P (ppm) >39.69 10.84-39.69 1.02-10.84 <1.02
- Exch.-K (cmol (+).kg-1) >0.37 0.27-0.37 0.10-0.27 <0.10
Terrain condition p
- Slope (%) <11.9 11.9-23.1 23.1-77.4 >77.4
- Surface rock (%) <14.5 14.5-28.8 28.8-75.5 >75.5
built based on empirical knowledge of production as required by
the FAO (1976). As a result, often the use of inaccurate criteria
causes diagnostic errors in land evaluation. Frequently, it has
been found that commodities grow and produce well in a region, but the evaluation using improper criteria produce low suitability classes, and vice versa. Such phenomena are often found in land
evaluation (Sutandi and Barus, 2009; Widiatmaka et al., 2014a).
To avoid such an error in land evaluation, various studies have been done to develop criteria that are relevant to crop production (Ritung et al., 2007; Sutandi and Barus, 2007). In the case of the
cashew plant, a criterion that relates to land characteristics and
production has been built and recently published (Widiatmaka et al., 2014a). In that research, the criterion was built with a soil survey, confronted with cashew production. Cashew plantations
in ive provinces and 12 regencies were sampled; Lombok Island
is one of the areas that was used for establishing the criteria
(Fig. 3). The data for production per tree per year were obtained
from farmers, while the soil was sampled and analysed in the laboratory. Age-adjusted cashew production was used as the yield response and plotted against land characteristics. The criteria were then established using a projection of the intersection between the boundary line and yield interval. The resulting criterion (Table 1) is considered appropriate to be used in this study because it was constructed in the area that includes Lombok Island as a location of data retrieval for confrontation between land characteristics and production.
Using such criteria, we used the land evaluation concept of the
FAO (1976) for this research, where land was classiied as either S1 (very suitable), S2 (moderately suitable), S3 (marginally suitable), or N (not suitable). ALES ver. 4.65e, ArcGIS 10.2 and Microsoft Ofice were used as software tools. Analysis was performed by integrating Arc-GIS and ALES.
The land evaluation model using ALES consists of several steps
(Rossiter, 2001). The Land Use Type (LUT), which in this case is
the cashew, was established irst. Land Use Requirement (LUR)
for this LUT was then established. In the next step, choice and establishment of Land Characteristics (LCs) for each LUR
and LUT were done. Finally, a Decision Tree (DT) was made
according to the criteria. The land characteristics used for the
land evaluation were stored in the ALES database. The land
suitability evaluation was done for each LMU. The results of
ALES analysis were then transferred to the ArcGIS 10.2 for
geographical reference and are described in the form of maps and tables.
Results and discussion
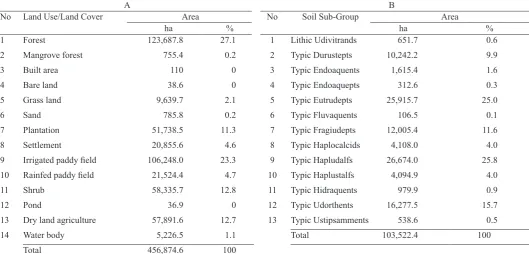
Land use and land cover: The results of the land use and land cover analysis are presented in Fig. 4a and Table 2A. The main land use and land cover in Lombok Island are the following:
forest, paddy ield, shrub, dry land agriculture, and plantation.
Forest cover is the widest, located in the northern part of the island from the hilly part of the region, climbing to the direction of Mount Rinjani. The south part of the region is dominated by farms and plantations. Settlements are concentrated in the capital, Mataram, and the surrounding region.
Soil and land mapping unit: The overall area of Lombok Island is divided into 52 LMUs. The components of LMU used in this
study include the soil classiication in the sub-group categories, parent material, slope, and physiography (USDA, 2010). A map
of Lombok Island based only on soil sub-group is presented in Fig. 4b. A summary of the soil distribution in the study area is
presented in Table 2B. The soil in Lombok Island comprises ive soil orders (USDA, 2010), including Alisols, Inceptisols, Entisols, Andisols and Aridisols, and there are 13 soil sub-groups. Inceptisols occupy the largest area, covering 268,226.2 ha, or 58.7% of the area. Another soil order that is also quite widely spread is Alisols, which covers an area of 117,357.4 ha Fig. 3. Survey region for establishing the land suitability criteria for cashews (Widiatmaka et al., 2014a). Lombok Island includes sampling locations, resulting in criteria that were then used to evaluate land suitability for this paper.
or 25.7%. The dominancy of Inceptisols and Alisols is related to soil development, which has been inluenced by the local climate (Widiatmaka et al., 2014b). Alisols is characterized by
an accumulation of clay in a sub-soil horizon, namely the argillic
horizon, and it has a high base saturation (>35%) (USDA, 2010).
Inceptisols is a soil that is relatively young; the soil development is not very advanced. The development of Inceptisols and
Alisols is related to the relatively dry climate areas (Tan, 2009; Widiatmaka et al., 2014b).
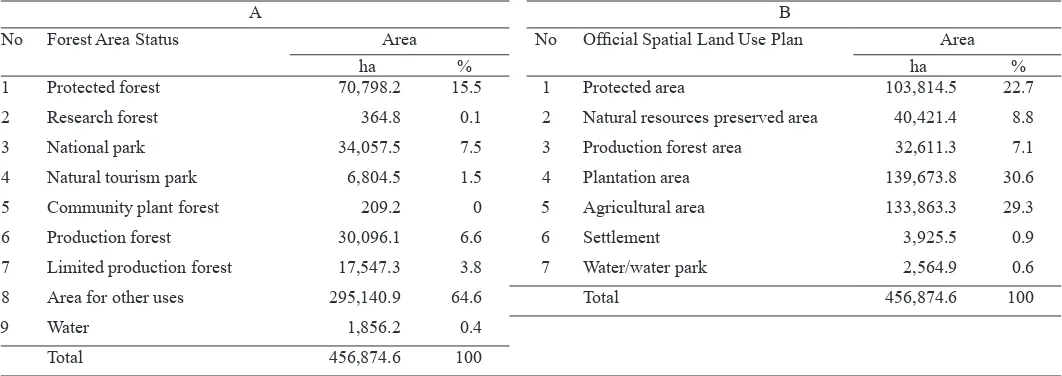
Forest area status: The FAS map is presented in Fig. 5a, while the area of each forest’s status within the map is presented in
Table 3A. Land utilization for non-forest purposes in Indonesia is
regulated by the Forestry Law No. 41/1999. The cultural activity (settlement, agriculture, industry etc.) is prohibited in forest areas. This regulation is intended to preserve the forests in Indonesia. These forests have a mega biodiversity status in the tropical zone
and hence their protection is important, not only for the country but also for the earth’s sustainability. This law, accompanied by the hard efforts of the Ministry of Forestry in suppressing the forest degradation, has resulted in diminishing the rate of forest
degradation to about 1.08 million ha for the last three years from its level of about 2.8 million ha in the 1990s (Kusmana, 2011).
The planning in this research is intended to be sustainable, and thus the regulatory status of these forests must be considered. For this reason, the areas that can be used for farming, including for cashew plantations, only include those of the ‘Area for Other Uses’ status in FAS. In a more detailed description, ‘Area for
Other Uses’ means an area which is not oficially included in other
types of FAS such as protected forest, research forest, national park as well as production forest area. In the case of Lombok Island, this ‘Area for Other Uses’ includes 295,140.9 ha.
It should be noted, however, that actually, maps of FAS are
Fig. 4. Map of (a) the land use and land cover, interpreted from SPOT-6 imagery, and of (b) the soil class up to sub-group categories in the areas outside of Forest Area Status (Widiatmaka et al., 2013, 2014b)
A B
No Land Use/Land Cover Area No Soil Sub-Group Area
ha % ha %
1 Forest 123,687.8 27.1 1 Lithic Udivitrands 651.7 0.6
2 Mangrove forest 755.4 0.2 2 Typic Durustepts 10,242.2 9.9
3 Built area 110 0 3 Typic Endoaquents 1,615.4 1.6
4 Bare land 38.6 0 4 Typic Endoaquepts 312.6 0.3
5 Grass land 9,639.7 2.1 5 Typic Eutrudepts 25,915.7 25.0
6 Sand 785.8 0.2 6 Typic Fluvaquents 106.5 0.1
7 Plantation 51,738.5 11.3 7 Typic Fragiudepts 12,005.4 11.6
8 Settlement 20,855.6 4.6 8 Typic Haplocalcids 4,108.0 4.0
9 Irrigated paddy ield 106,248.0 23.3 9 Typic Hapludalfs 26,674.0 25.8
10 Rainfed paddy ield 21,524.4 4.7 10 Typic Haplustalfs 4,094.9 4.0
11 Shrub 58,335.7 12.8 11 Typic Hidraquents 979.9 0.9
12 Pond 36.9 0 12 Typic Udorthents 16,277.5 15.7
13 Dry land agriculture 57,891.6 12.7 13 Typic Ustipsamments 538.6 0.5
14 Water body 5,226.5 1.1 Total 103,522.4 100
Total 456,874.6 100
Table 2. Area distribution of Lombok Island according to (A) land use and land cover, interpreted from SPOT-6 imagery, and (B) soil class up to sub-group category in the area outside of Forest Area Status (Widiatmaka et al., 2013, 2014b)
available throughout Indonesia only at a scale of 1:250,000. Therefore, using such a small-scale map in this study, delineation had to be carefully viewed and only at the planning level.
Operational use in the ield concerning forest boundaries needs
to be detailed in coordination with the Ministry of Forestry.
Allocation in oficial spatial land use plan: Planners should refer
to the OSLUP, according to Law No. 26/2007. The map of OSLUP
is presented in Fig. 5b and Table 3B. According to OSLUP, the areas that are allocated as cultural areas include 60.8% of the
island area, and consist of plantation, agricultural and settlement
areas. The rest, 39.2% of the area, is allocated as non-cultural
areas, which include protected areas, natural resources-preserved areas, production forest areas and water bodies. The areas that can still be used for cashew expansion are the plantation areas and the agricultural areas. On Lombok Island, the total area of
these two areas is 273,537.1 ha.
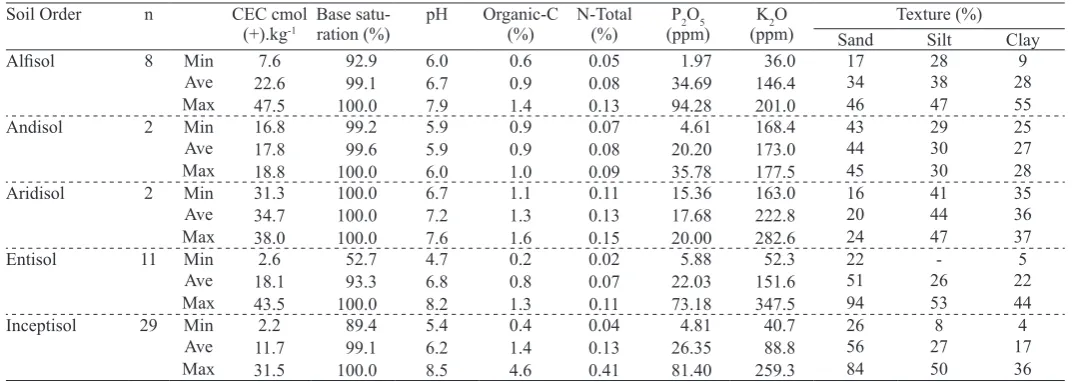
Land Suitability: The results of the soil analysis, used as land
qualities and land characteristics in land evaluation are presented
in Table 4, with only the analysis summary presented. The actual and potential land suitability maps were presented only in the areas that are allowed to be used for agricultural purposes according to FAS and OSLUP.
The results of the land suitability analysis show that the land suitability classes for cashews range from S2 (moderately suitable) to N (not suitable). In terms of actual land suitability, the total amount of
suitable land for cashews (class S2 and S3) is 61,214.2 ha, consisting of 22,242.8 ha of S2 class and 38,971.4 ha of S3 class.
The land qualities that cause land to be as S2 class are those
of water availability (w), nutrient retention (f), and available
nutrients (n). For the land quality of water availability, the land
characteristics that become limiting factors are rainfall and number of dry months. Lombok Island has a very wide range of climates, the rainfall ranges from very low to very high. Research indicates that climate factors relate to moisture availability variation in soil (Tolla, 2004). Management and soil moisture regimes are factors that determine the cashew plant’s yield variability (Rejani and Yadukumar, 2010), the temporal variation of available soil moisture explained the yield variability of the cashew nuts. Gopakumar et al. (2005) also indicated that there was a decline in cashew productivity due to the warmest and drought conditions as a result of a decline in rainfall and an increase in temperature.
The dry season is generally coincides with cashew lowering and nut development, when crop water requirements reach maximum
values, and so, low nut yields are commonly associated with years of low rainfall (Oliveira et al., 2006).
Fig. 5. Maps of (a) forest areas, according to the map of Forest Area Status (Forestry Planology Agency, 2002), and of (b) Official Spatial Land Use Plan (Government of West Nusa Tenggara Province, 2010)
Table 3. Distribution of (A) forest areas, according to the map of Forest Area Status (Forestry Planology Agency, 2002), and of (B) Official Spatial Land Use Plan (Government of West Nusa Tenggara Province, 2010)
A B
No Forest Area Status Area No Oficial Spatial Land Use Plan Area
ha % ha %
1 Protected forest 70,798.2 15.5 1 Protected area 103,814.5 22.7
2 Research forest 364.8 0.1 2 Natural resources preserved area 40,421.4 8.8
3 National park 34,057.5 7.5 3 Production forest area 32,611.3 7.1
4 Natural tourism park 6,804.5 1.5 4 Plantation area 139,673.8 30.6
5 Community plant forest 209.2 0 5 Agricultural area 133,863.3 29.3
6 Production forest 30,096.1 6.6 6 Settlement 3,925.5 0.9
7 Limited production forest 17,547.3 3.8 7 Water/water park 2,564.9 0.6
8 Area for other uses 295,140.9 64.6 Total 456,874.6 100
9 Water 1,856.2 0.4
Total 456,874.6 100
For land quality of nutrient retention (f), the determining land characteristics can be the soil’s Cation Exchange Capacity (CEC), its base saturation, its C-organic content and its pH (Table 1).
The analysis results indicate that the dominant limiting factor for
cashew growth on Lombok Island is a low soil CEC. There was only one sampling point that had too high pH, and two sampling points that had too low a quantity of C-organic content as limiting factors and putting this land into the S2 class. However, there was
not a sampling point that indicated the soil’s base saturation as a
limiting factor. On Lombok Island, the soil’s CEC generally is not high enough to enter into class S1 for cashews. The pH appeared to be a limiting factor for assigning the land to the classes of S3 and N for cashews. A high pH can be a serious limiting factor and even make the land not suitable (N) for cashews. However, a too low pH could be a limiting factor for cashews as well.
Ngatunga et al. (2003) observed that continued use of sulphur on the Makonde plateau is likely to result in a decline of the soil pH,
which affects the cashew nut production. Furthermore, Owaiye and Olunloyo (1990) reported that the best growth of cashews is
obtained between the pH ranges of 4.5 and 5.0, a pH of 4.5 being
optimal. The similar tendency has been found in whole Nusa
Tenggara Province by Widiatmaka et al. (2014a)
For the land quality of available nutrient (n), the land characteristics
that were taken into account were nitrogen (total-N), phosphorous (available-P) and potassium (exchangeable-K). The analysis results indicated that the land characteristics that limit cashew growth from being in the S2 class on Lombok Island were generally total-N. There was only one point sample that had a low value of P2O5, making these samples S2 class, and there were no
samples that showed exchangeable-K as a limiting factor. Even in classifying the land as S3 or N class, exchangeable-K remained
not a limiting factor. The soil on Lombok Island appears to have
suficient K2O levels for the growth of cashews. For classifying
S3 and N classes, the total N together with P2O5 content appear
to be limiting factors. The research of O’Farrel (2010) showed that high yields of cashew nuts can be achieved from intensively managed trees. This was achieved when N was applied at the rate of 17 g N/m2. The timing of N fertilizer is critical, and should
be applied during the main vegetative growth period. Nitrogen appears necessary during the vegetative phase of the cashew tree. Application of a high-nitrogen fertilizer was responsive in this vegetative phase.
In cashews, phosphorus is an essential component of the genetic material of the cell nucleus. Phosphorus deficiency causes stunting, delayed maturity, and shriveled seeds (Thompson
and Troeh, 1978; Aikpokpodion et al., 2009; Widiatmaka Table 4. Results of the soil analysis used as land characteristics for land evaluation for cashew plants
Soil Order n CEC cmol
Table 5. Land suitability for cashew plants on Lombok Island: (a) actual land suitability, and (b) potential land suitability No Actual Land Suitability
Sub-Class
Area No Potential Land Suitability Area
ha % ha %
1 S2-f 3,276.8 0.7 1 S1 4,075.6 0.9
2 S2-wf 2,233.5 0.5 2 S2-w 18,167.3 4.0
3 S2-wn 566.4 0.1 3 S2-f 149.9 0.0
4 S2-fn 798.7 0.2 4 S2-n 1,993.2 0.4
5 S2-wfn 15,367.4 3.4 5 S2-fn 210.9 0.0
6 S3-f 149.9 0.0 6 S3-r 36,617.4 8.0
7 S3-n 1,993.2 0.4 7 S3-f 4,611.4 1.0
8 S3-r 32,251.0 7.1 8 N 39,710.7 8.7
9 S3-rf 2,149.7 0.5 9 na 351,338.3 76.9
10 S3-rn 2,216.7 0.5 Total 456,874.6 100.0
11 S3-fn 210.9 0.0
12 N 44,322.1 9.7
13 na 351,338.3 76.9
Total 456,874.6 100.0
et al., 2014a). Ibiremo et al. (2012) reported that the rock
phosphate treatment signiicantly improved nut sizes in Ibadan soil. Additionally, Sathiyamurthi (2013) indicated the need of
improving the soil’s phosphorus in cashew orchards’ soil.
In the S3 class, the land qualities that become limiting factors are
rooting media (r), nutrient retention (f), and available nutrients
(n). Land qualities that determine an N class are rooting media (r) and nutrient retention (f). For the S3 and N classes, other than the limiting factors of pH, total-N and P2O5, the soil texture emerges
as the dominant limiting factor. This result shows that cashew is not tolerant to poor soil drainage. Previous studies indicated that
soil texture is critical for cashew production (Duncan, 2001).
Cashew production relates to well-drained soil with a sandy
loam texture (Duncan, 2001). Cashews seem to lourish in a free-draining and light-textured soil (Widiatmaka et al., 2014a).
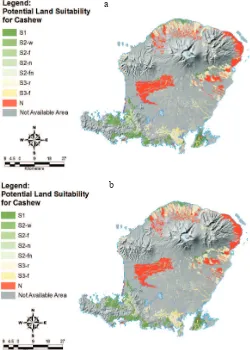
Land suitability can be deined as actual land suitability and
potential land suitability (FAO, 1976). Potential land suitability is land suitability when limiting factors in actual land suitability
are improved (FAO, 1976). However, several limiting factors are
permanent as some soil textures cannot be improved. On Lombok Island in general, the improvement of actual land suitability to become potential land suitability increases the extent of the suitable area by only a small amount. The total actual suitable
land is 61,214.2 ha (58% of land being assessed for its suitability), while the total potential suitable land is 65,825.7 (62% of land
being assessed for its suitability) (Table 5 and Fig. 6). This is because the good land on Lombok Island has mostly been cultivated for planting cashews.
Area priority for cashew expansion: Land availability for cashew expansion areas was analyzed using a matrix of land use allocation (Table 6). In this allocation matrix, according to FAS, the only available land for cashew development planning fell
under Area for Other Uses forest status. Based on the OSLUP,
the lands that allowed for cashew development were agricultural
and plantation areas. Based on the existing land use, land that can
be developed is land in which the current land use/land cover is bare land, shrub, and dryland agriculture. Forest and mangrove forests are not recommended to be used in order to protect the environment. Law No. 26/ 2007 contains a provision that in any
region, at least 30% of the area should be forest area. In the case of Lombok Island, the current forest cover is 124,443 ha, or only 27.3%, although based on the FAS, the forest area is 159,878 ha or 35%. The existing forest land cover must be maintained so as
not to be used for cultivation. The existing plantation is also not suggested in the calculation of the area that can be used for the expansion. Pasture is not recommended for cashew development because Lombok Island is also a breeding area in Indonesia,
which requires suficient sources for animal feed. Paddy ields, both irrigated and rainfed paddy ields are not recommended
for use for food security reasons. Thus, in this case of cashew
expansion, there was an area of 103,522.4 ha, taking FAS, OSLUP
and existing land use into account for the available land for agricultural development.
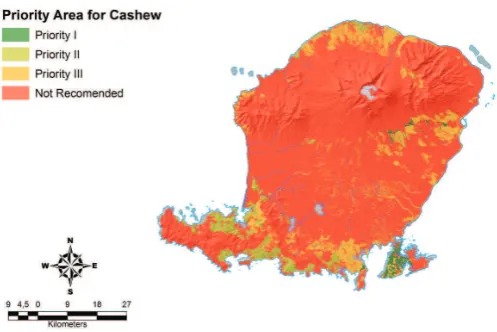
Prioritizing the land utilization for cashew plantations is based on land suitability for cashews. First priority is given to land with potential land suitability for cashews S1, second priority is given to land with potential land suitability for cashews S2, and third
priority is land with potential land suitability for cashews S3.
Land with N potential land suitability for cashews is not suggested
to be used for cashew development. With this analysis, an area of
4,075.6 ha can be assigned as priority I for cashew extension, a
land area of 18,167.3 ha can be assigned as priority II, and a land Table 6. Matrix of land use allocation for cashew expansion area
Land Use/Land Cover Oficial Spatial Land Use Plan Forest Area Status Land Suitability Land Use Recommendation Bare Land, Shrub, Dryland
Agriculture
Plantation Area, Agricultural Area
Area for Other Uses S1 Priority I
S2 Priority II
S3 Priority III
N Not recommended
Forest, Mangrove Forest, Grassland, Sand, Plantation, Settlement, Irrigation Paddy Field, Rainfed Paddy Field, Pond, Water Body
Protected Area, Natural Area, Production Forest Area, Settlement Area, Water
Protected Forest, Production Forest, Limited Production Forest, National Park, Natural Park, Community Forest Plant, Research Forest, Water
Not recommended Fig. 6.Map of land suitability for cashew: (a) actual land suitability, and
(b) potential land suitability
a
area of 43,582.8 ha can be assigned as priority III. Thus, in total
on Lombok Island, the extension of cashew can be developed in
the total potential area of 65,825.7 ha (Table 7 and Fig. 7). Based on the concept of economic land suitability (FAO, 1985;
Rossiter, 2001), land suitability class S1 has the potential to
produce 80 to 100% of the maximum production; land suitability class S2 has the potential to produce 60 to 80% of the maximum production. Land suitability class S3 has the potential production of 24 to 60% of the maximum production (Widiatmaka et al.,
2014a). When referring to the highest production potential in Nusa Tenggara, based on the data of Statistics Indonesia (2013b) that is 367 kg ha-1 at the maximum production rate, so if using
a lower limit on the production of each class of land suitability, additional potential production will be obtained from lands of
S1, S2 and S3, respectively, with the potency of 1,196 tons.year-1
on land S1, 4,000 tons year-1 on S2 land and 3,838 tons year-1 in
S3 land, or a total additional production of 9,036 tons year-1. As
information, the actual production of cashew in Lombok Island
is 3,116 tons year-1 (Statistics of West Nusa Tenggara Province,
2013). This rough estimation can be added to the potential use
of the degraded forest land, which may also be used for the plant
because cashew nut is one of the greening plants (Hadad et al.,
2008). However, it is necessary for other more detailed analysis.
The analysis presented is the potency of Lombok Island from point of view of land suitability and land availability. Certainly for the realization, many other parameters still need to be considered, one of them being the use of land for other commodities. According to the land tenure regime in Indonesia, the land is
owned (with legal certiicate) by individuals, by entities, or by
the State. The ability to use land owned by individuals or entities would depend on the owners’ economic interest. The analysis from this point of view is not included in the scope of this article;
however, such consideration can be used for further land use planning and analysis.
Finally, it can be highlighted that the analysis in this research, conducted on the small island of Lombok, Indonesia has been performed by taking into account the available land for agriculture
in terms of forest area status, oficial spatial land use planning
and existing land utilization. Taking into account such factors is important, considering that land is a non-renewable resource which is needed by many sectors. Our research calculates that there
was 103,522.4 ha of available land. From this available land, the
actual suitable land with different suitability classes for cashews could then be delineated using land suitability analysis; in this case it was 61,214.20 ha. The choice of cashew is guided by the
fact that this plant meets the requirements for sustainable use in a
small island in terms of ecology and economy as well as the needs of the population. From the land suitability analysis, the limiting factors for cashew development were obtained by analysing the data from soil characteristics resulting from a soil survey. These consist of the land characteristics of water availability (based on rainfall and dry months in several regions), nutrient retention
(soil CEC and soil pH), nutrient availability (total N and P2O5
content) and rooting media (soil texture). Several limiting factors can be improved to increase the number of suitable land areas for cashews. The priority area for cashew expansion was then established according to its potential land suitability. In total, an
area of 65,825.7 ha with different classes of land suitability for cashews can be recommended. With the addition of these cashew
areas, the potential cashew production from this island can increase. The preciseness of this mapping methodology has to be also taken into consideration. This research used different maps at various precisions; the soil map and topographical map were at a scale of 1:25,000, while the land use was interpreted using SPOT-6 imagery at a precision of 2.5 m. Through this interpretation, the
obtained result can be deined as operational for land use planning
at a middle scale of 1:25,000. Since however, the OSLUP map used was scaled at 1:100,000 and the FAS map at 1:250,000, the
inal results received should be viewed cautiously. The uncertainty
at the middle scale land use planning may be derived from these
two maps. Consequently, more attention and consideration have to be given to the border of the forest as well as the oficial land
use plan border when the results for the middle scale land use planning are used for operational purposes.
The research steps shown in this paper can act as a step-by-step guide for other areas. It is important to note the importance of selecting suitable land, and on the other hand, to take into account
the available land according to oficial regulation of land use
planning.
Acknowledgement
The inancial support for this research was given by Geospatial
Information Agency, Indonesia, through the program of Multisector Land Suitability and Land Capability Mapping during
inancial year of 2013.
References
Aikpokpodion, P.E, B. Uloko and G. Edibo, 2009. Nutrient dynamics in soil and cashew (Anacardium occidentale L.) leaf and kernel in Kogi State, Nigeria. J. Appl. Biosci., 25: 1573-1578.
Table 7. Area priority of cashew expansion on Lombok Island
No Use direction for cashew Area
ha %
Akinci, H., A.Y. Ozalp and B. Turgut, 2013. Agricultural land use suitability analysis using GIS and AHP technique. Comp. Electr. Agr., 97: 71-82.
Bell, L.W. 2013. Economics and system applications for perennial grain crops in dryland farming systems in Australia. FAO Expert Workshop on Perennial Crops for Food Security, Rome, 28-30 August 2013.
Cushnahan, G. 2001. Resource use and tourism on a small Indonesian island. Tourism Recreation Res., 26(3): 25-31.
Daras, U. 2007. Strategy and innovation of technology to increase cashew productivity in Nusa Tenggara (Indonesia). J. Agric. Res. Dev., 26 (1): 25-34. (in Indonesian)
De la Rosa, D. and C.A. van Diepen, 2002. Qualitative and quantitative land evaluation. In: Land Use and Land Cover, Encyclopedia of Life
Support System (EOLSS-UNESCO), W. Verheye (ed.), Eolss Publ.,
Oxford. p.1-20.
Directorate General of Plantation, 2014. Development of Area Plantations 2008-2013. Directorate General of Plantation, Ministry
of Agriculture (in Indonesian).
Duncan, I.E., 2001. A review of the potential for development of cashew production in Zona Paz region, Guatemala, Central America. AGIL PROGRAM (Apoyo a la Generacion de Ingresos Locales), US Aid/Guatemala CAP income Generation Activities in Rural Areas, Guatemala City, Guatemala.
Fauzi, A. and A. Oxtavianus, 2014. Measuring sustainable development in Indonesia. Mimbar, 30(1): 42-52 (in Indonesian).
Feizizadeh, B. and T. Blaschke, 2012. Land suitability analysis for Tabriz County, Iran: a multi-criteria evaluation approach using GIS. J. Environ. Planning Mgt., 4: 1-23.
Food and Agriculture Organisation (FAO), 1976. A framework for land evaluation, Soils Bull., 32. Food and Agriculture Organization, Rome.
Food and Agriculture Organization (FAO), 1985. Guidelines: Land evaluation for irrigated agriculture, Soils Bull., 55. Food and Agriculture Organization, Rome
Food and Agriculture Organization (FAO), 2011. Major Food and Agricultural Commodities And Producers-Countries By Commodity.<http://www.FAO.org>.
Forestry Planning Agency, 2002. Designation Map of Forest and Water Area. Forestry Planning Agency, Indonesian Ministry of Forestry. Gopakumar, C.S., G.S.L.H.V.P. Rao and P.B. Pushpalatha, 2005. Effect
of dry spell on cashew production in the humid tropics. (Proc. Nat. Workshop Drought Mgt. Plantation Crops).
Government of West Nusa Tenggara Province, 2010. Regional Regulation on Oficial Spatial Land Use Planning of West Nusa Tenggara Province 2009-2029. <http://www.penataanruang.com/ nusa-tenggara-barat1.html>
Hadad, M., S. Wahyuni, N. Bermawie and U. Rasiman, 2008. Cashew Segayung Muktiharjo-9 (SM-9) Variety. Indonesian Spice and Industrial Crops Institute. <http://en.litbang.pertanian.go.id/200/ industrial-plant/jambu-mete-segayung.pdf>
Hallam, A., I.C. Anderson and D.R. Buxton, 2001. Comparative economic analysis of perennial, annual and intercrops for biomass production. Biomass and Bioenergy, 21(6): 407-424.
Kusmana, C. 2011. Forest resources and forestry in Indonesia. Forest Sci. Technol., 7(4): 155-160.
Lallianthanga, R.K. and R.L. Sailo, 2013. Land use planning for sustained utilization of resources using remote sensing and GIS techniques: a case study in Mamit District, Mizoram, India. Amer. J. Eng. Res., 2(11): 216-222.
Lambin, E.F. 2012. Global land availability: Malthus versus Ricardo.
Global Food Security, 1: 83-87.
Ma, S., J. He, F. Liu and Y. Yu, 2011. Land-use spatial optimization based on PSO algorithm. Geospatial Info. Sci., 14(1): 54-61.
Nair, K.P.P. 2010. The Agronomy and Economy of Important Tree Crops of the Developing World. Elsevier, p. 21-66.
Nair, N.U., K.M. Nair, S. Meti, D.V.K.N. Rao, B. Chandy and L.G.K. Naidu, 2010. Land and soil controls over the spatial distribution and productivity of rubber (Hevea brasiliensis) in Southern India.
Soil Solutions for a Changing World: Proceedings of the 19th World Congress of Soil Science, 1-6 August 2010, Brisbane, Australia.
Published on DVD.
Ngatunga, E.L., S. Dondeyne and J.A. Deckers, 2003. Is sulphur acidifying cashew soils of South Eastern Tanzania? Agric. Ecosystems Environ., 95: 179-184.
O’Farrell, P., J. Armour and D. Reid, 2010. Nitrogen use for high productivity and sustainability in cashew. Scientia Hort., 124: 19-28.
Oliveira, V.H., F.R. Miranda, R.N. Lima and R.R.R. Calvante, 2006. Effect of irrigation frequency on cashew nut yield in Northeast Brazil. Scientia Hort., 108: 403-407.
Owaiye, A.R. and O.A. Olunloyo, 1990. The effect of NPK fertilizer combinations on incidence of inlorescence blight disease of cashew at Ochaja. Annual Report of Cocoa Research Institute of Nigeria. Pelling, M. and J.I. Uito, 2001. Small island developing states: natural
disaster vulnerability and global change. Environ. Hazards, 3(2):
49-62.
Rao, E.V.V.B. 2013. Integrated Production Practices of Cashew in India, FAO Corporate Document Repository,<http://www.fao.org/ documents/en/detail/67653>
Reenberg, A., T. Birch-Thomsen, O. Mertz, B. Fog and S. Christiansen, 2008. Adaptation of human coping strategies in a small island society in the SW Paciic-50 years of change in the coupled human-environment system on Bellona, Solomon Islands. Human Ecol.,
36: 807-819.
Rejani, R. and N. Yadukumar, 2010. Soil and water conservation techniques in cashew grown along steep hill slopes. Scientia Hort., 126(3): 371-378.
Ritung, S., Wahyunto, F. Agus and H. Hidayat, 2007. Land Suitability Evaluation Guide with Sample of Land Use Map of West Aceh Regency. Soil Research Institute and World Agroforestry Center
(in Indonesian).
Rossiter, D.G. 2001. ALES’s Home Page, Documentation and Software for the Automated Land Evalu ation System (ALES) expert system framework, <http://www.css.cornell.edu/landeval/ales/ales.htm> Rupa, T.R., R. Rejani and M.G. Bhat, 2013. Impact of Climate Change on
Cashew and Adaptation Strategies. p.189-198. In: Climate-Resilient Horticulture: Adaptation and Mitigation Strategies, H.C.P. Singh,
N.K.S. Rao, K.S. Shivashankar (eds.). Springer India.
Salazar-Ordonez, M., M. Rodrıguez-Entrena and S. Sayadi, 2013. Agricultural sustainability from a societal view: an analysis of Southern Spanish Citizens. J. Agric. Environ. Ethics, 26: 473-490.
Soil Survey Division Staff. 1993. Soil Survey Manual Soil Conservation Service. U.S. Department of Agriculture Handbook 18.
Soubbotina, T. 2004. Beyond Economic Growth: An Introduction to
Sustainable Development. The World Bank. Washington DC, 2nd
edition.
Standard National Indonesia (SNI), 2010. Land Cover Classiication,
SNI No. 7645: 2010. Indonesian National Standardization Agency. Statistics Indonesia, 2013a. Area of Extensive Plantation Crops by Kind
of Plants, Indonesia 1995 – 2013. Indonesian Statistical Bureau.
Statistics Indonesia, 2013b. Plantation Production by Province and Type of Plant. Indonesian Statistical Bureau.
Statistics of East Lombok Regency, 2012. East Lombok in Figs 2012. English Statistical Bureau.
Sutandi, A. and B. Barus, 2007. Modeling land suitability of Turmeric crop, J. Soil Env., 9(1): 20-26.
Tan, K.H., 2009. Environmental Soil Science. CRC Press, New York. The World Bank, 2014. Population Growth (annual %). <http://data.
worldbank.org/indicator/SP.POP.GROW>
Tolla, T.D., 2004. Effect of moisture conditions and management on production of Cashew: a case study in lower Limpopo, Mozambique.
Thesis. International Institute for Geo-Information Science and Earth
Observation, Enschede, the Netherlands.
United Nations General Assembly (UNGA), 1994. Report of the global conference on the sustainable development of small island developing states. Bridgetown, Barbados, 25 April-6 May 1994, Document A/CONF.167/9.
United States Department of Agriculture (USDA), 2010. Keys to Soil Taxonomy, United States Department of Agriculture.
Widiatmaka, W. Ambarwulan, S.L. Munajati, K. Munibah, K. Murtilaksono, R.P. Tambunan, Y.A. Nugroho, P.B.K. Santoso, Suprajaka, Nurwadjedi, 2013. Spatial planning of increasing soyabean production based on land suitability in East Lombok Regency, West Nusa Tenggara Province. Globe, 15(2): 161-169 (in Indonesian).
Widiatmaka, A. Sutandi, U. Daras, M. Hikmat and A. Krisnohadi, 2014a. Establishing land suitability criteria for cashew (Anacardium occidendale L.) in Indonesia. Appl. Environ. Soil Sci., 2014: 1-14. Widiatmaka, W. Ambarwulan, R.P. Tambunan, Y.A. Nugroho, Suprajaka,
Nurwadjedi and P.B.K. Santoso, 2014b. Land use planning of paddy ield using geographic information system and land evaluation in West Lombok, Indonesia. Indonesian J. Geogr., 45(1): 89-98.
World Commission on Environment and Development (WCED), 1987.
Our Common Future. Oxford University Press. New York.