DOI: 10.12928/TELKOMNIKA.v11i3.1056 563
Wireless Sensor Network for Forest Fire Detection
M. Y. Hariyawan1, A. Gunawan 2, E. H. Putra*3 Department of Electrical Engineering, Politeknik Caltex Riau
Jalan Umban Sari No 1 Pekanbaru, Telp. (0761) 53939
*Corresponding author, e-mail: [email protected], [email protected], [email protected]
Abstrak
Kebakaran hutan merupakan salah satu masalah yang mengancam kelestarian hutan. Sistem pencegahan dini untuk indikasi kebakaran hutan sangat diperlukan. Luasnya hutan menjadi salah satu masalah yang dihadapi dalam pemantauan kondisi hutan. Untuk mengatasi masalah ini, dirancang suatu sistem deteksi kebakaran hutan dengan mengadopsi Jaringan Sensor Nirkabel (Wireless Sensor Network) menggunakan beberapa node sensor. Setiap node sensor memiliki mikrokontroler, pemancar/penerima dan tiga sensor. Metode pengukuran dilakukan dengan mengukur suhu, api, tingkat metana, hidrokarbon, dan CO2 di beberapa kawasan hutan dan mengukur pembakaran gambut di sebuah simulator. Dari hasil pengukuran suhu, kadar metana, gas hidrokarbon dan CO2 di daerah terbuka menunjukkan tidak ada tanda-tanda kebakaran karena nilai suhu, metana, gas hidrokarbon, dan CO2 adalah di bawah pengukuran di ruang simulator.
Kata kunci: deteksi kebakaran hutan, jaringan sensor nirkabel, node sensor
Abstract
Forest fires are one of problems that threaten sustainability of the forest. Early prevention system for indications of forest fires is absolutely necessary. The extent of the forest to be one of the problems encountered in the forest condition monitoring. To overcome the problems of forest extent, designed a system of forest fire detection system by adopting the Wireless Sensor Network (WSN) using multiple sensor nodes. Each sensor node has a microcontroller, transmitter/receiver and three sensors. Measurement method is performed by measuring the temperature, flame, the levels of methane, hydrocarbons, and CO2 in some forest area and the combustion of peat in a simulator. From results of measurements of temperature, levels of methane, a hydrocarbon gas and CO2 in an open area indicates there are no signs of fires due to the value of the temperature, methane, hydrocarbon gas, and CO2 is below the measurement in the space simulator.
Keywords: forest fire detection, wireless sensor network, sensor node
1. Introduction
Forests constitute a source of life for all living things. With the forest, symbiosis, and the chain can run our life. Wildfires are a serious problem facing today. It has been felt by the public and government. Land and forest fires in Riau province has a considerable effect on the occurrence of haze pollution across state boundaries. In general, fires in Riau province in peatlands dominate the region by 60%. Therefore smog constitutes natural phenomenon that commonly occurs during fire season and have an impact on neighboring countries such as Malaysia and Singapore.
To reduce this problem, the government has launched several programs oriented to an appeal or a legal sanction against any action that threatens the sustainability of the forest. However, although the entire work program has been designed, the forests still shows a pretty poor [1].
1.1. Wireless Sensor Network (WSN)
Wireless Sensor Network (WSN) is a unit of the measurement process, computing, and communications that provide administrative capabilities to a device, observation, and any treatment for any events and phenomena that occur in the environment using wireless technology. This system is much more efficient than the use of cables. This system has a function for various types of applications. WSN technology provides the foundation to conduct experiments on the environment. For example, biologists want to monitor the behavior of animals in their habitat, environmental researchers require a system capable of monitoring environmental pollution, farmers can increase yields by examining soil fertility, geologists need a system to monitor seismic activity, even in the military also needs a system that able to monitor areas that are difficult to achieve. Overall human activities require monitoring WSN systems.
In some of the literature related to the implementation of WSN that uses a multi-sensory, developed many robots [4] [5]. In 1989 [6], suggests the importance of the development of multisensor to improve intelligent systems. Multisensor applications in robotics, biomedical systems, monitoring equipment, remote sensing and transport systems described [7] in 2002. David L. Hall and James Llinás explain theoretical introduction to multisensor fusion of data [8]. They provide tutorials on data fusion, the data fusion applications, process models, and the identification of application engineering, which aims to show how the sensor fussion measure to get results. They also show a flow chart to explain the different ways to connect multiple sensors in one device. In [9] multisensor is used for monitoring welding in the automotive industry, with a multi-sensory, it is possible to measure current, voltage and power welding. The use of multisensor also can be seen in [10], who designed a light-addressable potentiometric sensor (laps) as the realization of portable multisensor device. The light source and electronic oscillator include multiplexer, pre-amplifier and a high-pass filter.
WSN components include sensors, wireless modules, and PC. All components will form a monitoring system that is able to display the data in the form of sensor characteristics are used to take advantage of wireless media. Because it can be used to share applications, use sensor type selected based on application.
Table 1. Type of Sensors
Type of Sensors Sensor
Temperature Thermistor, thermocouple
Pressure Pressure gauge, barometer, ionization gauge Optic Photodiodes, phototransistors, infrared sensors, CCD
sensors
Acoustic Piezoelectric resonators, microphones
Mechanical Strain gauges, tactile sensors, capacitive diaphragms, piezoresistive cells
Movement and Vibration Accelerometers, gyroscopes, photo sensors
Position GPS, ultrasound-based sensors, infrared-based sensors, inclinometers
Humidity Capacitive and resistive sensors, hygrometers, MEMS-based humidity sensors
Radiation Ionization detectors, Geiger–Mueller counters
1.2. Wireless Sensor Network Architecture
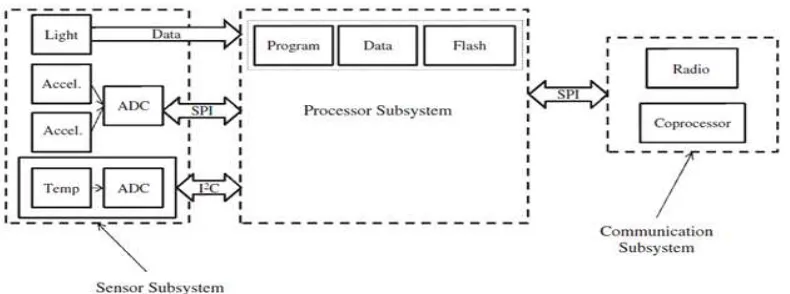
Each node WSN systems generally consist of sensing, processing, communication and power that can be illustrated as in Figure 1. How to combine this is the thing to watch out for when we do the designing. The system processor is the most important part of the WSN system that can affect the performance or energy consumption. Several options for the processor may choose include:
Microcontroller
Figure 1. General architecture of a WSN
A. Uvtron Flame Detector
Flame sensor is used to detect the presence of fire that indicate a fire. In planning to use fire sensor made Hamamatsu type R2868. This form of communicating sensor circuit C3704 kit that is onboard, as shown in Figure 2. This sensor will detect UV light in the 185-260 nm interval detected as UV light from the fire. These sensors are not able to detect the size of the fire, because basically the cigarette at a distance up to 5 meters can be detected by these sensors. In realization, flame sensor is activated when the rated voltage of 350 Vdc, so it is necessary to activate C3704 kit. The input voltage required for this kit C3704 9-30 Vdc range, but if we have a fixed voltage of 5 volts, we simply menginputkannya to terminal 'O' on the kit because basically the input voltage of 9-30 Vdc earlier will be diregulator be 5 volts.
Figure 2. Block circuit C3704.
The working principle of this series of kit C3704 is changing the supply voltage of 5 volts to 350 volts DC at the High Voltage DC to DC converter to activate the sensor. While Signal Processing Circuit serves to regulate the amount of incoming pulses from the UVTron sensor for 2 seconds will be responded by the C3704 a pulse width of 10 ms. Output pulses of 10 ms can be coupling the output capacitor to produce a wider period. In planning, it is used by 1 microfarads capacitor to produce an output of 1 second period on terminal Cx C3704 kit.
B. MQ-2 Gas Sensor
MQ-2 sensor also has high sensitivity to LPG, Propane and Hydrogen, and usually areused for methane and flammable vapors and more. MQ2 is suitable for smoke and gas detection, also relatively inexpensive. The physical form of the MQ-2 sensor is shown in Figure 3.
Figure 3. MQ-2 Gas Sensor
C. LM35 Temperature Sensor
LM35 temperature sensor is a transducer that has a function to convert the temperature scale into electrical quantities in the form of voltage. LM35 has high accuracy and ease of design when compared to the other temperature sensor, LM35 also has a low output impedance and high linearity so that it can be easily connected with a series of special control and does not require further adjustment. The temperature can be measured by the IC is quite wide, between -55 C to 150 C. Figure 4 shows the basic circuit LM35.
Figure 4. The Basic Circuit LM35
D. Node Sensor
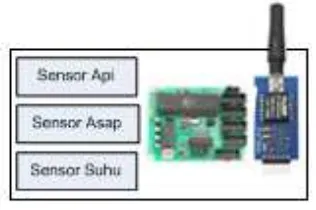
System sensor node consists of 3 pieces of sensors, microcontrollers and RF module KYL 500s, as shown in Figure 5.
Figure 5. Sensor Node
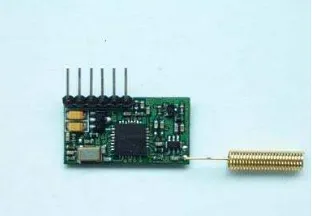
Wireless Data Transceiver. Wireless Data Module KYL 500S transceivers can transmit and receive serial data through the medium of air, with 433/868/915 MHz frequency and baud rate up to 38,400 bps. Use of these modules is quite practical because of the fairly small in size and can be connected directly to the RS232. The module works with supply between 3.3 to 5 VDC. In one module can be used as the sender and receiver. Serial data to be transmitted through the RF module KYL 500S fed to the microcontroller serially. Similarly, the datareceived will be taken by a serial microcontroller. The distance could be gone through about 100 m - 5 Km. Baudrate in the air 1200 bps, 2400 bps, 4800 bps, 9600 bps, 19200 bps, or 38400 bps. Modulation GFSK (Gaussian Frequency Shift Keying) is used so it is anti-interference and BER (Bit Error Rate) is low. The physical form of the RF transceiver KYL 500S module is shown in Figure 6.
Figure 6. KYL 500S Data Transceiver Module
ATMEGA8535 microcontroller serves as the central data processor temperature, smoke and flame which will then be sent to computer through wireless communication channels. At each node there are 3 pieces of sensors are temperature sensors, smoke and flame and RF transceiver module KYL equipped 500s. Circuit at each node is shown in Figure 9.
While the modules that are on the PC as a server are functioning wireless Tx/Rx KYL 500s that function receives the data from the meter and then sent to a computer through a serial cable.
2. Research Method
To detect forest fires then performed measurements of temperature, flame, levels of methane, gasoline, CO and CO2 from the burning peat. There are several scenarios to perform these measurements, namely:
1. Measurement without burning peat in the space simulator
Fire sensing system uses three sensors to detect whether a condition can be considered as early symptom of fire or not. In this fire sensing system used 3 pieces of sensors that will detect fire, smoke and temperature changes. Then the sensing system is put in an enclosed space simulator and temperature measurements, levels of methane, gasoline, CO and CO2 in the space simulator.
2. Measurement of burned peat in the enclosed space simulator
At this stage of peat burned garbage incorporated into the simulator. The results of measurements from three sensors viewed and stored on a computer application program.
3. Measurement of levels of air in the city
At this stage, observation and testing in an open area in the town of Duri to take measurements of temperature, levels of methane, hydrocarbons and CO2 that can be used as an indicator of fire.
4. RF Module Testing
the measurement results obtained will be compared with the results of the calculation RSSI (Received Signal Strength Indication). Sensing system used to perform measurements in the scenario shown in Figure 7.
Figure 7. Measurement of burned peat in the enclosed space simulator
3. Results and Analysis
In Table 2 can be seen results of measurements of temperature, levels of methane, hydrocarbons, CO and CO2 in a simulator without the burning peat. From the results of these measurements the magnitude of temperature, methane, hydrocarbons, CO and CO2 are stable during the process of collecting data and in accordance with normal air conditions.
Table 2. Results of the measurements without burned peat in the enclosed space simulator
Data Temperature
(oC)
Metana (ppm)
Hidrokarbon
(ppm) CO (ppm) CO2 (ppm)
87637 31 1 41 5 97
87638 31 1 41 5 97
87639 31 1 41 5 97
87640 31 1 41 5 97
87641 31 1 41 5 97
87642 31 1 41 5 97
87643 31 1 41 5 97
87644 31 1 41 5 97
87645 31 1 41 5 97
87646 31 1 41 5 97
87647 31 1 41 5 97
87648 31 1 41 5 97
3.1. Measurement of the burning peat in the space simulator
In Figure 8 it can be seen the results of measurements of temperature, and levels of methane for burning peat in the simulator. From the results of temperature measurements, the magnitude of the temperature rose to 34 ° C compared to 31 ° C with no burning peat in the simulator. While methane levels increase dramatically in an average of 7 ppm compared to only 1 ppm without burning peat in the simulator.
Figure 8. Results of measurements of temperature and methane gas levels in the enclosed space simulator
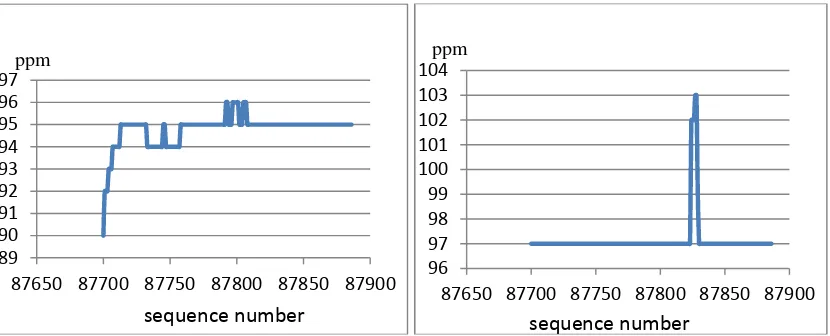
In Figure 9, it can be seen the results of the measurement of hydrocarbon gas and CO2 levels for burning peat in the simulator. From the measurement of hydrocarbon gases increased dramatically to an average of 95 ppm compared to 41 ppm with no burning peat in the simulator. While the average level of CO2 equal to 97 ppm without burning peat in the simulator, although at one point had increased dramatically to 103 ppm.
Figure 9. Results of measurements of hydrocarbon gas and CO2 levels in the enclosed space simulator
From the burning peat in the simulator showed an increase in temperature, levels of methane, a hydrocarbon gas, and CO2 and measurement results can be used as an indicator of the presence of a forest fire.
31.5
87650 87700 87750 87800 87850 87900 oC
87650 87700 87750 87800 87850 87900
Metana
87650 87700 87750 87800 87850 87900
ppm
87650 87700 87750 87800 87850 87900 sequence number
3.2. Measurement of levels of air in the town of Duri
In Figure 10 it can be seen the results of measurements of temperature, and levels of methane in the open area in the town of Duri. From the results of temperature measurements, the magnitude of the temperature rose to 34 ° C compared to 31 ° C with no burning peat in the simulator. While methane levels rise to a point 4 ppm while then back down to 1 ppm with no burning peat in the simulator.
Figure 10. Results of measurements of temperature and methane gas levels in the town of Duri
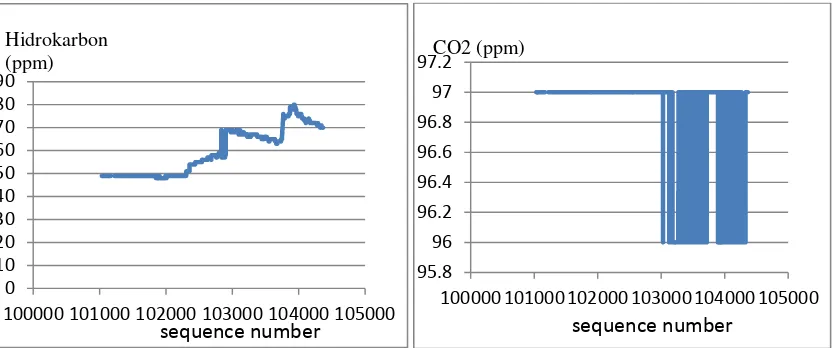
In Figure 11 it can be seen the results of measurements of hydrocarbon gas and CO2 levels in the open area in the town of Duri. From the measurement of hydrocarbon gases increased quite dramatically to 80 ppm compared to 41 ppm with no burning peat in the simulator. While the average level of CO2 equal to 97 ppm without burning peat in the simulator.
Figure 11. Results of measurements of hydrocarbon gas and CO2 levels in the city of Duri
From the results of measurements of temperature, levels of methane, a hydrocarbon gas and CO2 in an open area in the town of Duri shows no signs of forest fires. It can be seen from the values of temperature, methane, hydrocarbon gas, and CO2 are still below the measurement results in a simulator. Although the levels of methane and other hydrocarbon gases considerably higher than normal, but this is more due to the factor of air pollution from heavy vehicles in the town of Duri.
31.5
100000 101000 102000 103000 104000 105000
Methan
100000 101000 102000 103000 104000 105000
Hidrokarbon
100000 101000 102000 103000 104000 105000
CO2 (ppm)
3.3. RF Module Testing
3.3.1. Power Received Measurement
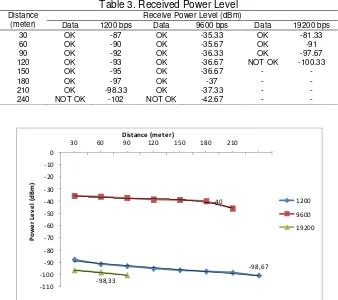
Measurements were performed in order to determine the trend of received power of the distance. Table 3 is the measurement of average power of each node receiver with 3 different baudrate.
Table 3. Received Power Level Distance
(meter)
Receive Power Level (dBm)
Data 1200 bps Data 9600 bps Data 19200 bps
Figure 12. Power Received Measurement
According to the Table III and Figure 12, it can be seen that the average power received at each node will be smaller if the distance is farther away, or it can be said that the quality of data received by the receiver will get worse the longer it along with the distance. Data can be viewed on the received power at node baudrate 1200 bps and 19,200 bps is very small, even including the standard noise (<-80dBm), but due to the sensitivity of the module KYL-200U reached 123dBm, then even such a small power receiver can still receive the data well. As for the baudrate 9600 bps, the received considerable power is still in good quality. In this test, the average maximum transmission distance in a shadowed area of the module is 310 m for baudrate 1200 bps, 230 m for baudrate 9600 bps, and 90 m to 19 200 bps baudrate. It is quite different from the maximum transmission distance of the modules on the condition of LOS (Line Of Sight) listed on the datasheet, which is 1000m.
3.3.2. Power Density Measurement
Figure 13. Power Density Measurement
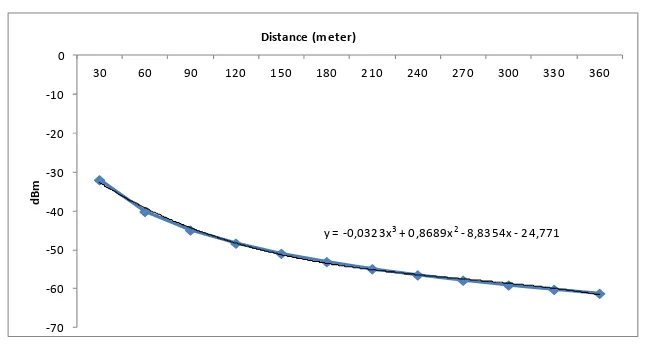
3.3.3. Pathloss Measurement
Based on Figure 14, it can be seen that if the farther anatara Tx and Rx, the greater its pathloss well. This is consistent with the results of measurements of power levels received by Rx can be seen in tables 4.1 and 4.2 as well as 4.6 and 4.7 the previous chart, the greater the distance between Tx and Rx will be smaller then the average power received by the Rx for growing losses that occurred, following th
is
equation , ln ,999.Figure 14. Path Loss Measurement
3.3.4. RSSI (Received Signal Strength Indication) Measurement
Figure 15 explains that the RSSI value generated will be smaller if the distance between the Tx and Rx farther away. Thus RSSI value is inversely proportional to the value of pathloss. RSSI value is obtained in accordance with the data received by the receiver power measurement before, that the greater the distance between Tx and Rx, the smaller the received power. That way, the data obtained from the results of measurements with data RSSI proportional calculation. Just received power nearing the calculated value of RSSI measurement results baudrate is 9600bps. By doing so, baudrate 9600bps are suitable for use in systems designed.
0 50 100 150 200 250
30 60 90 120 150 180 210 240 270 300 330 360
w/
m2
Distance (m)
x 10-7
y = 11,727ln(x) + 56,999
0 10 20 30 40 50 60 70 80 90 100
30 60 90 120 150 180 210 240 270 300 330 360
dB
Figure 15. The RSSI (Received Signal Strength Indication)
4. Conclusion
Temperature measurements, the levels of methane, gasoline, CO and CO2 can be used as a leading indicator for the early detection of forest fires. There are three methods of measurements taken, the measurement in the space simulator with and without burning peat, and measurements in the open air in the town of Duri. From the results of measurements of temperature, levels of methane, a hydrocarbon gas and CO2 in an open area in the town of Duri shows no signs of fires where the value of the temperature, methane, hydrocarbon gas, and CO2 is below the measurement results in a simulator with burning peat.
Average maximum transmission distance RF modules in a shadowed area is 310 m at baudrate 1200 bps, 230 m at baudrate 9600 bps, and 90 m at 19,200 bps baudrate. 5. The sensitivity of the module power is -99 dBm KYL 200U, for minimum power level of the module can still receive the data well is -99 dBm
Acknowledgement
This work is fully support by Ministry of Education and Culture Indonesia under grant “Hibah Bersaing Dikti”. The authors would like to thank to “Kopertis wilayah X” and “Politeknik Caltex Riau” for their support.
References
[1] Tacconi, T., 2003. Kebakaran Hutan di Indonesia, Penyebab, biaya dan implikasi kebijakan. Center for International Forestry Research (CIFOR), Bogor, Indonesia.
[2] Soemarsono, 1997. Kebakaran Lahan, Semak Belukar dan Hutan di Indonesia (Penyebab, Upaya dan Perspektif Upaya di Masa Depan). Prosiding Simposium: “Dampak Kebakaran Hutan Terhadap Sumberdaya Alam dan Lingkungan”. Tanggal 16 Desember 1997 di Yogyakarta. hal:1-14.
[3] Rodzevski, Alexander, 2009, Wireless Sensor Network with Bluetooth, University of Malmö, Sweden. [4] R. C. Luo, M.-H. Lin, and R. S. Scherp, 1988 , “Dynamic multi-sensor data fusion system for
intelligent robots”, IEEE J. Robot. Automat., vol. 4, Aug.
[5] K. Hirai, M. Hirose, Y. Haikawa, and T. Takenaka, 1998, “The development of Honda humanoid robot”. IEEE Int. Conf. Robot. Automat. Vol. 2. Pp.1321-1326.
[6] Ren C. Luo, and Michael G. Kay, 1989, “Multisensor Integration and Fusion in Intelligent Systems”,
IEEE Transactions on Systems, Man, and Cybernetics, Vol.19, No. 5, pp. 901-931.
[7] Ren C. Luo, Chih-Chen Yih and Kuo Lan Su, 2002, “Multisensor Fusion and Integration: Approaches, Applications, and Future Research Directions”, IEEE Sensors journal, Vol. 2, Issue 2. Pp. 107–119. USA.
[8] David L. Hall and James Llinas, 1997, “An Introduction to Multisensor Data Fusion”, Proceedings of the IEEE, Vol. 85, Issue: 1, pp. 6-23, New York, USA.
[9] J.D. Cullen, N. Athi, M. Al-Jader, P. Johnson, A.I. Al-Shamma’a, A. Shaw, A.M.A. El-Rasheed. “Multisensor fusion for on line monitoring of the quality of spot welding in automotive industry”.
Measurement 41 (2008) 412–423.
[10] T. Yoshinobu, M. J. Schöning, R. Otto, K. Furuichi, Yu. Mourzina, Yu. Ermolenko and H. Iwasaki, 2003 , “Portable light-addressable potentiometric sensor (LAPS) for multisensor applications”, Sensors and Actuators B: Chemical, Volume 95, Issues 1-3, pages 352-356.
[11] M. Yanuar H, Arif Gunawan, Hamid Azwar, Bambang H, Arif S, 2011, “Prototype Wireless Sensor Network (WSN) sebagai Sistem Pendeteksi Dini Kebakaran Hutan”, SITIA, vol. 12, hal. 308
[12] Gandhy Senjaya, “Prototype Wireless Sensor Network (WSN) Sebagai Sistem Pendeteksi Dini Kebakaran Hutan Menggunakan Media Wireless (Software)”, Proyek Akhir, Politeknik Caltex Riau, 2011.