24O
Ekayuda et al. MedJ
Univ IndonBone
Mineral
Content
in
a Sample
of Indonesian
Population
Iwan Ekayuda, Sri Pardiastuti
Bhudjono*,
PanduRiono**
Abstrak
Telah dilakukan penerilcsaan CT QCT (Quantitative Conrpured Tonography) pada 223 subiek penelitian yang terdiri dari 164 wanita (rata-rata umur 38,84 tahun) dan 59 pria (rata-rata unur 43 tahun) yang sehat dengan menggunakan pesawat CT-Scan Sonalont - CR(Sienens AG, ErlangenGernany). Digunakanfanton kalibrasi dari Sienens yang terdiri atas 2 konponenyaitu air dan2O0 nghnl Hydroryapatite. Beberapa kesinpulan yang didapat adalah:lnju penurunan kandungan
nineral
tulang nenurut unur pada subiek wanita tidak berjalan honogen, yaitu terjadi percepatan penurunon pada nnsa peri-nenopause; laiu penuru.nan kandungan uineral tulang nenurut untur pada subjek pria berjalan honogen; nilai kandungan ninneral tulang ran-rata pada pria Indonesia pada berbagai kelonpokunwr tidakjauh berbeda denganpenelitian-penelitian di nancanegarasedangkanrpadawanitaunrur 50 tahuniuga tidakjauh berbeda, setelah periode unur tersebut nenunjukkan adanya perbedaan; dan nilai rata-rata kandungan nineral tulang ntenurut untur pada kelompok pria dan wanita berdasarkan nodel regresi,yang sesuai dapat dipertinùangkan sebagai nilai-nilai acuan diIndonesia-Abstract
Quantirative Conryuted Totnography (QCT) was perforned on 223 healthy subjects, cottsisring of 164 fentales (average age 38.84 years) and 59 nnles (average age 43 years), using asonaton - CRCT-Scanner (Sienens AG, Erlangen, Gernnnl,). A Sientens calibration phanton, which is conposed of 2 conponents, water a,td 20O
ng/nl
hydroryapatite, was used. The rate of BMC reductiott with age in thefenale
subjects was found to be notuniforn.
There was accelerated reduction during the perinenopausal period. This rateof
reduction was found to be uniforn in the male subjects. The average BMC of these male Indonesian in the various age groups did trotdffir greatly
from reference values of other countries, as was ako found in the fenrale Indonesiatt subiect up to the age of 50- There was a narkeddisparityfron
other studies in wonen over 50. IJsing the appropriate regression ttndel, these values catr be considered as refe renc e values fo r I ndo nes i ans.Keywords : Quantitative Conputed Tonography, bone nineral content, osteoPorosis
INTRODUCTION
Excessive
lossof
bone mass,or osteoporosis,
leadsto
an
increased
risk of
fractures
from minimal
trauma.Osteoporosis
will
become a
major
health
problem
in
Indonesia
as.the number
of
elderly people
in
thepopulation
increases, theresult of
ademographic
tran-sitional
process.
In
developed countries such as
theUnited
States, osteoporosis
is
considered
to
be
thecause
of L.2
million
fractures
each
year
in
postmehopausal
women.l
It
ir
estimatéd
that
in
theUnited
States,25
7oof
the women over
the ageof
60suffer
from
oneor
more vertebral fractures
causedby
osteoporosis.2There are
2
types
of
osteoporosis,
primary
andsecondary osteoporosis.
Primary
osteoporosis
is
as-sociated
with
advancing
age,and
is usually found in
postmenopausal
women
and
elderly
men.
Secondaryosteoporosis
is
related
to
certain
diseases,the
use ofcorticosteroids, or prolonged
imnrobilization.
Osteoporosis
usually does
not give
symptoms
until
fracture
occurs.Although
bonebiopsy
is themost
accuratequantitative
analysis method
of
determining
the
mineral
content,
it is not routinely
performed
be-causeit
isinvasive
anddifficult. With
advancedimag-ing
techniques,
such as Quantitative
Computed
Tomography (QCT),
it
is possible
to
diagnose
the disease byexamining
theBMC
with
highprecision
andDepartnent of Radiology, Faculry of Medicine, University
d
InConesia, Jakarta, Indonesia*
Radiology llnit, St. Carolus Hospital, Jakarta, IndonesiaVol 3, No 4, October-Decenber 1994
accuracy.
This
technique
is
also simple, noninvasive,
relatively
inexpensive, and
needsonly about l0 -
15minutes to perform.
QCT
is
considered
to be
accurate
in the
early
detection of
bonemineral
loss.2-9Early
changes can be detectedin
the vertebral trabecular
bone,which
has aturn-over
rateof
about 8 times thancortical
bone.2This
is
becausethe vertebral
bodies
is
made
up of 75 To
trabecular
bone.QCT
can measure themineral content
of
trabecular bone
selectively, without
superposition
of the cortical bone
or other tissues. By carefully
choosing the exact site anddirectly
measuring the bonedensity
with
QCT,
it
is possible tominimize
analytical
errors
causedby cortical
bone, osteophytes,sclerosis,
and calcification.Bone mineral analysis
of the
ex-tremities
does
not reflect the mineral
content
of
theaxial skeleton
such as the vertebrae.2There
hasnot
beenmany
studies on osteoporosisin
Indonesia
atthis
time. The
averageBMC
valuesof
Indonesian
and thepattern
of
decline
with
agein
men andwomen
are also notfully
known.
The resultsof this
study will
be
of
inrportance
to other
investigators
of
osteoporosis,
since it is hoped that
reference
valueswill
be obtained
for
various
agegroups
of both
men andwomen.
The
aim
of
this study
is toinvestigate
the averageBMC
and the pattern
of
change
on a sample
of
In-donesian
population
of different
age and
sex.
Com-parisons
will
also be
madeon
theIndonesian
patternof
changeto
thosereported by other
studies.MATERIALS
AND METHODS
Selection
of subjects
This
is a
cross-sectional
study and the
subjectswere selected
from
ahealthy
population
membersof
lhe
Program Jaminan
Pemeliharaan
Kesehatan
(PJPK),
ahealth
insuranceprogram
of
the St.Carolus
Hospital,
Jakarta,
in a
random
proportional
method. Those selectedunderwent
amedical examination. The
exclusion
criteria
were
:-
Prolonged
immobilization,
of at
least2
weeksfor
the pastfew months.
-
Receiving steroids, anticonvulsants,
anti-coagulants, furosemide, orheparin.
-
Receiving hormonal therapy,
including
contracep-tives.-
Conditions such as
hypogonadisnr, menstrual
ir-regularities,
galactorrhoea, premature
ntenopause,or other
hormonal
abnornralities.
-
Malignancies.
-
Malabsorption syndrome.
Bone Mineral
Content 24I
-
Postovariectomy.
-
A
history
of
fractur'eof
thefemur or
vertebra.-
Smokersor heavy drinkers.
-
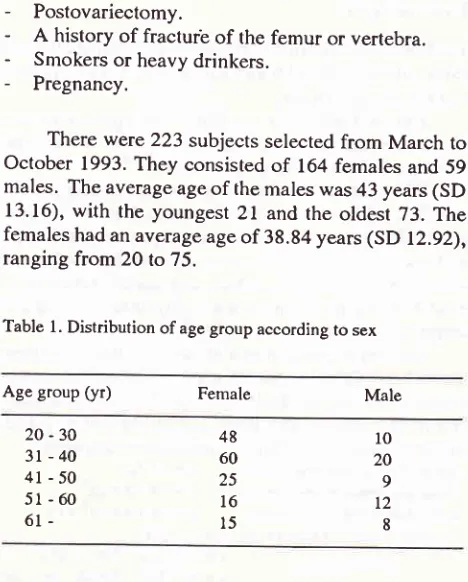
Pregnancy.There were 223 subjects
selectedfrom March
to
October
1993.They consisted
of
164females
and 59males.
The average ageof
the males was 43 years(SD
13.16),
with
the youngest
2l
andthe
oldest 73.
The
females had an average ageof
38.84 years(SD
12.92),ranging
from
20 to
75.Table
l.
Distribution of age group according to sexAge group
(yr)
Female Male20
-30
3l
- 404l-50
5l-60
61-48
60
25
l6
l5
l0
20 9
t2 8
The female
subjects
comprised
of
Indonesiansfrom
various ethnic groups, such
as
Javanese, Sun-danese,Betawis,
Bataks,
Flores,
Balinese, Minangs,
Timorese,
Palembangs,
or_of mixed
parentage
andChinese. The majority were
Javanese
(50%),
Sun-danese(18.9%),
and Chinese
(8.5To).The
male
sub-jects
also were Indonesians
of
various ethnic
groups, such as Javanese, Sundapese,Betawis,
Bataks,Flores,
Balinese,Timorese, Minangs,
Palembangs, Dayaks,or
mixed
parentageand
Chinese.The
majority of
maleswere
Javanese
(54.27o),
Sundanese
(20.3%),
and
Betawis (11.8%).
CT
assessmentThe BMC
were
assessedwith
a Somatom-CR
CT-Scanner
(Siemens
AG, Erlangen, Germany)
at
theRadiology
Department
of the
St. Carolus
Hospital in
Jakarta.A single
energy modeof
125kV
was used.An
axial
section through
the centerof
the Ll,L2, andL3
vertebral bodies was made, with a scan time
of
7 secondsat
67OmAS.
Each
section
was
4 mm
thick.
The subject was supine with
a calibration
phantom composedof water
and 200mg/ml
CaHydroxyapatite
(standard Siemens reference)
positioned
underneaththe lunrbar
vertebrae. Measurements
were
made
for'
both trabecular
andcortical
bones. [image:2.595.300.534.91.382.2]242
EkaYuda et al.Data
analysis
The
BMC
was reported as mean and standard deviation(SD)
values
in boxplot
and
line
graphsfor
eachmale
and female age group.Linear regression analysis was applied
to
es-timate the
changes of average bone
mineral
content
with
age bothinhale,
undfJmales.l3'la
The estimated values were presented
along
with
a95 % oonfidence
interval
or 2 standard errors in graph and tables.Linear
regression assumptions
were made
and the
accuracy
of
the
regression
model
evaluatedwith
linear, quadratic, cubic, and
double-breakpoint
models. Data management and analysis used the SPSScomputer software
for
statistics.l)
Several regression
models were evaluated
before
selecting the
right
model that precisely
describes the patternof changes in
BMC with
age, both in thefemale
and male subjects. The
BMC
wasdescribed as
y
and the agein
years asx. The regression models were
:-simple
:y=a+bx
-quuà.u
el:y=a+bx+cx2
-cubic
I
: y = a + bx + cx2 + dx3- double-breakpoint linear regression model :
Y=at+blx
forx<xbl
Y = a2 +b:x
for xbt!x
< xbzY=al+b3x
forx>xb:
The slope and
intercept
on the simple, quadratic, andcubic models were estimated
with
the least squares method. The point of intersection is thepoint where the
regression line changes
in slope.
It
was determined byevaluating
the changein
mean valuesof
5-year-inter-val
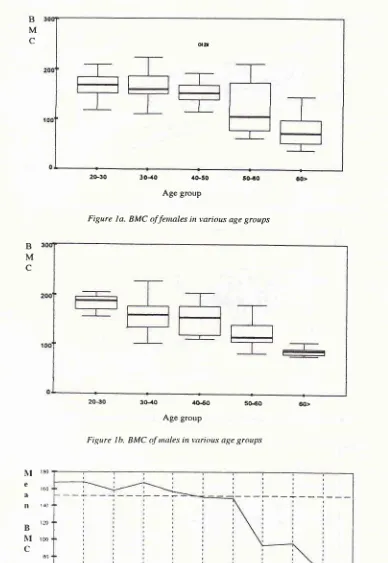
age groups.RESULTS
Table
2
shows the
mean
and
standard
deviation
of
BMC values
in
mg/ml
for
both men
and
women in
various
agegroups. There was an increased
reduction
in
both males and females over the
age
of
60,
thereduction
was morepronounced
in
females.Table 2. BMC of malc and lemalc in various age groups
fcnrale
ncan
SDnrale Age group
Med
J
Univ Indonof various
age groups. There was a marked decreasein
median values beginning
from
the 50 - 60 age group.
The decrease was more
pronounced
in
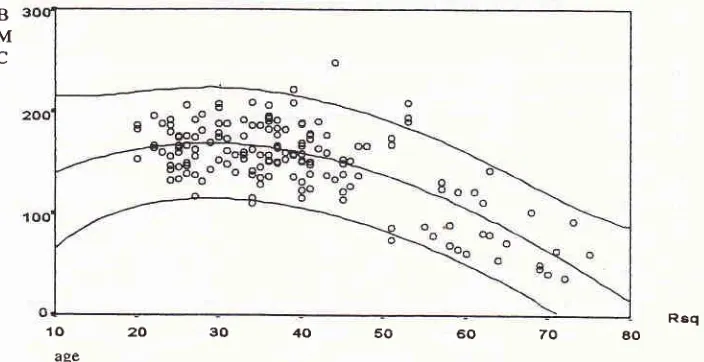
females.The results of
linear regression analysis
showeda consistent decline
in
BMC with
age,both
in
malesand females.
Theoretically,
the rate
of
decline in
the femalesshould accelerate
at acertain
age, due tochan-ges
in
the
estrogen
pattern
which
affects
BMC. A
precise regression
model
needs to
be applied which
will
reflect
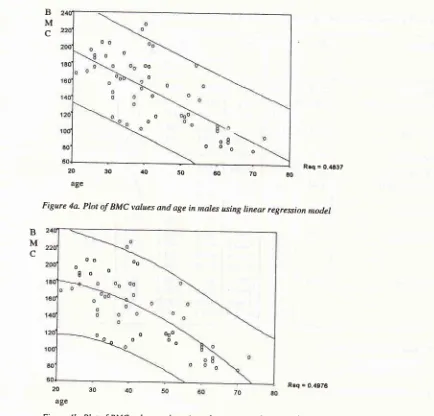
the true changes.No
improvement
in
causative information
was gainedby using
thecubic, quadratic, or
double-break-point
regressionmodels in the male
group. This
meant that, in the male group, the linear regressionmodel was
sufficiently
accurate in revealinginformation
onBMC
change
with
age.In
quadratic
regressionmodel
exact than the
linear
regress
in
interpreting
BMC
changes
with
age.
But
compared to^the
quadratic
model, the cubic
regression
model
(Rz=0.5171)
wasslightly
better.The double-breakpoint linear
regression model
showed thefollowing result
:This
model showed a -0.594
mg/nrl
reduction in
BMC
each year up to the age of 55. Then an acceleratedreduction
of
-8.8 mg/ml
per year until the age
of
60. The rate of reduction decreased somewhat after the ageof
60.This
is
clearly
shown
in figure
2.DISCUSSION
The
average
BMC
of
male
and
female
Indonesians,with ages
ranging
from
20
to
75, was studied.
The
subjects
were
selected
from a
sample
population
of
P r o g r ant J anû nan P e nt e li har aan Ke s e hatan members,
a
health plan
of
the St. Carolus Hospital.Not
all
ethnic groups
in
Indonesia
were
repre-sented but themajority
waswell
represented.The
population
in
this
study
is not
atrue
repre-sentationof
theentire Indonesian
population,
since the sample was specified and restricted to membersof
thehealth
plan.
Therefore, the results
of
this study
doesnot
necessarily
reflect the true
values
of
the
entire
population.
But
if
the
sample
can be
considered
asreflecting
the general,healthy, Indonesian population,
then the values can be regarded as reference valuesof
average
BMC
of
male and female Indonesians
of
various
ages. SD20-30 3r -40
4l-50
5l - 60
6l>
168.03 [email protected] 156.32 r2t.45 78.51 21.f6 25.O7 21.625 r.45 3t.6t 183.59 156.76 r54.r9 t22.13 87.16 t6.29 34.43 35.08 26.85 8.'19 f9.o2 t44.52
Vol 3, No 4, October-December 1994
I\[ I80
e a
ll rao
t20
B
NI
rooC
80
50
a0
Bone Mineral
Contenî
243B
M
c
ott2ù30 3O{0 ,lG'3O S04O ôO>
[image:4.595.86.474.87.650.2]Age group
Figure
la.
BMC of fennles in various age groupsB
M
c
20€0 3O4O 4G6O 5O€O ôo>
Age group
Figure Ib. BMC
tf
tnales in +'arious age groups3i -35 4l{5 5t55 ôt55
4ô-50 5ô$0 6F70
Age group
244 Ekayuda et al. Med J Univ Indon
B
M
c
Req = 9.4247
B
M
c
10
20
30
40
50
60
70
ao [image:5.595.137.492.90.278.2]age
Figure 3a. Plot of BMC values and age in fetnales using linear regression ,nodel
B3([
M
c
Rsq=05167
[image:5.595.149.472.311.492.2]10m3040506070m
ageFigure 3b. Plot of BMC values and age in fenales using quadratic regression nodel
'ro
20
30
4()
50
60
70
aoage
Figure 3c. Plot of BMC values and age in fenales using cubic regression nodel
I ooo a
'#-h:e:;]
[image:5.595.140.492.525.706.2]Vol
i,
No 4, October-Decenber 1994 BoneMineral Content
B
M
c
B
M
c
20
30
40
50
60
70
aoage
[image:6.595.35.563.70.756.2]Rrq = 0.4ô37
Figure 4a. Plot of BMC varues and age
in
nnres using rinear regression ntodel20
age
[image:6.595.100.534.80.496.2]Rsq = 9.4975
Figure 4b. Plot of BMC values and age in nrules using quadratic regrèssion nodel
Rsq = 6.499t
[image:6.595.53.528.489.726.2]20
30
40
50
60
70
EO ageFigure 4c- Plot of BMC values and age in nales using cubic regression tnodel.
B
M
c
OO
o
o'
o o
o8 \
oooo
o oo oo 8o o
ooooooo o o
246 Eka)'uda et al. Med
J
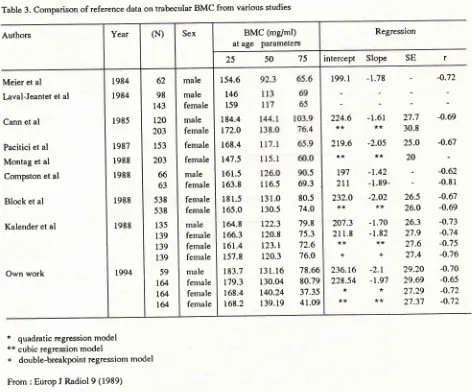
Utriv IndonTable 3. Comparison of reference data on trabecular BMC from various studies
Authors Year (N) Sex BMC (mg/ml)
at
age
parametersRegression
75 50
25
intercept
Slope SE
rMeier et al Laval-Jeantet et al
Cann et al
Pacitici et al Montag et al Compston et al
Block et al
Kalender et al
Own work
1984 1984 1985 1987 1988 1988 1988 1988 r994 62 98 143 120 203 153 203 66 63 538 538 135 139 139 139 59
t&
164 t@ male male female male female female female male female female female male fernale female female male female female female 154.6t46
159 184.4 r72.0 168.4 r47.5 161.5 163.8l8 1.5
165.0 164.8 166.3 161.4 157.8 183.7 r79.3 168.4 168.2
116.5
69.3131.0
80.5130.5
74.Ot22.3
79.8120.8
75.3r23.r
72.6120.3
76.0131.16
78.66130.04
80.79140.24
37.35139.19
41.09199.1
-1.78224.6
-1.61**
**
219.6
-2.O5**
**
Lg'l
-1.422LL
-1.89-232.0
-2.O2**
**
207.3
-1.70211.8
-1.82**
**
++
236.t6
-2.1228.54
-1.9'l**
**
**
-
-0.7227.7
-0.6930.8
25.0
-0.67 20-
-0.62-
-0.8126.5
-0.6726.0
-0.6926.3
-0.7327.9
-O.7427.6
-0.7527.4
-0.7629.20
-0.7029.69
-0.6527.29
-O.7227.37
-O.72*
quadratic regression model**
cubic regression model+
double-breakpointregrcssiom modelFrom : Europ
I
Radiol 9 (1989)The
regression analysis
model
usedto
describethe changes
in BMC
pattern showed
areduction
with
age.
The
male group showed
a
uniform,
or
linear
reduction.
The female group on the other hand, showed an acceleratedreduction
in the postmenopausalperiod'
The cubic
regression
model
gave
a more
exactinformation
on the patternof
changes inBMC with
agein
thefemale group,
which
is reflected by
the increasein
the regreision
determination
indicator
(R2).Through this model
it
can be seen that there wasslight
increase
in
BMC at the
ageof
20-30, followed by
aslight
decrease after the ageof
40 and marked decreaseafter
the ageof
50.Although
some authors suggest that alinear regression model
within
2 standarderrors
canin practice
be used as reference values,it
is advisedto
apply
the
cubic
regression
model with
an estimation
area
of 2
standard error as
reference
for
BMC
in
women. The linear
regressionmodel
can beapplied to
estimate the
BMC of
male subjects.The double-breakpoint
regression
model
of
thefemale
subjects,showed that
BMC
reduction
wasini-tially
stable thenfollowed
by
2 acceleratedreduction,
after
the ageof
55 and 65.This differs from
thefind-ings
of Kalender
for
Europeans, where the acceleratedreduction occured over the age
of
40
and 56.
The
decrease was 8.8
mg/ml
per yearfor
thoseover
55 and3.95
mg/ml for
thoseover
65in
thefemale Indonesian
subjects, compared to
3.21
mf,mlfor
those o,ver 40 and1.57
mg/ml for
thoseover
56in Europeans"
This
wasprobably
due todifferences
in
dietary
patterns,physi-cal activity,
estrogen
deficiency,
or
the
use
of
postmenopausal supplementary
drugs
including
estrogen.
Further
studies are
needed
on
post-menopausal
women
in
Indonesia, especially on
theeffects
of
thosefactors.
Comparisons between results
of
several
studiescan be seen
in
Table
3.In
general,it
can benoted
that [image:7.595.49.521.88.480.2]Vol 3, No 4, October-Decenber 1994
reduction
maydiffer
according
to the regressionmodel
employed,
andif
only
subjectsof
perimenopausal
ageis
used.CONCLUSIONS
1.
The
rateof BMC
reduction
with
agein
thefemale
subjects wasnot
uniform,
there was an acceleratedreduction
in
theperimenopausal period.
2.
The
rate
of
BMC reduction with
age
in
the
male
subjects wasuniform.
3.
Average
BMC
values,
based
on
the
appropriate
regression
model,
of
both
male and female
sub_jects
of
various
agegroups can
be
considered
asreference values
for
Indonesians.4.
The ayerage
BMC
values
of
Indonesian males
of
various
age
groups
andIndonesian
females
upto
the
age
of
50
does
not
differ
much from
other
studies;
it
wasfound
to bedifferent
in
Indonesian
femalesover
the ageof
50.SUGGESTIONS
Future
studies on osteoporosisshould cover
:*
BMC
studies using
awider
cross-sectional
designon
different
population
samples.*
Longitudinal
or
follow-up
studies todetermine
the rateof
natural
BMC
reduction
in
Indonesians.*
Cross-sectional
or
longitudinal studies
to
deter-mine the
BMC
where therisk of
fractures increases (fracture threshold)
*
Studies
on the rate
of
BMC
reduction
of
meno_
pausal women
and
the effects
of
dietary
patternsof calcium rich
food,
physical
activity,
supplemen-tary
estrogen andother factors.
Acknowledgements
The authors wish
to
thank
Dr.
A.
Mariono, former
Director of PK
St.Carolus, The Board
of
Directors
of
PK
St.Carolus,
The Headof
pJpK
St. Carolus andhis
staff,
theradiographers
andtechnicians
at the Radiol_ogy Department
of
pK
St.Carolus,
andthe Chairman
of
Health
Studies Centre
of
the
ResearchInstitute
of
the
University of
Indonesia.
Bone Mineral
Content
247REFERENCES
l.
RiggsBL,
Meltonn LJ. Involution osteoporosis,N
EglI
Med. 1986;26:1676-86.
2.
Lampmann
LEH.
Axial
Skeletal
CT
densitometry,Proefschrift. Wetenschappelijke Uitgeverij Bunge - Utrecht, 1982.
3. Cann CE, Gennant HK, Kolb FO, Ettinger B. euantitative
CT for prediction ofvertebral fracture risk. Bone l9g5;6: l_7. 4. Compston
IE,
EvansWD,
Crawley EO, Evans C. Bonemirreral content
in
normalUK
subjects.Br J
Radiol. 1988;61:631-6.5. Gilsanz V,, Gibbens DT, Roe TF, Carlson M. Vertebral bone
density
in
children: Effect
of
puberty.
Radiology.1986; I 66:847-50.
6.
Pacifici
le_and
dua
larbone:
a
ticwomen.
7. Kalender
WA,
Felsenberg D, Louis O, Lopez p, Klotz E,Osteaux
M,
et al.
Reference Valuesfor
Trabecular andDensity in Single and Dual-Energy Tomography.
Eur
J
Radiology.8. Genant
HK,
Block JE, Sreigerp,
Gluer CC. euantitative Computed Tomography in the Assessment of OsteoporosisIn : Genant HK, editor. Osteoporosis Update 19g7. Radiol_
ogy
Research andEducation Foudation, California;
198'7:49-71.
9. Pacifici
R,
RupichRl
Griffin
M,
ChinesA,
Susman M,Avioli LV.
Dual Energy Radiography versus euantitativeComputer Tomography for the Diagnosis of Osteoporosis.
ICEM. 1990;70:705-10.
10.
rket disparity betweenI
h age in healthy men.;
post-tnenopausal osteoporotic women; Comparison
of
measurement nrethods. Radiology l9g6;160:469_7g.
13. Draper NR, Smith H. Applied Regression Analysis, New
York: Wiley, 1981.
14. Kleinbaum, Kupper, Muller. Applied Regression and Other