DOI: 10.12928/TELKOMNIKA.v14i3.3440 1090
Brightness and Contrast Modification in
Ultrasonography Images Using Edge Detection Results
Retno Supriyanti*1, Suwitno2, Yogi Ramadhani3, Haris B Widodo4, Tutik Ida Rosanti5 1,2,3
Electrical Engineering Department, Jenderal Soedirman University
4,5Medical Faculty, Jenderal Soedirman University, Jl. HR. Boenjamin 708 Purwokerto,
Phone: +62-281-635292
*Corresponding author, e-mail: [email protected]
Abstract
Currently, ultrasonography device become important equipment for supporting diagnosis in diesases. Unfortunetaly, a lot of ultrasonography images do not provide enough information for supporting diagnosis especially images produced by low-resolution ultrasonography. It is caused by image quality that has been produced is inadequate because of noise. This research aims to improve image quality by modifying brightness and contrast to the edge detection algorithms. By modifying the brightness and contrast will cause the value of standard deviation of the ultrasonography image is lowered. Raising setting values will cause deviation standard value become smaller, and also the result of standard deviation is inversely proportional to the value of RMSE. The results show that this modification can improve image quality by reducing noise significantly.
Keywords: ultrasonography image, low resolution, brightness, contrast, standard deviation, reducing noise
Copyright © 2016 Universitas Ahmad Dahlan. All rights reserved.
1. Introduction
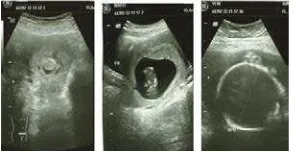
The development of information technology (IT) has an impact on the development of various aspects of human life. One aspect that affected the development of the IT world is health. One part of IT is digital image processing. On the other hand, in the field of health there are technologies to maximize the role of digital image processing in supporting health services especially for diagnosing which is the use of ultrasonography equipment. Ultrasonography is used as diagnostic aid by visualized human body organs such example is uterus area. Examination using ultrasonography for uterus area is very useful especially for high-risk pregnancies. Ultrasonography examination is one method of screening for checking pregnancy is considered safe, non-invasive, accurate and effective. Currently, ultrasonography image has evolved, which formerly only use two-dimensional ultrasonography image is now a three-dimensional ultrasound image and also four-dimensional ultrasonography image. Unfortunately, especially in Indonesia, a high-resolution ultrasonography with mostly only available at large hospitals in big cities, because of the high price of the equipment. On the other hand, patients spread in all area including in small city where hospitals or health clinics have two-dimentional ultrasonography only. The image obtained by ultrasonography device, sometimes have a loss of quality that can be ranges contrast, geometric distortion, fuzziness or noise [1]. Figure 1 shows an example of image produced by two dimentional ultrasonography.
Figure 1. An Example Image of 2-D Ultrasonography
According to Figure 1, the image is not yet fully has good image quality that has not provided clear information about what is contained therein, for example, is information on the shape and layout of the uterus that have different layout in each ulatrasonography image. While for an accurate diagnosis we need to the accuracy of the shape and layout of the uterus area, therefore the low-resolution image will be a problem. One of image processing techniques that can be used to obtain the shape and layout of the uterus area is using edge detection method. Edge detection method is used to obtain the edges of objects. There are several operators on edge detection include Canny operator, Laplacian of Gaussian operator, Prewitt operator, Robert operator and Sobel operator. However, according to the edge detection process, ultrasonography images should have good quality. Low resolution quality of the image greatly influences the results of edge detection. To solve this problem, one of which is capable of affecting the quality of the ultrasonography image is the brightness, contrast and noise of the ultrasonography image.
The final goal of this research is to improve the quality of the image produced by two-dimentional ultrasonography. Therefore it is expected that using two-dimensional ultrasonography in rural areas can be optimized in order to improve people health quality in this areas.
department-performed pelvic ultrasonography (RPPU) in emergency department (ED) female patients requiring pelvic ultrasonography and their outcomes in relation to ED length of stay, ED readmission, and alternative diagnosis, within a 14-day follow-up period. Wang [14] investigated and compared contrast-enhanced ultrasound (CEUS) in the characterisation of histologically proven focal nodular hyperplasia (FNH) with contrast-enhanced computed tomography (CECT). Hizukuri [15] developed a computerized determination scheme for histological classification of breast mass by using objective features corresponding to clinicians' subjective impressions for image features on ultrasonographic images. According to these researches, it seems that most of researcher using complex method to optimize ultrasonography function. In other hand, some researcher also emphasize to improve image quality in other case such as Wang [16] in his research purpose to image denoising is to restore the original image without noise from the noise image, and at the same time maintain the detailed information of the image as much as possible. Zang [17] proposed a new hybrid algorithm for the image edge extraction and refining, which combined the genetic algorithm and ant colony algorithm. Wu Jie [18] proposed median filtering algorithm to enhance targets; and the targets are sharpened by using lateral inhibition algorithm, the edge of targets is outlined. In order to get reliable target region, adaptive threshold segmentation algorithm is used to extract need target region, and characteristics of target is used to distinguish multiple targets.
According to the main goal of our research for supporting health service technology for rural area, in this paper we will emphasize for optimizing ultrasonography image quality by applying a simple and robust method. In our previous research [19-26], we developed some simple and easy to use technology to support health service in rural area based on image processing and expert system. It is implemented in some areas of diseases such as cataract, high risk pregnancy, cervical cancer and etc. We also optimized some equipment for acquiring data such as digital camera, smartphone, low-cost panoramic, portable USG. In this paper, we will optimize low-cost ultrasonography where this machine availabiliy is very limited in developing countries such in Indonesia.
2. Research Method 2.1. Data Acquisition
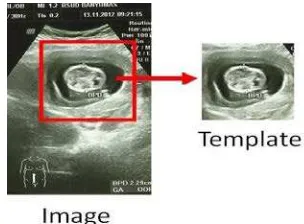
All data used in this research were obtained from General Hosital of Banyumas Regency. Data is ultrasonography image with .jpg extension as shown in Figure 2.
2.2. Increased Image Brightness
The basic operation is usually done in the image is brightness enhancement. This operation is performed to increase the brightness of an image. If an image still has a low brightness quality it can be done brightness enhancement process. Mathematically [27], the increased brightness is done by adding a constant to the value of the entire pixel. The addition of brightness can be written as described in Equation 1.
�(�,�) = �(�,�) + � (1)
2.3. Contrast Stretching
The contrast in an image states the distribution of light and dark shades of color. A gray-scale image is said to have a low contrast when the distribution of color tend to narrow the range of gray levels. Conversely, if the image has a high contrast range of gray levels distributed over wide [27]. Contrast stretching process could be done by multiplying a constant image and it could be written in Equation 2.
�(�,�) = ��(�,�) (2)
2.4. Brightness and Contrast Combination
Operations of brightness increasing and contrast stretching could be done simultaneously with the aim to improve image quality. In general, a combination of the two operations can be written as descibed in Equation 3 [27].
2.5. Deviation Standard
Standard deviation is a variation of data distribution of all the data. The smaller value of spreading means fewer variations in data values. If spreading is 0, then the value of all data is the same. The greater value of the data spreading means increasingly varied. Standard deviation can be calculated using the following formula [1] as described in Equation 4.
(4)
Wherein: σ = deviation standard, ��= Data to I, x’= data average, n= number of data
2.6. Root Mean Square Error (RMSE)
Observation of changes in image after image processing can be done by looking directly on the image. However, to measure quantitatively, it can be done by calculating the value of RMSE (Root Mean Square Error). RMSE is the root of the MSE (Mean Squared Error). RMSE can be calculated using the Equation 5 [1].
���� = √��� (5)
MSE value calculation is the average squared error between the original images with the image processing results. MSE can be calculated using the Equation 6.
���= 1
������[�(�,�)− �′(�,�)]2 (6)
Wherein: X = image width (pixel), Y= citra height (pixel), I= image pixel value before noise reduction, I’= image pixel value after noise reduction.
3. Results and Analysis
3.1. Converting Image to Grayscale
The first step in this system is to convert input images which is in RGB (Red-Green-Blue) to grayscale that has only one value that is gray. This process aims to simplify the ultrasonography image that is still in the form of RGB which has three constituent components, namely R, G, and B, converted into grayscale form which has only one component of which is gray. In the grayscale image handle only shades of black and white produces gray effect. Figure 3 shows an example of conversion from RGB to grayscale image in our experiment.
Grayscale image is obtained by calculating the average value of the color components R, G, B. The calculation process carried out on the entire pixel image.
3.2. Determine Uterus Area
To determine uterus area, we applied template matching method. Template matching is used to find the existence of a desired object in an image by using the template image as a reference image [27]. Selection of image templates to determine desired area is very important in the method of template matching. More precise selection of template image is higher presentation success template matching method. If the selection is not appropriate template then the determination of the uterus area will fail. Selection of template could be done based on shape and image degradation. Both variables could be evaluted by image histogram [28]. An example of determining uterus area in our experiment is shown in Figure 4.
3.3. Deviation Standard
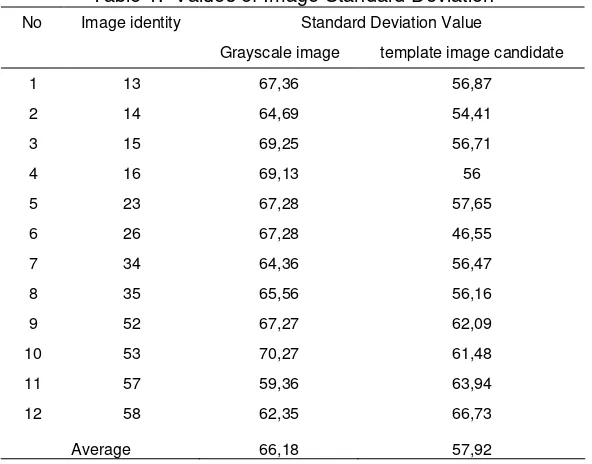
The standard deviation is used to calculate variations in the distribution of color intensity on an ultrasonography image. Table 1 describes some examples of deviation standard of our grayscale image and template image candidate.
Table 1. Values of Image Standard Deviation
No Image identity Standard Deviation Value
Grayscale image template image candidate
1 13 67,36 56,87
2 14 64,69 54,41
3 15 69,25 56,71
4 16 69,13 56
5 23 67,28 57,65
6 26 67,28 46,55
7 34 64,36 56,47
8 35 65,56 56,16
9 52 67,27 62,09
10 53 70,27 61,48
11 57 59,36 63,94
12 58 62,35 66,73
Average 66,18 57,92
According to Table 1, selection of template image is based on average of standard deviation value between gray scale image and candidate template image. According to the standard deviation values, the most qualified image is image with identity 23, 26, 52 and 35.
However, success percentage as a template is the best way to determine the best template. If the template image candidates have higher percentage than other, it will be choosen as a template image. Table 2 described percentage of success template.
According to Table 2, image23 has higher percentage than other, it is about 83.3%. Therefore for the next process, we used image23 as an image template in our experiment.
3.4. Brightness and Contrast Modification
Table 2. Percentage of Uterus Detection
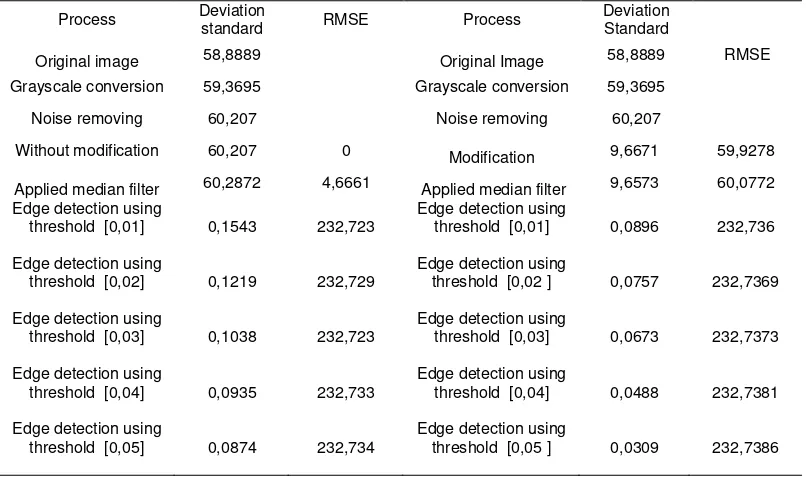
Table 3. Standard Deviation and RMSE Values Using Canny Operator
Process Deviation
standard RMSE Process
Deviation
Standard RMSE
Original image 58,8889 Original Image 58,8889
Grayscale conversion 59,3695 Grayscale conversion 59,3695
Noise removing 60,207 Noise removing 60,207
Without modification 60,207 0 Modification 9,6671 59,9278
Applied median filter 60,2872 4,6661 Applied median filter 9,6573 60,0772
Edge detection using threshold [0,01 0,02]
0,1455 232,7248
Edge detection using
threshold [0,01 0,02] 0,0865 232,7362
Edge detection using
threshold [0,01 0,02] 0,0814 232,7365
Edge detection using
threshold [0,04 0,05] 0,1246 232,7287
Edge detection using
threshold [0,01 0,02] 0,0788 232,7367
Edge detection using
threshold [0,05 0,06] 0,1178 232,7298
Edge detection using
Table 4. Standard Deviation and RMSE Values Using Sobel Operator
Process Deviation
standard RMSE Process
Deviation
Standard RMSE
Original image 58,8889 Original Image 58,8889
Grayscale conversion 59,3695 Grayscale conversion 59,3695
Noise removing 60,207 Noise removing 60,207
Without modification 60,207 0 Modification 9,6671 59,9278
Applied median filter 60,2872 4,6661 Applied median filter 9,6573 60,0772
Edge detection using
threshold [0,03] 0,0675 232,7373
Edge detection using
threshold [0,04] 0,0945 232,733
Edge detection using
threshold [0,04] 0,0526 232,7379
Edge detection using
threshold [0,05] 0,0881 232,734
Edge detection using
threshold [0,05 ] 0,0317 232,7386
Table 5. Standard Deviation and RMSE Values Using Prewitt Operator
Process Deviation
standard RMSE Process
Deviation
Standard
Original image 58,8889 Original Image 58,8889 RMSE
Grayscale conversion 59,3695 Grayscale conversion 59,3695
Noise removing 60,207 Noise removing 60,207
Without modification 60,207 0 Modification 9,6671 59,9278
Applied median filter 60,2872 4,6661 Applied median filter 9,6573 60,0772
Edge detection using
threshold [0,03] 0,0673 232,7373
Edge detection using
threshold [0,04] 0,0935 232,733
Edge detection using
threshold [0,04] 0,0488 232,7381
Edge detection using
threshold [0,05] 0,0874 232,734
Edge detection using
threshold [0,05 ] 0,0309 232,7386
3.5. Edge Detection and Calculating Of Standard Deviation and RMSE
This process aims to get the edge shape of uterus. We did this experiment by applying several edge detection operators such as canny, sobel, and Prewitt. Table 3 to Table 5 show an example result of each method including deviation standard and RMSE values, in here we use image57 as a case.
4. Conclusion
According to the results above, we conclude: (i) edge detection in ultrasonography images which have been modified brightness and contrast providing good shape uterus and just having a bit noise. That means brightness and contrast modification could improve image quality. (ii) Brightness and contrast modification cause standar deviation value decreased. The higher value setting, the smaller deviation value generated. (iii) During image processing, standard deviation value is inversely proportional to RMSE value. (iv) Generally, all edge detection operator able to produce good edge detection if using accurate threshold. In our experiment, canny operator provide the best result when using threshold [0.02 0.03] while for sobel and prewitt operator, the best result is obtained when using threshold [0.002]. Higher threshold provided edge detection result obtained will getting worst.
Acknowledgements
This work is supported by Directorate General of Higher Education through Hibah Strategis Nasional (STRANAS).
References
[1] R Munir, Pengolahan Citra Digital dengan Pendekatan Algoritmik. 1st ed. Bandung, Indonesia: Penerbit Informatika. 2004.
[2] CB Nauer, C Zubler, C Weisstanner, C Stieger, P Senn, A Arnold. Radiation dose optimization in pediatric temporal bone computed tomography: Influence of tube tension on image contrast and image quality. Neuroradiology. 2012; 53(3): 247-254.
[3] MJ Massey, E LaRochelle, G Najarro, A Karmacharla, NI Arnold, R Trzeciak, S Shapiro. The microcirculation image quality score: Development and preliminary evaluation of a proposed approach to grading quality of image acquisition for bedside videomicroscopy. J. Crit. Care. 2013; 28(6): 913-917.
[4] P Case JA, MD Bateman TM. Taking the perfect nuclear image: Quality control, acquisition, and processing techniques for cardiac SPECT, PET, and hybrid imaging. J. Nucl. Cardiol. 2013; 20(5): 891-907.
[5] H Lupsor-Platon, M Stefanescu, D Muresan, M Florea, ME Szász, A Maniu, R Badea. Noninvasive assessment of liver steatosis using ultrasound methods. Med. Ultrason. 2014; 16(3): 236-245. [6] G Serbes, N Aydin. Denoising performance of modified dual-tree complex wavelet transform for
processing quadrature embolic doppler signals. Med. Biol. Eng. Comput. 2014; 52(1): 29-43. [7] M Ciecholewski, J Chocholowicz. Quadrature signals. Comput. Biol. Med. 2013; 43(12): 2238-2355. [8] P Martinez-Sanchez, AV Alexandrov. Ultrasonography of carotid plaque for the prevention of stroke.
Expert Rev. Cardiovasc. Ther. 2013; 11(10): 1425–1440.
[9] R Chifor, ME Badea, D Mitrea, IC Badea, M Crisan, I Chifor, R Avram. Computer-assisted identification of the gingival sulcus and periodontal epithelial junction on high-frequency ultrasound images. Med. Ultrason. 2015; 17(3): 273–279.
[10] D Vatansever, V Kyriakopoulou, JM Allsop, M Fox, A Chew, JV Hajnal, MA Rutherford. Multidimensional analysis of fetal posterior fossa in health and disease. The Cerebellum. 2013; 12(5): 632–644.
[11] M Anobetti, A Coppa, F Bulletti, S Piazza, P Nazerian, A Conti, R Pini. Verification of correct central venous catheter placement in the emergency department: Comparison between ultrasonography and chest radiography. Intern. Emerg. Med. 2013; 8(2): 173–180.
[12] H Tanaka, H Iijima, A Higashiura, K Yoh, A Ishii, T Takashima, S Nishiguchi. New malignant grading system for hepatocellular carcinoma using the sonazoid contrast agent for ultrasonography. J. Gastroenterol. 2014; 49(4): 755–763.
[13] AT Chiem, CH Chan, DY Ibrahim, CL Anderson, DS Wu, CJ Gilani, JC Fox. Pelvic ultrasonography and length of stay in the ED: An observational study. Am. J. Emerg. Med. 2014; 32(12): 1464–1469. [14] W Wang, L Chen, M Lu, G Liu, S Shen, Z Xu, L Zhou. Contrast-enhanced ultrasound features of
histologically proven focal nodular hyperplasia: Diagnostic performance compared with contrast-enhanced CT. Eur. Radiol. 2013; 23(9): 2546–2554.
[15] A Hizukuri, R Nakayama, Y Kashikura, H Takase, H Kawanaka, T Ogawa, S Tsuruoka. Computerized determination scheme for histological classification of breast mass using objective features corresponding to clinicians’ subjective impressions on ultrasonographic images. J. Digit. Imaging. 2013; 26(5): 958–970.
[16] J Wang, D Zhang. Image Denoising Based on Artificial Bee Colony and BP Neural Network. TELKOMNIKA Telecommunication Comput. Electron. Control. 2015; 13(2): 614.
Algorithm. TELKOMNIKA Telecommunication Comput. Electron. Control. 2015; 13(1): 118.
[18] W Jie, F Zuren, W Lei, Z Feng, L Wang. High Recognition Ratio Image Processing Algorithm of Micro Electrical Components in Optical Microscope. TELKOMNIKA Telecommunication Comput. Electron. Control. 2014; 12(4): 911.
[19] R Supriyanti, H Habe, M Kidode, S Nagata. A simple and robust method to screen cataracts using specular reflection appearance. Proc. SPIE 6915 Medical Imaging. 2008.
[20] R Supriyanti, H Habe, M Kidode, S Nagata. Compact Cataract Screening System: Design and Practical Data Acquisition. International Conference on Instrumentation, Communication, Information Technology and Biomedical Engineering (ICICI-BME). 2009.
[21] R Supriyanti, H Habe, M Kidode, S Nagata. Extracting appearance information inside the pupil for cataract screening. Proceedings of the 11th IAPR Conference on Machine Vision Applications. 2009: 342–345.
[22] R Supriyanti, E Pranata, Y Ramadhani, TI Rosanti. Separability filter for localizing abnormal pupil: Identification of input image. Telkomnika. 2013; 11(4): 783–790.
[23] R Supriyanti, D Putri, E Murdyantoro, HB Widodo. Comparing edge detection methods to localize uterus area on ultrasound image. Proc. of 2013 3rd Int. Conf. on Instrumentation, Communications, Information Technol., and Biomedical Engineering: Science and Technol. for Improvement of Health, Safety, and Environ., ICICI-BME. 2013: 152–155.
[24] R Supriyanti, A Fariz, T Septiana, E Murdyantoro, Y Ramadhani, HB Widodo. A Simple Screening for High-Risk Pregnancies in Rural Areas Based Expert System. Telkomnika. 2015; 13(2): 661–669. [25] HB Widodo, A Soelaiman, Y Ramadhani, R Supriyanti. Calculating Contrast Stretching Variables in
Order to Improve Dental Radiology Image Quality. International Conference on Engineering and Technology for Sustainable Development (ICET4SD). 2015.
[26] R Supriyanti, U Erfayanto, Y Ramadhani, E Murdyantoro, HB Widodo. Blood Pressure Mobile Monitoring for Pregnant Woman Based Android System. International Conference on Engineering and Technology for Sustainable Development (ICET4SD). 2015.
[27] A Kadir, A Soesanto. Teori dan Aplikasi Pengolahan Citra. Yogyakarta Indonesia: Penerbit Andi. 2013.