Summary
A simple and rapid high-performance thin-layer chromatography (HPTLC) densitometric method has been developed for the deter-mination of mebhydrolin napadisylate in tablets. After extraction of the analyte with a mixture of methanol and NH4OH 25% (100:1.5, v/v), the extracts were spotted on precoated HPTLC silica gel F254 plates, which were developed with a mixture of methanol and ethyl acetate (1:1, v/v). Quantitative evaluation was performed by mea-suring the absorbance reflectance of the analyte spots at 287 nm. The method was validated for specificity, linearity, accuracy, preci-sion, and robustness. Good linearity was achieved in the concentra-tion range 600–1600 ng/spot. The RSD of repeatability and interme-diate precision were found to be less than 2%, whereas the mean of the recovery data was 99.3–100.8%. The detection limit and quan-tification limit were 18.5 and 55.5 ng/spot, respectively. The drug was subjected to acidic and alkaline hydrolysis, oxidation, dry heat, and UV treatment. The peak of mebhydrolin napadisylate was not interfered by those of possible degradation products.
1 Introduction
Mebhydrolin napadisylate (CAS: 6153-33-9) is a sedating anti-histamine with antimuscarinic and sedative properties. Usually, this drug is given orally for the symptomatic relief of allergic conditions such as urticaria, rhinitis, and pruritic skin disorders [1]. At present, many tablet preparations containing mebhy-drolin napadisylate as the active ingredient are marketed in Indonesia [2]. Unfortunately, no official method for its analysis in the Indonesian Pharmacopeia [3] and other pharmacopeiae is available. Sastry et al. described a spectrophotometric method for the assay of mebhydrolin napadisylate and other antihista-minic drugs [4]. A high-performance liquid chromatography (HPLC) method for the determination of mebhydrolin napadisy-late has been reported [5]. To the best of our knowledge, there is no publication reporting the determination of mebhydrolin napadisylate in pharmaceutical preparations using densitometry.
The objective of the present work is to develop a simple, rapid, and validated densitometry method for the determination of mebhydrolin napadisylate in tablets.
2 Experimental
2.1 Materials and Reagents
Mebhydrolin napadisylate (CrossChem, Lugano, Switzerland; Batch No. 20081001; Assay 99%, Expiry date: September 2013) was of pharmaceutical grade. Methanol, ethyl acetate, and NH4OH 25% (E. Merck, Darmstadt, Germany) were of analyti-cal grade reagents. The solvents were used without further purification.
Commercial tablets containing 76 mg mebhydrolin napadisylate were purchased from a local pharmacy in Jember, East Java, Indonesia (January 2010).
2.2 Standard Preparation
Stock standard solutions were always freshly prepared by dis-solving accurately weighed mebhydrolin napadisylate (25 mg) in 25 mL solvent, which consisted of a mixture of methanol and NH4OH 25% (100:1.5, v/v). Stock solutions were made twice by independent weighings. Various standard solutions were pre-pared from the two stock solutions by dilution with the solvent. For basic linearity studies, solutions were prepared containing 300, 400, 500, 600, and 800 μg mL–1, and 2 μL of each of these solutions was spotted on the HPTLC plate. The standard solu-tions were stable at least for 4 h at room temperature in the sol-vent (mean ± RSD: 99.6% ± 2.8%) and on the HPTLC plates (mean ± RSD: 103.5% ± 1.5%).
A modified version of a published method was used for differ-entiating the spots of mebhydrolin base and napadisylate [6]. An amount of 20 mg mebhydrolin napadisylate was transferred into a 50-mL volumetric flask, and approximately 20 mL of solvent was added to it. The solution was then extracted four times by using 20 mL of chloroform in a vortex mixer. The chloroform
L. Wulandari, M. Yuwono, and G. Indrayanto, Faculty of Pharmacy, Airlangga University, Dharmawangsa Dalam, Surabaya 60286, Indonesia.
E-mail: [email protected]
*Part of the Master thesis of L.W. at Airlangga University.
Densitometric Determination
of Mebhydrolin Napadisylate in Tablets*
Lestyo Wulandari, Mochamad Yuwono, andGunawan Indrayanto*
Key Words
Mebhydrolin napadisylate
fractions (F-Ch) were collected in a 25-mL vial. Two microliters of F-Ch and water fraction (F-Wt) were then spotted on the HPTLC plate.
2.3 Sample Preparation
Twenty tablets were weighed and their average weight was determined. The tablets were mixed and finely powdered. An amount equivalent to 12.5 mg of mebhydrolin napadisylate was transferred into a 25-mL volumetric flask, and approximately 15 mL of the solvent was added. The mixture was ultrasonicated for 5 min and then diluted to 25 mL with the same solvent. The solution was filtered through a Whatman type-40 filter paper. This solution (2 μL) was spotted on the HPTLC plates.
2.4 Chromatography
Chromatography was performed on precoated 20 cm × 10 cm HPTLC silica gel 60 F254 aluminum-backed sheets (E. Merck, #1.05548). A Nanomat III (CAMAG, Muttenz, Switzerland) equipped with 2.0 μL glass capillaries (CAMAG, Cat. 022.77772, CV≈0.6%, R≈0.25%) was used for sample appli-cation. The mobile phase used was a mixture of methanol and ethyl acetate (1:1, v/v). Ascending development was performed in a CAMAG HPTLC twin-trough chamber; the mobile phase migration distance in all experiments was 9 cm (development time was ca. 30 min at 25°C ± 2°C).
Densitometric scanning was performed with a CAMAG TLC Scanner III. The purity and identity of the analyte spots were
determined by scanning in the absorbance reflectance mode from 200 to 700 nm. Quantitative evaluation was performed by measuring the absorbance reflectance of the analyte spots at 287 nm. The densitometric scanning parameters were as fol-lows: bandwidth 10 nm; slit 4 slit length 6; scanning speed 4 mm s–1. Calculations for identity, purity checks (r
S,Mand rM,E where S = start, M = center; and E = end of spectrum), sdv (relative standard deviation of the linear curve), and
quantifica-Table 1
Linear regression data.
Linearity range (n= 15)a) 600–1600 ng/spot
Correlation coefficient (r) 0.996
Relative process standard
deviation (Vxo) [7] 3.68%
Calculated sdv value
(from CATS software) 3.62
Calculated F-value (ANOVA) 403.2 for p< 0.0001
Calculated Fisher ratio of
lack-of-fit error [8] 1.45 (<3.71; tabulated at the 95% with 3 and 10 degrees of freedom)
DLb) 18.5 ng/spot
QL (3 × DL) 55.5 ng/spot
a)Five levels of concentrations in triplicate (n= 5 × 3 = 15)
b)DL =X
p(detailed calculation presented in text) Figure 1
tion of the analyte spots was performed by the CATS software version 1.4.1.8154 (2005) from CAMAG. Quantitative evalua-tions were performed via peak areas with linear regression, using at least four-point calibrations on each plate.
2.5 Validation Method
The method was validated for linearity, detection limit (DL), quantification limit (QL), accuracy, precision, and robustness according to the published methods [7–9] with appropriate mod-ification. For accuracy studies, a five-point standard addition method on commercial tablets (addition 30%, 40%, 50%, 60%, and 70% of the label claim) was performed on three different days. The precision (repeatability, intermediate precision) and robustness were also evaluated by using commercial tablets.
2.6 Forced Degradation Studies
Approximately of 1000 mg (accurately weighed) of mebhy-drolin napadisylate or powdered tablets (1000 mg) were mixed homogenously with 0.2 mL HCl 2N, NaOH 2N, and H2O29%, and then incubated for 7 days at 60 °C. Dry heat degradation study was performed by storing the powdered samples at 80 °C for 7 days, while UV degradation study was carried out by irra-diating the samples using a UV lamp at 254 nm (CAMAG) for 1 day. These stressed samples were then dissolved with the sol-vent as described in Section 2.2 and analyzed by the proposed densitometric method.
3 Results and Discussion
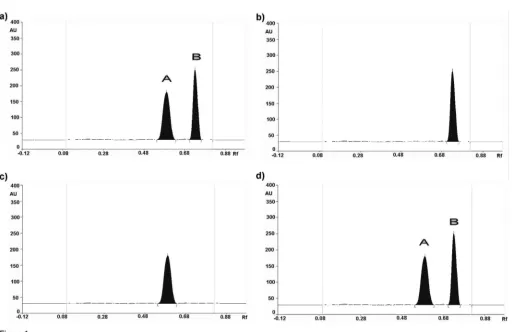
After the HPTLC plate was eluted, the densitogram at 287 nm of the standard solutions in the solvent and extract of commercial tablets showed two spots, namely, peak A (RF~0. 59) and peak B (RF~0.73) (Figures 1aand d). F-Ch (Figure 1b) and F-Wt (Figure 1c) yielded one spot, respectively (RF0.59 and 0.73). This indicated that the spots with RF0.59 and 0.73 were spots of the mebhydrolin base and napadisylate, respectively. This was confirmed by measuring their in situ UV spectra (Figures 2and
3). Quantitative evaluation was performed on the peak of the mebhydrolin base only.
The proposed HPTLC system demonstrated that all analyte spots in samples furnished in situ UV spectra that were identical to those of standards (r≥0.9999). Purity check of the analyte spots using the CATS software also showed that all analyte spots of the extracts were pure. The values of rS,M and rM,E were ≥0.9999, demonstrating that the proposed HPTLC method is
highly selective.
Linearity of mebhydrolin napadisylate was achieved from 600 to 1600 ng/spot obeying the equation Y= 2.995X+ 800.148. The linear regression data is presented in Table 1. The basic calibra-tion curve showed variable homogeneity over the whole range. The calculated test value of PW [7] was 4.09. The PW value was less than the F-table value (6.99; for f1= 7, f2= 7; α= 0.01). The DL was determined by making a linear regression of relatively low concentrations of mebhydrolin napadisylate (20– 200 ng/spot; n= 9; Vxo= 4.03%; sdv = 4.21; r= 0.9978; line equation Y = 5.58X + 11.35). The ANOVA regression test showed a significant F-value (1621.3 for p < 0.0001). By this method, the calculated Xp value was 18.5 ng/spot; in this case DL =Xp[7] (Table 1).
Table 2demonstrates the high accuracy of the proposed method as revealed by the percentage of mean recovery data (99.3–100.8%). To test whether systematic errors had occurred, a linear regression of the recovery curve of Xf(percentage of label claim of the analyte found by the proposed method) against Xc(nominal percentage of label claim of the analyte after addition with the standard) of the commercial tablets was carried out. All recovery curve equations that are presented in Table 3did not reveal the occurrence of con-stant or proportional-systematic errors [7].
All the values of the repeatability and intermediate precision evaluations were less than 2% (Table 4). These values were also less than the required values (2.3%; specification range of 95–105%; n= 6) [10]. The three measurements were performed within one laboratory by same analyst on different plates and different days.
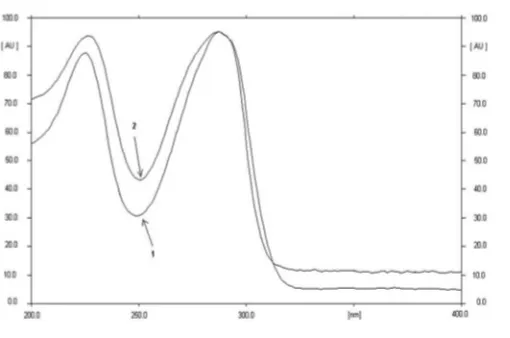
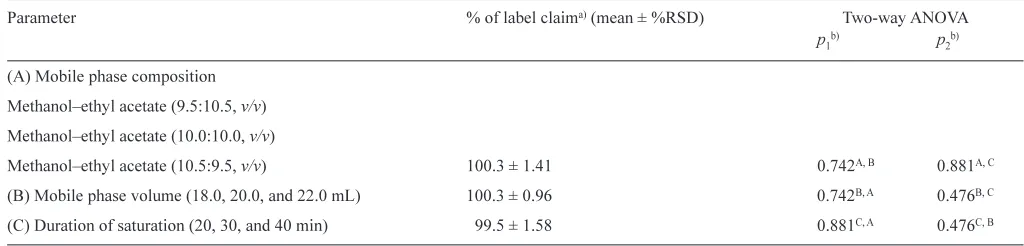
In order to evaluate the robustness of the proposed method, the influence of small variation on the composition of the mobile phase, volume of the mobile phase, and saturation time on the content of mebhydrolin napadisylate in the commercial tablets were evaluated (Table 5). The RSD values (%label claim) of the samples within treatment were less than 2%, and two-way Figure 2
UV spectra of spot A of mebhydrolin napadisylate in the mixture of NH4OH 25%–methanol (1.5:100, v/v) (1) and spot of Ft-Ch (2).
Figure 3
ANOVA evaluation showed that there was no significant differ-ence between the treatments (p> 0.05). This shows that the pro-posed TLC method is robust.
The degradation tests showed that the content of the analytes as bulk substances and in tablets were reduced in the range of 0.2–8.2% under stressed conditions (Table 6). No degradation products were observed in the densitogram at UV 287 nm, which might be due the fact that the possible degradation prod-ucts have no UV-absorbing functional group. The purity and identity check of the analyte spots of mebhydrolin napadisylate using the CATS software still yielded good values (>0.999), which showed that all the analyte spots were still pure and
iden-Table 5
Robustness of the HPTLC method.
Parameter % of label claima)(mean ± %RSD) Two-way ANOVA
p1b) p
2b)
(A) Mobile phase composition
Methanol–ethyl acetate (9.5:10.5, v/v)
Methanol–ethyl acetate (10.0:10.0, v/v)
Methanol–ethyl acetate (10.5:9.5, v/v) 100.3 ± 1.41 0.742A, B 0.881A, C
(B) Mobile phase volume (18.0, 20.0, and 22.0 mL) 100.3 ± 0.96 0.742B, A 0.476B, C
(C) Duration of saturation (20, 30, and 40 min) 99.5 ± 1.58 0.881C, A 0.476C, B
a)%RSD of label claim (n= 6 × 3 = 18)
b)Described the p-values to other factors (A, B, or C) Table 2
Accuracy results of commercial tablets.
Pharmaceutical preparation Ingredient Label claim [%] Recovery (mean ± %RSDb)) Originala)(mean ± %RSD) Added [%]
Commercial tablets Mebhydrolin napadisylate 100.3 ± 1.22 30 100.7 ± 0.73
40 99.3 ± 0.89
50 100.8 ± 1.11
60 100.5 ± 1.00
70 100.1 ± 0.74
a)n= 18
b)Accuracy evaluations were performed in duplicate and three different days (n= 2 × 3 = 6)
Table 3
The recovery curves of the accuracy studies.
Parameters Recovery curvea)
Day 1 Day 2 Day 3
Mean of recovery [%] 99.8 ± 0.82 100.5 ± 0.82 100.3 ± 0.95
Recovery curve equation Xf= -0.04285 + 1.032Xc Xf= -0.07879 + 1.068Xc Xf= -0.00363 + 1.0058Xc
Vbafb) –0.043 ± 0.169 –0.079 ± 0.160 –0.004 ± 0.200
Vbbfc) 1.032 ± 0.135 1.068 ± 0.128 1.006 ± 0.160
a)Experiment was performed on three different days
b)Confidence range of intercept [7]
c)Confidence range of slope [7]
Table 4
Results of precision evaluation.
Measurementa) RSD value [%] (n= 6)b)
1 0.79
2 1.08
3 1.20
a)Each measurement was performed by same analyst and on a different plate and different days.
tical with the standard. This proved that the analyte peaks were not interfered by possible degradation products.
4 Conclusion
The present work showed that the proposed HPTLC densitomet-ric method is simple, rapid, selective, precise, accurate, and robust. This method is suitable for the routine analysis of prod-ucts of similar composition in the pharmaceutical industry
qual-ity control laboratories, especially for developing countries like Indonesia.
References
[1] S. Sweetman(ed.), Martindale 35: The Complete Drug Reference. CD-ROM Version, Pharmaceutical Press, The Royal Pharmaceuti-cal Society of Great Britain (PhP), London, 2007.
[2] ISO (Informasi Spesialite Obat) Indonesia, Volume XXXVII, Ikatan Sarjana Farmasi Indonesia, Jakarta, 2008.
[3] Farmakope Indonesia, edisi IV (Indonesian Pharmacopoei IV), Departemen Kesehatan Republik Indonesia, Jakarta, 1995.
[4] C.S.P. Sastry, T.A.S.R. Prasad, M.V. Suryanarayana, Microchem. Acta 100(1990) 107–112.
[5] L. Wulandari, Indonesian J. Chem. 8(2008) 377–379.
[6] D. Widiretnani, S.L. Wahyuni, F. Kartinsari, G. Indrayanto, J. Liq. Chromatogr. Relat. Technol. 32(2008) 154–165.
[7] W. Funk, V. Damman, G. Donnervert, Qualitaetssicherung in der Analytischen Chemie, VCH Weinheim, New York–Basel–Cam-brige, 1992, pp. 1–36, 161–180.
[8] P. Araujo, J. Chromatogr. B 877(2009) 2224–2234.
[9] M. Yuwono, G. Indrayanto, in: H. Brittain(ed.) Profile of Drug Substances, Excipients and Related Methodology, Vol. 32, Elsevi-er, New York, 2005, pp. 243–258.
[10] J. Ermer, J. Pharm. Biomed. Anal. 24(2001) 755–767.
Ms received: March 30, 2011 Accepted: July 22, 2011 Table 6
Result of degradation studies.
Treatments Content of mebhydrolin napadisylatea) (mean ± %RSD; n= 3)
Bulk substance [%] Tablets [% of label claim]
HCl 2N 92.5 ± 2.14 91.8 ± 3.6
NaOH 2N 98.3 ± 1.83 94.2 ± 0.71
H2O29% 98.3 ± 1.89 98.7 ± 2.22
Dry heat 97.3 ± 0.48 96.4 ± 2.15
UV 254 nm 99.8 ± 1.79 99.5 ± 0.81