ii
DECLARATION
“I hereby declare that the work in this report is my own except for summaries and quotations which have been duly acknowledged.”
Signature : ...
Author : FARHANA BTE MASRON
iii
I dedicate this dissertation to my family, especially… to Dad, Masron b. Ahmad Dasuki and
Mom, Habsah bt. Surip for instilling the importance of hard work and higher education;
to friends, Narissa, Hafizah and Fakhrezah—may you also be motivated and encouraged to reach your dreams;
finally to Hamzaitul Akmarizal,
iv
ACKNOWLEDGEMENTS
In the name of Allah, I was very thankful for His kindness that helps me a lot in facing all challenges to make this project succeed.
A big thank you goes to my supervisor, Mr Mohd Nur Azmi bin Nordin for all his guidance and also sharing knowledge and experiences that help me a lot in completing this project smoothly. I also like to thank to all lecturers and staffs of Faculty of Mechanical Engineering that involved directly or indirectly in giving helps, options and ideas. Also, not forgotten, special thank to the lecturers and staffs of Faculty of Manufacturing Engineering because of their help throughout in this project.
v
ABSTRACT
vi
ABSTRAK
vii
TABLE OF CONTENTS
CHAPTER TITLE PAGE
TITLE PAGE i
DECLARATION ii
DEDICATION iii
ACKNOWLEDGEMENTS iv
ABSTRACT v
ABSTRAK vi TABLE OF CONTENTS vii
LISTS OF FIGURE x
LIST OF TABLE xiv
LIST OF ABBREVIATION AND SYMBOLS xv
CHAPTER 1 INTRODUCTION 1.1 BACKGROUND 1
1.1.1 Polymer 1
1.1.2 Crystallinity In Polymers 2 1.1.3 Melting Temperature, Tm and Glass Transition 6 Temperature, Tg in Polymers 1.1.4 Polymer blends 8 1.1.5 Polypropylene (PP) 10 1.1.6 Polylactide (PLA) 14 1.2 PROBLEM STATEMENTS 17
viii
CHAPTER TITLE PAGE
CHAPTER 2 LITERATURE REVIEW
2.1 INTRODUCTION 19
2.1.1 Tensile and Flexural Test 19 2.1.2 Charpy Impact Test 26
2.2 BIODEGRADABLE POLYMERS 28
2.2.1 Biodegradation of PLA 29
2.3 FTIR SPECTROSCOPY 31
CHAPTER 3 METHODOLOGY
3.1 INTRODUCTION 35
3.2 MATERIALS 36
3.3 SAMPLES PREPARATION 37
3.3.1 PP/PLA Specimens 37
3.3.2 Neat PP Specimens 43
3.4 MECHANICAL TEST 43
3.4.1 Tensile Test 43
3.4.2 Flexure Test 44
3.4.2 Charpy Impact Test 45
3.5 BIODEGRADABLE TEST 46
3.6 FTIR TEST 47
CHAPTER 4 RESULT AND ANALYSIS
4.1 INTRODUCTION 48
4.2 TENSILE TEST RESULT 48
4.3 FLEXURAL TEST RESULT 54
4.4 CHARPY IMPACT TEST 59
4.5 BIODEGRADABLE TEST 60
ix
CHAPTER TITLE PAGE
CHAPTER 5 DISCUSSION
5.1 INTRODUCTION 63
5.2 TENSILE AND FLEXURAL PROPERTIES 63
5.3 IMPACT STRENGTH 68
5.4 BIODEGRADABILITY 69
5.5 FTIR SPECTROSCOPY 70
CHAPTER 6 CONCLUSION AND RECOMMENDATION
6.1 CONCLUSION 68
6.2 RECOMMENDATION ` 69
x
LIST OF FIGURES
FIGURE TITLE PAGE
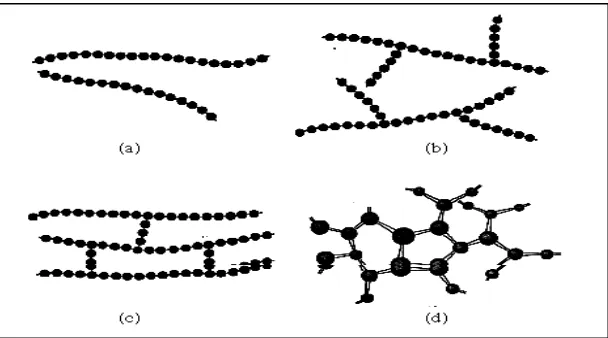
1.1 Schematic illustration of molecular structure of polymers (a) linear, (b) branched, (c) cross-linked and (d) network
2
1.2 Crystalline and amorphous region in polymer 3
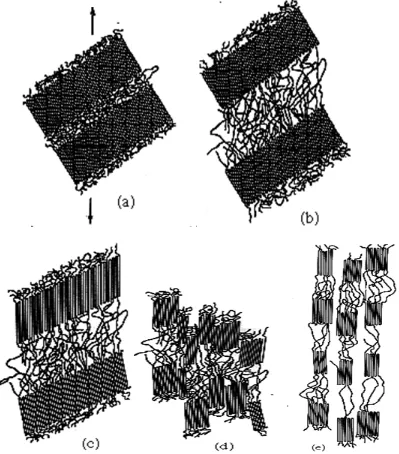
1.3 Schematic of detailed structure of a spherulite 4 1.4 Stages in the deformation of semicrystalline polymer. (a) Two
adjacent chain folded lamellea and interlamellar amorphous material before deformation. (b) Elongation of amorphous tie chains during first stage of deformation. (c) Tilting of lamellar chain folds during the second stage.(d) Separation of the crytalline block segments during the third stage. (e) Orientation of block segments and tie chains with the tensile axis in final stage
5
1.5 Specific volume versus temperature for amorphous (curve A), semicrystalline (curve B) and cystalline (curve C)
7
1.6 Monomer of PP 10
1.7 Monomer of propylene become polypropylene after polymerization
10
1.8 (a) Schematics of metallocene catalyst 11
1.8 (b) Ziegler-Natta catalyst 11
1.9 Mechanism of Ziegler-Natta polymerization process 11
1.10 Tacticity of Polymer 12
1.11 Production of PLA 14
xi
2.1 Universal Tensile Test Machine 20
2.2 Tensile Test Specimens 20
2.3 Stress vs strain curve for tensile test 21
2.4 Tensile strengths of metals, ceramics, polymer and composites/fibers
22
2.5 Flexural test specimens in testing machine 23
2.6 Tensile strength and modulus for PP/lignin blends 24 2.7 Flexural strength and modulus for PP/lignin blends 24
2.8 Stress-strain curves for PLA/PCL blends 25
2.9 Flexural strength of PLA/PCL blends 25
2.10 Charpy Impact test instrument 26
2.11 Classification of Biodegradable Polymers 28
2.12 PLA hydrolysis and molecular weight loss 30
2.13 Degradation of PLA under landfill condition 31
2.14 Wavenumber at characteristic frequencies 32
2.15 Wavenumber of PP using FTIR 33
2.16 Wavenumber of lactic acid (LA) and PLA using FTIR 34
3.1 Flow Chart of the fabrication process 36
3.2 HAAKE Internal Mixer 38
3.3 (a) Compound of PP/PLA polymer blends 38
3.3 (b) Pellet size of PP/PLA polymer blends 38
3.4 Crusher Machine 39
3.5 Pellet size of PP/PLA compound placed in mold 39
3.6 Hot Press Machine 40
3.7 Plate shape of PP/PLA polymer blends 40
3.8 Sample Cutter Machine 41
3.9 (a) Dimension of tensile test specimen 41
3.9 (b) Specimen of tensile test 41
3.10 (a) Dimension for bending test 42
3.10 (b) Specimen for bending test 42
xii
3.11 (b) Specimen of Charpy Impact test 42
3.12 Shimadzu Universal Testing Machine 43
3.13 (a) Specimen during testing 44
3.13 (b) Specimen after break 44
3.14 Specimen of bending test during testing 45
3.15 Charpy Impact Tester 45
3.16 Samples placed before buried in soil for biodegradable test 46
3.17 PerkinElmer Spectrum 100 FTIR Spectrometer 47
4.1 Stress-strain diagrams for Neat PP specimens 49 4.2 Stress-strain diagrams for PP/PLA 5 wt% specimens 50 4.3 Stress-strain diagrams for PP/PLA 10 wt% specimens 52 4.4 Stress-strain diagrams for PP/PLA 15 wt% specimens 53 4.5 Stress-strain diagrams for Neat PP specimens 54 4.6 Stress-strain diagrams for PP/PLA 5 wt% specimens 55 4.7 Graph of stress versus strain for PP/PLA 10 wt% specimens 57 4.8 Stress versus strain for PP/PLA 15 wt% specimens 58
4.9 FTIR spectra for Neat PP 61
4.10 FTIR spectra for Neat PLA 61
5.1 Stress-strain diagrams for Neat PP, PP/PLA 5 wt%, PP/PLA 10 wt% and PP/PLA 15 wt% specimens
64
5.2 Graph of tensile strength and Young’s modulus for Neat PP, PP/PLA 5 wt%, PP/PLA 10 wt% and PP/PLA 15 wt%
65
5.3 Stress-strain diagrams for Neat PP, PP/PLA 5 wt%, PP/PLA 10 wt% and PP/PLA 15 wt% specimens
66
5.4 Graph of flexural strength and flexural modulus for Neat PP, PP/PLA 5 wt%, PP/PLA 10 wt% and PP/PLA 15 wt%
67
5.5 Graph of average impact energy for Neat PP, PP/PLA 5 wt%, PP/PLA 10 wt% and PP/PLA 15 wt %
68
5.6 Graph of different weight percentage of Neat PP, PP/PLA 3 wt%, PP/PLA 5 wt%, PP/PLA 10 wt% and PP/PLA 15 wt% specimens
xiii
5.7 FTIR spectra for Neat PP, PP/PLA 5 wt%, PP/PLA 10 wt% and PP/PLA 15 wt%
xiv
LIST OF TABLES
TABLE TITLE PAGE
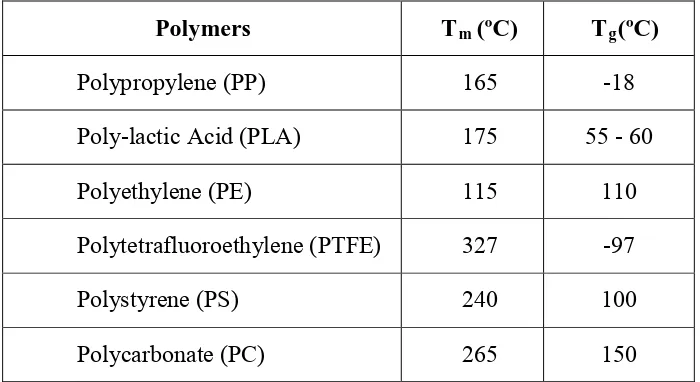
1.1 Melting and Glass Transition Temperatures for Some of Common Polymeric Materials
8
1.2 Mechanical properties 13
1.3 Mechanical properties of PLA 16
3.1 Properties of PP and PLA 37
3.2 Weight percentage (wt%) of PP and PLA for each type specimen
37
3.3 Weight of specimens for biodegradable test 46
4.1 Tensile properties for Neat PP specimen 49
4.2 Tensile properties for PP/PLA 5 wt% specimens 51 4.3 Tensile properties for PP/PLA 10 wt % specimens 52 4.4 Tensile properties for PP/PLA 15 wt% specimens 53
4.5 Flexural properties for Neat PP specimens 55
4.6 Flexural properties for PP/PLA 5 wt% specimens 56 4.7 Flexural properties for PP/PLA 10 wt% specimens 57 4.8 Flexural properties for PP/PLA 15 wt% specimens 58 4.9 Energy absorb by the Neat PP, PP/PLA 5 wt%, PP/PLA 10
wt% and PP/PLA 15 wt% specimens
59
4.10 Weight of Neat PP, PP/PLA 3 wt%, PP/PLA 5 wt%, PP/PLA 10wt % and PP/PLA 15 wt% specimens for eight weeks
60
5.1 Tensile properties for Neat PP, PP/PLA 5 wt%, PP/PLA 10 wt% and PP/PLA 15 wt % specimens
64
5.2 Average flexural strength, strain and flexural modulus for Neat PP, PP/PLA 5 wt%, PP/PLA 10 wt% and PP/PLA 15 wt%.
xv
LIST OF ABBREVIATION AND SYMBOL
PP = Polypropylene
PLA = Polylactic Acid
PE = Polyethylene
PS = Polystyrene
HDPE = High Density Polyethylene LDPE = Low Density Polyethylene PPO = poly(dimethylphenylene oxide
UV = Ultra Violet
EPDM = Ethylene–Propylene–Diene Elastomer FTIR = Fourier Transform Infra Red
SDN.BHD. = Sendirian Berhad Tm = Melting temperature
Tg = Glass Temperature
m = Meter
mm = milimeter
g = gram
°C = degree Celcius
σ = Stress
E = Young’s modulus
1
CHAPTER 1
INTRODUCTION
1.1 BACKGROUND
1.1.1 POLYMER
Polymer is a particular class of macro-molecules that consist of repeated chemical units, also called monomer, joined end to end, or possible in more complicated ways by covalent bonds to form a chain molecule. In a simple word, polymer means a chain of monomers repeated and linked with each other to produce a long chain. If there are only one monomer repeated in a chain, it is called homopolymer but copolymer occur when more than one monomer present. Carbon and hydrogen are the most common atoms in monomer but other atom may be present such as oxygen, nitrogen, and silicon. Some of the common polymers are polyethylene (PE), polystyrene (PS) and polypropylene (PP) [1]. Polymers also has many possible classification which are the type of polymerization process used to process them, structure of the polymer whether it is linear, branched or network polymer, and also based on their properties whether it is thermoplastics or thermosetting [2].
2
branch chains connected to the main chain. In cross-linked polymer, a few linear chains are joined together at various positions by covalent bonds such as rubber. The term of network polymer is when multifunctional monomers that have three or more active covalent bands form three dimensional networks and epoxies belong to this group [3].
Figure 1.1 Schematic illustration of molecular structure of polymers (a) linear, (b) branched, (c) cross-linked and (d) network [4]
Linear and branched polymers form a class of materials known as thermoplastic. A thermoplastic material is a high molecular weight polymer that is not cross linked. That is why these materials flow when give heat and can be molded into many shapes which they retain when cool but differ with the thermosetting materials. A thermosetting material is a heavy cross-linking material and once the cross-links form; these polymers cannot be changed anymore without destroying the plastics.
1.1.2 CRYSTALLINITY IN POLYMERS
3
tensile strength and opacity (due to light scattering) also increased. Amorphous polymers are usually less rigid, easily to deformed and often transparent. The factors that influence the degree of crystallinity are chain length, chain branching and interchain bonding. Crystallinity in a polymer is very important in order to determine its properties. The more crystalline region in the polymer, the stronger and less flexible it become.
Figure 1.2 Crystalline and amorphous region in polymer [3]
For example, high density polyethylene (HDPE) form from very long unbranched hydrocarbon chains. These chains pack together easily in crystalline region and also alternate with amorphous region and finally produce the relatively strong and stiff. Compared to the low density polyethylene (LDPE) that form from smaller and many branched chains, these do not easily adopt crystalline structures. This polymer is softer, weaker, low density and easily deformed compared to HDPE. As a result, mechanical properties such as ductility, tensile strenght and hardness rise directly proportional to tha chain length [4].
4
region, tie-chain molecules act as connecting links between adjacent lamellar. The surface of adjacent spherullites start to impinge on one another when the crystallization of a spherullitic structure near completion.
Figure 1.3 Schematic of detailed structure of a spherulite [4]
5
important to choose the right polymer because each polymer has different crystallinity and also has different properties.
Figure 1.4 Stages in the deformation of semicrystalline polymer. (a) Two adjacent chain folded lamellea and interlamellar amorphous material before deformation. (b) Elongation of amorphous tie chains during first stage of deformation. (c) Tilting of
lamellar chain folds during the second stage.(d) Separation of the crytalline block segments during the third stage. (e) Orientation of block segments and tie chains with
6 1.1.3 MELTING TEMPERATURE, Tm AND GLASS TRANSITION
TEMPERATURE, Tg IN POLYMER
At the melting temperature, Tm, the crystalline of polymers will lose their
structure or melt. Tm depends on crystallinity, if crystallinity increases so does Tm. The
melting of polymers takes place over a range of temperatures. The melting behaviour depends on temperature which it crystallizes. Impurities in the polymers also decrease the melting temperature.
The stiffness of the chain controlled by the ease of rotation about the chemical bonds along the chain give the huge effect. The chain flexibility can be lower by the presence of double bonds and aromatic groups in the polymer backbone and finally increase the Tm. The size and type of side groups influence the chain rotational freedom
and flexibility and raise of Tm. Table 1.1 showed that PP has a higher Tm than PE which
are 175°C and 115°C respectively. It is because methyl group in PP is larger than the hydrogen atom in PE and this increase the Tm [3].
Glass temperature, Tg is the temperature where the polymers lose their structural
mobility of polymer chains and become rigid glass. The polymer will behave in increasingly brittle manner if the temperature drops below Tg and becomes more
rubber-like if the temperature rise aboveTg. The Tg also known as the temperature at which the
molecules of the material move enough so that can be processed and polymers tend to be brittle below the Tg [6]. The value of Tg depends on molecular characteristics that affect
chain stiffness, and all factors are same as the Tm. Thus, Tm and Tg is important during
selecting materials for various applications.
Figure 1.5 is the Tm and Tg for amorphous, semicrystalline and crystalline
materials respectively. For crystalline material (curve C), there is discontinuous changes in specific volume at Tm while the amorphous material (curve A), the curve is
7
Melting process involves the breaking of inter-chain bonds, so the glass and melting temperature depend on chain stiffness, molecular shape and size, side branches and cross-linking [5]. The right temperature must be setup because high temperature may degrade the polymer or destroy the chain and additives may decompose. If temperature is too low, the structure fails to achieve the required homogeneity and thus will reduce impact resistance [6]. Dwell time in process also play crucial role. If higher dwell time given, thermal decomposition may take place even the melt temperature is correct but if too short, the melt will not have time to fully homogeneous.
8
Table 1.1 Melting and Glass Transition Temperatures for Some of Common Polymeric Materials [3,9]
Polymers Tm (ºC) Tg(ºC)
Polypropylene (PP) 165 -18
Poly-lactic Acid (PLA) 175 55 - 60
Polyethylene (PE) 115 110
Polytetrafluoroethylene (PTFE) 327 -97
Polystyrene (PS) 240 100
Polycarbonate (PC) 265 150
1.1.4 POLYMER BLENDS
Polymer blends occur when two or more different polymers mixed together. There are two types of polymer blends which are miscible and immiscible polymer blends. For miscible polymer blends, the miscibility and homogeneity extend down to the molecular lever which is no phase separation occur to the polymer. For immiscible polymer blends, there are phase separations occurs and sometimes called compatible blends. The compatible blends are also polymer alloy [11,14]. The light scattering, X-ray scattering, and neutron scattering can be used in order to investigate the phase of polymer blends.
![Figure 1.2 Crystalline and amorphous region in polymer [3]](https://thumb-ap.123doks.com/thumbv2/123dok/560065.66101/19.612.207.447.186.402/figure-crystalline-amorphous-region-polymer.webp)
![Figure 1.5 Specific volume versus temperature for amorphous (curve A), semicrystalline (curve B) and cystalline (curve C)[4]](https://thumb-ap.123doks.com/thumbv2/123dok/560065.66101/23.612.207.446.287.542/figure-specific-volume-versus-temperature-amorphous-semicrystalline-cystalline.webp)