i
EFFECTS OF SIMULATED SHIP TRANSPORT ON THE
SUSCEPTIBILITY OF THE GREEN MUSSEL
Perna viridis
TO HEAT STRESS
YASSER AHMED
GRADUATE SCHOOL
BOGOR AGRICULTURAL UNIVERSITY BOGOR
iii
ISSUES RELATED TO THIS THESIS AND THE SOURCE OF INFORMATION
With this I declare that this thesis with title Effects of Simulated Ship Transport On The Susceptibility Of The Green Mussel Perna viridis To Heat Stressis my own work under the direction of an advisory committee. It has not yet been presented in any form to any Education institution. The sources of information which is published or not yet published by other researchers have been mentioned and listed in the references of this thesis.
Bogor, July 2013
Yasser Ahmed C551100021
iv
RINGKASAN
YASSER AHMED. Pengaruh simulasi transportasi kapal terhadap kerentanan Kerang Hijau Perna viridis pada stress suhu yang meningkat. Dibawah bimbingan NEVIATY PUTRI ZAMANI and KAREN VON JUTERZENKA.
Pergerakan organisme dipengaruhi oleh penyebaran alami dan aktivitas manusia. Spesies yang terbawa memiliki sebaran yang melebihi distribusi batas normal oleh pengaruh tertentu (vector). Pergerakan organisme secara alami memiliki pergerakan yang terbatas. Spesies yang terbawa dapat mempengaruhi kerentanan pada stress yang baik disengaja maupun tidak disengaja. Spesies yang terbawa karena pengaruh alam seperti organisme yang bergerak akibat pergerakan arus dan beberapa organisme ada yang dapat bermigrasi ke area yang lain yang dapat melalui pergerakan arus; spesies yang terbawa akibat pengaruh aktivitas manusia baik disengaja seperti perdagangan ikan hias, aktivitas budidaya atau kegiatan manusia yang tidak disengaja seperti masukan air ballast dalam kapal (Baker et al. 2007). Air ballast digunakan untuk menjaga keseimbangan kapal dan beberapa organisme memiliki kemampuan untuk menempel pada permukaan atau dinding dari tanki air ballast kapal tersebut (Mead et al., 2011). Pada umumnya membawa barang-barang, akan tetapi juga membawa organisme yang ada dalam badan atau tanki air ballast kapal (Kölzsch and Blasius, 2011). Pertanyaannya adalah apa yang terjadi pada spesies yang terbawa selama transportasi kapal? Spesies yang terbawa terdapat berbagai mekanisme (vector) yang tersedia untuk membawa organisme yang bersifat invasi akibat pengaruh perjalanan kapal dan menyebar dalam jumlah yang besar; akan tetapi hanya dalam jumlah kecil yang dapat bertahan dan menjadi pesaing (competitor) dengan spesies asli dalam mendapatkan makanan di lingkungan yang baru, sehingga ini disebut sebagai spesies yang invasif (invasive species). Spesies yang berinvasif dianggap sebagai spesies pendatang atau tidak asli yang dapat menyebabkan kerusakan ekosistem, sehingga berdampak pada perekonomian setempat, dan juga kesehatan masyarakat (Bax et al., 2003; ISAC, 2006).
v
Tentunya hasil yang didapat oleh Lenz et al (2011) menarik dan oleh karena itu perbedaan yang menonjol pada masing-masing spesies memiliki toleransi terhadap stress yang berbeda pula. Satu peluang dalam menjelaskan observasi ini adalah apa yang terjadi pada kondisi yang kritis bagi spesies selama transportasi yang terdapat pada badan dan tanki air ballast kapal.
Spesies yang terbawa oleh kapal semakin meningkat sejak abad yang lalu (Mead et al., 2011), dan tentunya perlu meniru atau simulasi transportasi kapal untuk mengetahui apakah spesies yang terbawa dapat meningkat ketahanannya selama transportasi. Tujuan dari penelitian ini untuk menginvestigasi apakah P. viridis dapat meningkatkan toleransi terhadap suhu selama transportasi. Pendekatan eksperimen ini sebaiknya memiliki keterkaitan dengan transportasi kapal dan dibuat secara sederhana. Desain penelitian ini disesuaiakan dengan kondisi di laboratorium. Hipothesis dari penelitian ini adalah grup pre stress dapat meningkatkan toleransinya selama transportasi.
Berdasarkan hasil yang didapat dari penelitian ini menunjukkan bahwa P. viridis tidak dapat meningkatkan toleransinya terhadap suhu selama simulasi transportasi kapal, dan juga terdapat penurunan jumlah benang byssus, serta penurunan berat badan selama transportasi.
vi
SUMMARY
YASSER AHMED. Effects Of Simulated Ship Transport On The Susceptibility Of The Green Mussel Perna viridis To Heat Stress. Under supervised by NEVIATY PUTRI ZAMANI and KAREN VON JUTERZENKA.
The introduced species are species which exceed their natural distribution limits (native range) by a certain mode of introduction (vector). Natural movements are responsible to limited extent. These introduction of a species could influence the susceptibility of a species to environmental stress no matter if introduced purposely or unpurposely. Introduction of species can happen caused by natural movement i.e. organism can movement influenced by current and some organism can migrate to one area to other area; and human activity either purposely i.e. aquarium trade, aquaculture or unpurposely such as accidentally through fouling on ship hulls (Baker et al., 2007). But dominant vector which have large contribution on species introduction is transport by ship hulls and ballast water tanks (Mead et al., 2011). Ballast water tank used to keep the balancing of the ship and some organism has ability to attach on the wall of ship hulls. Introduction species by ships mostly happened where a lot of traffic journey of cargo ship bigger than 10.000 GT during 2007 (Kaluza et al., 2010). Based on data from Global cargo ship network (GCSN), shipping moves over 80 % of the world the goods. The problem is that ships do not only bring the goods but also bring species in the ship hulls and ballast water tank (Kölzsch and Blasius, 2011). The question is what happened to transport condition? For introduction of species, there are a wide variety of transfer mechanisms (vectors) available for hitchhiking of marine invaders to travel and spread in large amount of individuals; but only small amount of individuals can be robust and act as competitors to get food supply in the new environment, it called invasive species. Marine invasive species are defined as non-native species that cause or are likely to cause harm to ecosystems, economies, and or public health (Bax et al., 2003; ISAC, 2006).
Based on Lenz et al (2011), they compare native and non-native marine invertebrates regarding their tolerance to stress. Six Bivalve (native named first): Brachidontes exustus and Perna viridis (Trinidad), P. perna and Isognomon bicolor (Brazil), Saccostrea glomerata and Crassostrea gigas (New Zealand); two Ascidians: Diplosoma listerianum and Didemnum vixellum (Wales); and two Crustaceans: Gammarus zaddachi and G. tigrinus (Finland) has been investigated. They found that non native are more resistant towards environmental stress, such as desalination, warming and hypoxia, than taxonomically related and ecologically similar native species. Kleunen et al. (2010) said that tolerance towards abiotic stress is a key trait that determines the invasiveness of species. Furthermore, this was surprise and therefore pronounced differences in tolerant towards stress exist between different species. One possible explanation for this observation are adverse condition during transport, e.g. in the ship hulls and ballast water tanks of cargo vessels.
vii
increase their tolerance during transport. The objective for this experiment is to investigate whether P. viridis can increase their tolerance during transport. The experimental approach have connection with simulated ship transport and be rather simple. This experimental design is design to mimicking transport condition in short term lab experiments. Hypothesis for this experiment is pre stress group can increase their tolerance during transport.
Based on the result shows that P. viridis could not increase their tolerance during simulated ship transport, and they decrease amount of byssus threads, also they decrease their weight during transport.
viii
Copyright © 2013 Bogor Agricultural University Copyright are Protected by Law
1. It is a prohibited to cite all or part of this thesis without referring to and mentioning the source.
a. Citation only permitted for the sake of education, research, scientific writing, report writing, critical writing, or reviewing scientific problem. b. Citation doesn’t inflict the name and honor of Bogor Agricultural
University.
ix
EFFECTS OF SIMULATED SHIP TRANSPORT ON THE
SUSCEPTIBILITY OF THE GREEN MUSSEL
Perna viridis
TO HEAT STRESS
YASSER AHMED
Thesis
as one of the requirements for achieving Master of Science degree in
Marine Science Program
GRADUATE SCHOOL
BOGOR AGRICULTURAL UNIVERSITY BOGOR
x
Outside Committee Examiner on Thesis Examination:
xi
Title : Effect of simulated ship transport on the susceptibility of the Green Mussel Perna viridis to heat stress.
Name : Yasser Ahmed NIM : C551100021
Approved by Advisory Commiteee
Dr. Ir. Neviaty P. Zamani, M.Sc.
(Head)
Dr. Karen von Juterzenka
(Member)
Known by
Head of Marine Science Program
Dr. Ir. Neviaty P. Zamani, M.Sc.
Dean of Graduate School
Dr. Ir. Dahrul Syah, M.Sc.Agr.
Date of Examination: July 8th 2013
xii
PREFACE
Praise and thanksgiving the author to Allah SWT for the bounty so that this thesis succesfull to done. Choosen of theme on this experiment was done on April to September 2012 and related with the survival of Green Mussel Perna viridis, the title are Effect of Simulated Ship Transport On The Susceptibility Of Green Mussel Perna Viridis To Heat Stress.
The author want to say thanks to Dr. Neviaty P. Zamani, Dr. Karen von Juterzenka, and Dr. Mark Lenz as supervisor. On other hand, the author give thanks to my partner for the experiment in Indonesia are Armin Fabritzek and other participant of GAME-X Project.
Hopefully this thesis could be useful.
Bogor, July 2013
xiii
ACKNOWLEDGEMENT
The author want to say thank you to all the parties who supports and help, so that this research and thesis can be done.
1. Parents (Nasrun Tasila and Juliani also Djarot Soedarsono and Sri Ulfah Hartati), Lettu (Inf) Nasser Khaled and Leila Nabila (Brother and Sister)
and all the family who patiently supports, inspires, motivate, help, and pray for keep reminding to do the best, on time, always learn, humble, and work hard and smart for the better and the best to reach the goals.
2. Wife (Dian Respati Widianari) who support, inspires, motivate, help, as best friend to discuss and share, and pray to achieve our dreams also for keep reminding to do the best, on time, always learn, humble, and work hard and smart for the better and the best to reach the goals.
3. Dr. Ir. Neviaty Putri Zamani, M.Sc. as the head of advisory committee and head of Marine Science Program who patiently give support, advice, help, and time through finishing of this thesis.
4. Dr. Karen Von Juterzenka as member of advisory committee who gave a lot of support, help, time, advice, new experience (for me), and share knowledge and fun through finishing of this thesis.
5. Dr. Mark Lenz and Prof. Martin Wahl as project coordinator Global Approach by Modular Experiment (GAME X) from Geomar – Germany who gave the opportunity to join their project and broaden my knowledge, experience, and network.
6. GAME-X Team: Armin Fabritzek (my partner), Felipe Ribeiro and Lisa Oberschelp (Team Brazil), Sandra Eichorn and Miguel Angel Penna (Team Chile), Marie Garcia and Filipa Antunes (Team Portugal)
7. Prof. Dr. Ir. Dedi Soedharma, DEA as outside examiner committee who help a lot giving advise thoroughly through this thesis so that this thesis can be better.
xiv
9. Friends in Marine Science Program class 2010 Bogor Agricultural University (Abd Muthalib Angkotasan, Adi Purwandana, (Alm) Yuida Labetubun, Evangelin Kadmaer, Rezi Apri,Princy(for all the listening, help, and many moments together)
10. Friends in Marine Habitat Lab (Dr. Michael K. Schmid, Mareike Huhn,
Nurina Ayu, Rebecca Mueller, Giannina Hattich, Titan, Shelly Tutupoho, Andre Wizemann, Veronica, David, Wira, Nora Hase (for helping and accompanying study) thank you for all the good times, laugh, advise, critics, info, support, and help during we study and working together.
11. Dondy Arafat, thank you for helping in providing seawater to the lab.
12. Aris and Pak Baso as Fisherman in Muara Kamal who helped us to take sample in Jakarta Bay.
xv
Vector of marine introduction 6
Stressors 8
Organism choice and sample sites 17
Sampling and transport the organism 19
Acclimation and feeding 20
Experimental design and data analysis 21
Laboratorium experiment 23
Set up and main experiment 25
Response variables 26
Survivorship, Byssus, Body condition index (BCI) 26
Position of mussels 27
Response behaviour 27
Daily routine 28
4. RESULTS AND DISCUSSION 29
Results 29
Species identification 29
Acclimation 29
xvi
CONTENTS (continued)
Survivorship of the mussels during the pilot study 29 Performance of the mussels during the main experiment 30
Survival 30
Byssus 32
Body condition index (BCI) 32
Position of mussels 33
Response behaviour 36
Discussion 40
Adverse condition during transport 40
Number of byssus during transport 41
Growth performance during transport 41
Position of mussels during transport 41
Response behaviour during transport 42
5. CONCLUSION AND SUGGESTION 43
Summary 43
Suggestion 43
xvii
LIST OF TABLES
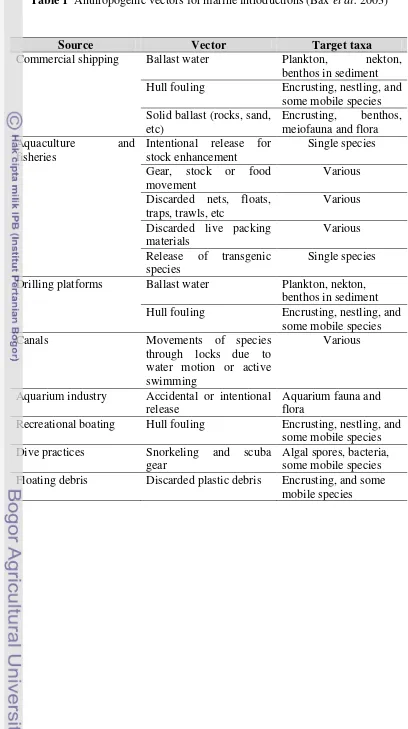
1. Anthropogenic vectors for marine introduction (Bax et al, 2003) 7 2. Materials that was used to perform this experiment 14
LIST OF FIGURES
1. (a) Cumulative number of marine introduced species recorded since 1840. (b) Liner regression indicating rate of discovery of
marine introduced species since 1840 (Mead et al., 2011) 4 2. The trajectories of all cargo bigger than 10.000 GT during 2007.
The colour scale indicates the number of journeys along each routes. Ships are assumed to travel along the shortest (geodesic)
paths on water (Kaluza et al., 2010) 5
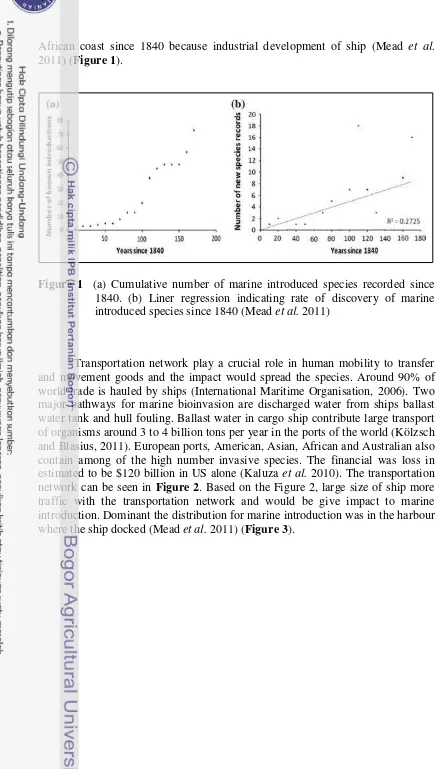
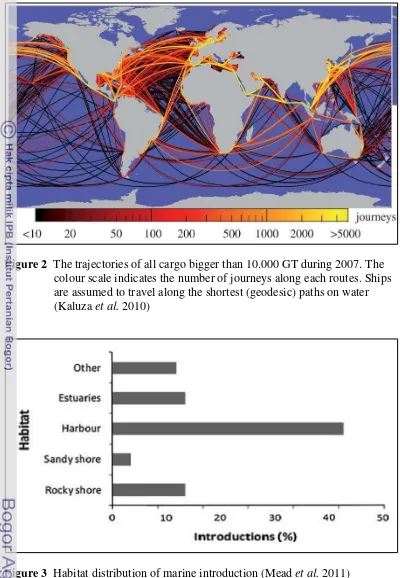
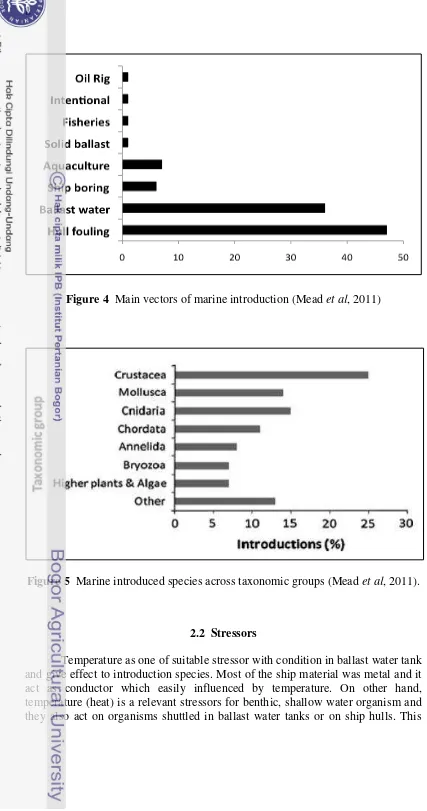
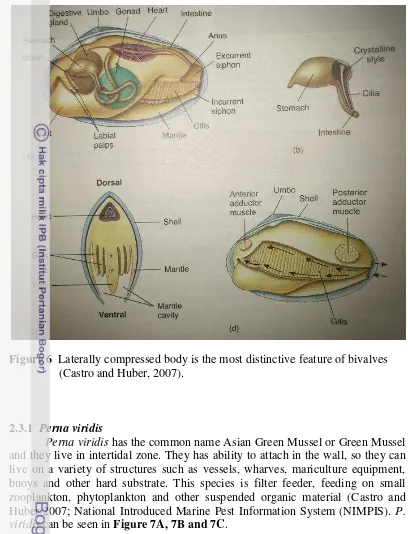
3. Habitat distribution of marine introduction (Mead et al., 2011) 5 4. Main vectors of marine introduction (Mead et al., 2011) 8 5. Marine introduced species across taxonomic groups (Mead et al., 2011) 8 6. Laterally compressed body is the most distinctive feature of
bivalves (Castro and Huber, 2007). 10
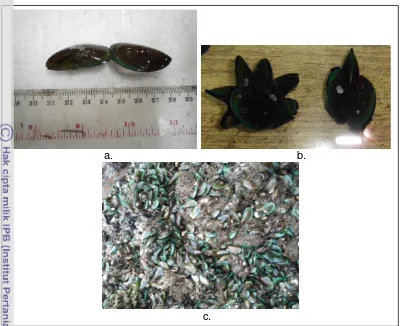
7. (a). Perna viridis were measured in a ruler; (b) Perna viridis
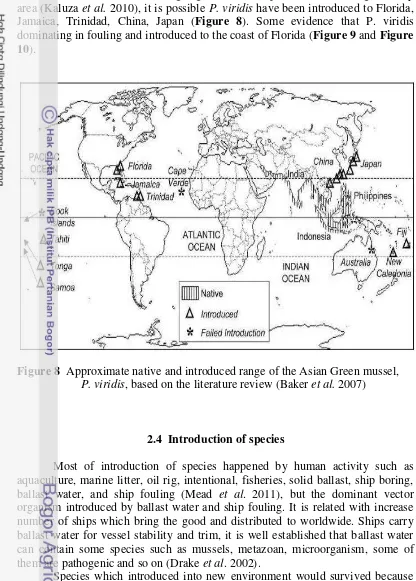
on the glass tank; (c) Fresh harvest of Perna viridis 11 8. Approximate native and introduced range of the Asian Green Mussel
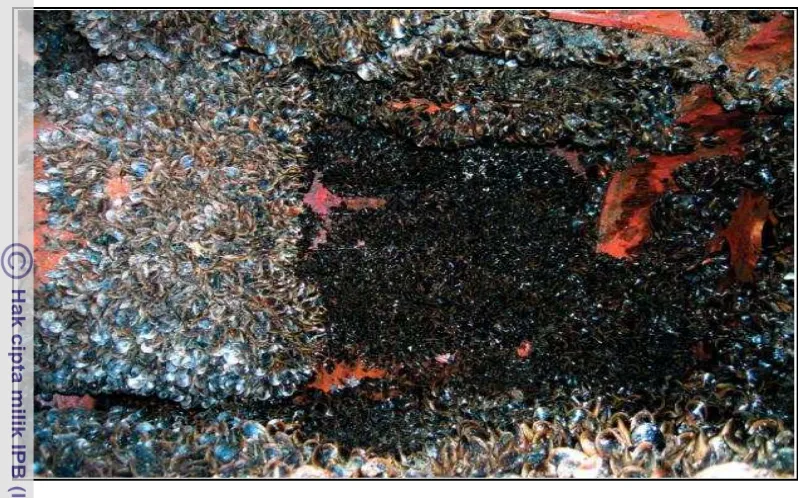
P. viridis, base on the literature review (Baker et al. 2007) 12 9. Mytillus galloprovincialis dominating fouling assemblages in the
sea chest of the SA “Agulhas” (Lee and Chown, 2007) 13 10. Asian Green Mussel, P. viridis (dark object) and Eastern Oyster,
Crassostrea virginica (white object) on a bridge pier in Tampa Bay, Florida, USA, at low tide in 2001. The majority of mussels in this
photo are 2-3 cm in shell length. (Baker et al. 2007) 13 11. (a). P. viridis; (b). Fresh harvest of mussels from Jakarta Bay 18 12. (a).Muara Kamal, Jakarta Bay; (b). Sub-district Muara Kamal;
(c). Muara Kamal in Java Island (red colour)
(Created by: Annisa Indah Sari, 2012) 18
13. Sampling organisms and measured the size;
(b) Mussels in the cool box; (c) Cleaned the mussels 19
14. Acclimation tanks in the lab. 20
15. Simulated ship transport from Europe to Australia. 22 16. Mimicking transport condition for this experiment 22
17. Main groups for this experiment 23
18. Scheme of pilot study 24
19. (a). Single containers on the fiber tanks for pilot study;
(b) Each containers fixed in the frame for pilot study 25 20. (a). Wooden frame for thermal stress phase; (b). Rubber
xviii
LIST OF FIGURES (continued)
21. Measuring BCI of the mussels. 27
22. (a) Water exchanged; (b) Feeding the mussels 28
23. Survivorshipof the mussels connected with
temperature duringpilot study. 30
24. Survivorship of the mussels for pre stress group without
recovery 31
25. Survivorship of the mussels for pre stress group with
recovery 31
26. Byssus of the mussels for each groups 32
27. Body condition index (BCI) of the mussels each period 33 28. Position of mussels for group B (stress group without
recovery) (S: surface; M: middle; B: bottom; Ai: air stone;
NA: not attach) 33
29. Position of mussels for group BC (non stress group
without recovery) (S: surface; M: middle; B: bottom; Ai: air
stone; NA: not attach) 34
30. Position for control group (S: surface; M: middle; B: bottom;
Ai: air stone; NA: not attach) 34
31. Position of mussels for group A (stress group with recovery),
(S: surface; M: middle; B: bottom; Ai: air stone; NA: not attach) 35 32. Position of mussels for group C (non stress group with recovery)
(S: surface; M: middle; B: bottom; Ai: air stone; NA: not attach) 35 33. Position for control group (S: surface; M: middle;
B: bottom; Ai: air stone; NA: not attach) 36
34. Response behaviour group B (stress group without
recovery) (F: Fast; C: Closed; S: Slow) 37
35. Response behaviour group BC (non stress group
without recovery) (F: Fast; C: Closed; S: Slow) 37 36. Response behaviour for control (F: Fast; C: Closed; S: Slow) 38 37. Response behaviour group A (stress group with recovery)
(F: Fast; C: Closed; S: Slow) 38
38. Response behaviour group C (non stress group with recovery)
(F: Fast; C: Closed; S: Slow) 39
1
1 INTRODUCTION
1.1 Background
The introduced species are species which exceed their natural distribution limits (native range) by a certain mode of introduction (vector). Natural movements are responsible to limited extent. These introduction of a species could influence the susceptibility of a species to environmental stress no matter if introduced purposely or unpurposely. Introduction of species can happen caused by natural movement i.e. organism can movement influenced by current and some organism can migrate to one area to other area; and human activity either purposely i.e. aquarium trade, aquaculture or unpurposely such as accidentally through fouling on ship hulls (Baker et al. 2007). But dominant vector which have large contribution on species introduction is transport by ship hulls and ballast water tanks (Mead et al. 2011). Ballast water tank used to keep the balancing of the ship and some organism has ability to attach on the wall of ship hulls. Introduction species by ships mostly happened related with a lot of traffic journey of cargo ship bigger than 10.000 GT during 2007 (Kaluza et al. 2010). Based on data from Global Cargo Ship Network (GCSN), shipping moves over 80 % of the world the goods. The problem is that ships do not only bring the goods but also bring species in the ship hulls and ballast water tank (Kölzsch and Blasius, 2011). The question is what happened to transport condition? For introduction of species, there are a wide variety of transfer mechanisms (vectors) available for hitchhiking of marine invaders to travel and spread in large amount of individuals; but only small amount of individuals can be robust and act as competitors to get food supply in the new environment, it called invasive species. Marine invasive species are defined as non-native species that cause or are likely to cause harm to ecosystems, economies, and or public health (Bax et al. 2003; ISAC, 2006).
Based on Lenz et al (2011), they compare native and non-native marine invertebrates regarding their tolerance to stress. Six Bivalve (native named first): Brachidontes exustus and Perna viridis (Trinidad), P. perna and Isognomon bicolor (Brazil), Saccostrea glomerata and Crassostrea gigas (New Zealand); two Ascidians: Diplosoma listerianum and Didemnum vixellum (Wales); and two Crustaceans: Gammarus zaddachi and G. tigrinus (Finland) has been investigated. They found that non native are more resistant towards environmental stress, such as desalination, warming and hypoxia, than taxonomically related and ecologically similar native species. Kleunen et al. (2010) said that tolerance towards abiotic stress is a key trait that determines the invasiveness of species. Furthermore, this was surprise and therefore pronounced differences in tolerant towards stress exist between different species. One possible explanation for this observation are adverse condition during transport, e.g. in the ship hulls and ballast water tanks of cargo vessels.
2
transport. The experimental approach have connection with simulated ship transport and be rather simple. This experimental design is design to mimicking transport condition in short term lab experiments. Hypothesis for this experiment is pre stress group can increase their tolerance during transport.
This research was conducted as part of the Global Approach by Modular Experiment (GAME-X) project, to do a latitudinal comparison of susceptibility to stress with theme “Do adverse condition during transport select for stress tolerant genotypes in founder population of native and non-native marine invertebrates”.
1.2 Objectives
The objective for this experiment is to investigate whether P. viridis can increase their tolerance during transport.
1.3 Hypothesis
3
2 LITERATURE REVIEW
2.1 Transport of organisms
Transportation network play crucial role in human mobility, distributed the goods and spread species. Transport of organisms has two factors was natural movements and human activity. Large contribution to transport of organism was caused transportation of ships where most of world trade is hauled by ships and 7,4 billion tons of goods were spread to the worldwide (International Maritime Organization (IMO), 2006) and also spread of species.
2.1.1 Natural dispersal
At first movement of organisms influenced by natural dispersal. Some organism has limited movements so that they follow natural influence by current (plankton) and other organism can migrates through the ocean current such as sea turtle, whales etc. Perna viridis are similar to those of Mytilus species but no one has determined whether P. viridis has a planktonic postlarval phase like some found anywhere was occurred in globalization times because of anthropogenic factors (Baker et al. 1999).
2.1.2 Human mediated dispersal
4
African coast since 1840 because industrial development of ship (Mead et al. 2011) (Figure 1).
Figure 1 (a) Cumulative number of marine introduced species recorded since 1840. (b) Liner regression indicating rate of discovery of marine introduced species since 1840 (Mead et al. 2011)
5
Figure 2 The trajectories of all cargo bigger than 10.000 GT during 2007. The colour scale indicates the number of journeys along each routes. Ships are assumed to travel along the shortest (geodesic) paths on water (Kaluza et al. 2010)
6
2.1.3 Vector of marine introduction
Increasingly the introduction of alien species is a major threat to marine biodiversity and a contributor to environmental change. As these marine introduction, intentional and accidental can result from numerous human mediated activities, management responses need to cover a diverse range of human activity. Based on historical data, a new marine or estuarine species establishes itself every 32-85 weeks in each of six ports studied in the US, New Zealand and Australia, a rate that appears to be increasing. While many of the alien species become part of the background flora and fauna, others become invasive and come to dominate the native flora and fauna. There are 15 broad categories of vectors that transport marine organisms from shallow coastal waters to similar habitats outside the species home range which can be seen in Table 1 (Bax et al. 2003).
The main economic and social impacts of invasive alien marine species are negative impacts on human health and decrease in economic production of activities based on marine environments and resources such as fisheries, aquaculture, tourism and marine infrastructure. These affect have related social impacts through decreases in employment in economic activities directly affected
by invasive alien species but also through decreases in people’s welfare from the
reduced quality of their environments and natural surroundings. Some vectors for alien marine species was happened caused human activity by vessel for trading commodities and vessel for recreation. In the modern era, increase size of vessel will give effect to introduction of organisms. Some case in Australia ports, one of kind mussels P. viridis was introduce to Darwin harbour (Bax et al. 2003).
7
Table 1 Anthropogenic vectors for marine introductions (Bax et al. 2003)
Source Vector Target taxa
Commercial shipping Ballast water Plankton, nekton, benthos in sediment Hull fouling Encrusting, nestling, and
some mobile species Drilling platforms Ballast water Plankton, nekton,
benthos in sediment Hull fouling Encrusting, nestling, and
some mobile species
Aquarium industry Accidental or intentional release
Aquarium fauna and flora
Recreational boating Hull fouling Encrusting, nestling, and some mobile species Dive practices Snorkeling and scuba
gear
Algal spores, bacteria, some mobile species Floating debris Discarded plastic debris Encrusting, and some
8
Figure 4 Main vectors of marine introduction (Mead et al, 2011)
Figure 5 Marine introduced species across taxonomic groups (Mead et al, 2011).
2.2 Stressors
9
stressor (temperature) also related with condition in ship hulls and ballast water tank because when some species come to inside ballast water tanks and they influenced by temperature; then, when some species attach in the ship hulls and the journey has different lattitude and of course influenced different temperature as well (Schneider, 2008; Seiden et al. 2011).
Temperature is one of important factor to control geographical range and seasonal cycles of marine organism. As general, organism that maintain their body temperature by absorbing heat from the environment (ectotherm). Temperature too high can act as stressor in two ways: First, it may cause the denaturing of sensitive proteins; This damage can be minimized by the actions of heat shock proteins; which increase the thermostability of proteins and chaperone cellular processes. Second, high temperatures may cause oxygen limitation (Jansen et al. 2007). Temperature also has a linier correlation with heart rate; high temperature lead to fall in heart rate (Akberali and Trueman 1985).
Species “biogeographical” has tolerance to environmental extremes.
Intertidal species is one of organism has tolerance to environmental stress such as temperature and salinity (Castro and Huber 2007).
2.3 Bivalves
Class Bivalvia consist of clams, mussels, and oysters. The body of bivalvia is laterally compressed and enclosed in a shell with two parts or valves. The umbo, the upper hump near the hinge of each shell is the oldest part of the shell. The form of concentric growth lines is growth from the umbo. The inner surface of the shell is lined by the mantle, so that the whole body lies in the mantle cavity. The mantle cavity is a large space between the two halves of the mantle. Special for the Perna viridis has ability attach to the rocks and other surface by byssal threads or byssus (Castro and Huber, 2007). Structure the body of bivalve can be seen in
10
Figure 6 Laterally compressed body is the most distinctive feature of bivalves (Castro and Huber, 2007).
2.3.1 Perna viridis
11
Figure 7 (a). Perna viridis were measured in a ruler; (b) Perna viridis on the glass tank; (c) Fresh harvest of Perna viridis.
The taxonomical name of Perna viridis (Linnaeus, 1758) is: Phylum: Mollusca
Class: Bivalvia
Subclass: Pteriomorphia
Order: Mytiloida
Superfamily: Mytiloidea Family: Mytilidae
Genus: Perna
Species: Perna viridis (Poutiers1987;Carpenter and Niem 1998; Leal 2002)
2.3.2 The Spread of Green Mussel (P. viridis)
Native distribution of P. viridis extends from the Persian Gulf to all of Philippines, Sumatra, Borneo, Bali, Java, Sulawesi, Northeast Vietnam (Siddal, 1980). Siddal (1980) reported that presence of P. viridis in Hongkong as introduced species. The island in New Guinea also include native range (FAO, 2006). Gindy et al (2001) reported, distribution of P. viridis also spread in Musandam Peninsula of Oman. Most of P. viridis distributed in Indo-Pacific.
a. b.
12
Green Mussel also one of fouling organism and ships have been sailing to many area (Kaluza et al. 2010), it is possible P. viridis have been introduced to Florida, Jamaica, Trinidad, China, Japan (Figure 8). Some evidence that P. viridis dominating in fouling and introduced to the coast of Florida (Figure 9 and Figure 10).
Figure 8 Approximate native and introduced range of the Asian Green mussel, P. viridis, based on the literature review (Baker et al. 2007)
2.4 Introduction of species
Most of introduction of species happened by human activity such as aquaculture, marine litter, oil rig, intentional, fisheries, solid ballast, ship boring, ballast water, and ship fouling (Mead et al. 2011), but the dominant vector organism introduced by ballast water and ship fouling. It is related with increase number of ships which bring the good and distributed to worldwide. Ships carry ballast water for vessel stability and trim, it is well established that ballast water can contain some species such as mussels, metazoan, microorganism, some of them are pathogenic and so on (Drake et al. 2002).
13
Figure 9 Mytilus galloprovincialis dominating fouling assemblages in the sea
chests of the SA “Agulhas” (Lee and Chown, 2007).
14
3 RESEARCH METHODOLOGY
3.1 Time and Location
This research was conducted in the Marine Habitat Laboratory, Department of Marine Science and Technology, Faculty of Fisheries and Marine Sciences, Bogor Agricultural University (FPIK – IPB) from April to September 2012.
3.2 Materials
The experiment was used some materials and shown in Table 2. The pictures of materials are shown in Appendix 1.
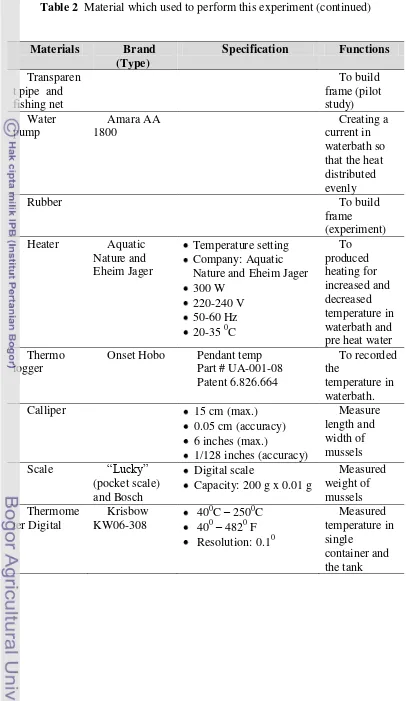
Table 2 Materials which used to perform this experiment
Material s
Brand (Type)
Specification Functions
15
Table 2 Material which used to perform this experiment (continued)
16
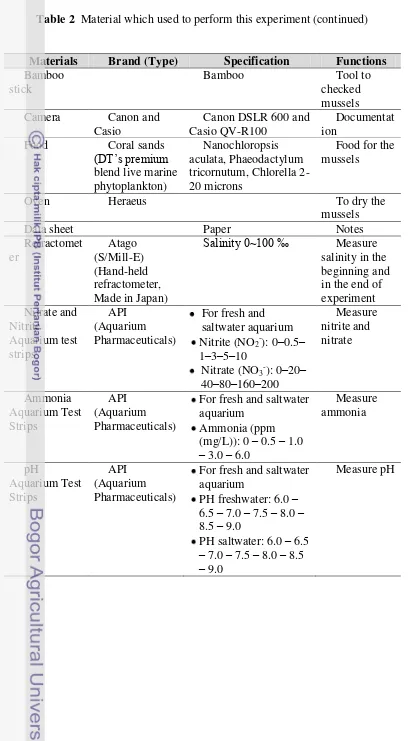
Table 2 Material which used to perform this experiment (continued)
Materials Brand (Type) Specification Functions
17
Table 2 Material which used to perform this experiment (continued)
Materials Brand (Type) Specification Function
Tank filter and pump system had been provided by Marine Habitat Lab
Filter and mix seawater inside the tank.
3.3 Methods
3.3.1 Organism choice and sample sites
The purpose to choose of mussels have some criteria for this experiment: (1) the mussels native in Indo-pacific and was invasive to other area (Mead et al. 2011); (2) generally can found it in the ship hulls and ballast water tank (Lee and Chown 2007). Thus, it is relevant for simulated ship transport; (3) it is easy to collect P. viridis as it can be found in Jakarta Bay (Muara Kamal, Indonesia) where it is cultured and harvested by local fishermen and has economic value (Figure 11); (4) members of the same family, Mytilidae, can be found in other countries participating in GAME X project, such as Brasil, Chile, Finland and Portugal, so that we can compare our results to these countries.
18
Figure 11 (a). P. viridis; (b). Fresh harvest of mussels from Jakarta Bay.
Figure 12 (a). Muara Kamal, Jakarta Bay; (b). Sub-district Muara Kamal; (c). Muara Kamal in Java Island (red colour) (Created by: Annisa Indah Sari, 2012).
a
19
3.3.2 Sampling and transport the organism
Samples for experiment and bring the samples from the site to the lab.The mussels taken in Muara Kamal (Jakarta Bay) with some local fishermen and was transported by boat to the field. The mussels taken in culture area and harvested by local fishermen. Afterwards, the mussels were transported from Muara Kamal to the lab by car. The organisms were put in plastic aquarium without seawater. Ice was filled in the bottom of cool box and covered with sterofoam. Afterwards, the plastic aquarium was put on the top of sterofoam so that the organisms stayed cool and in low metabolism. The transport took two hours from Jakarta Bay to the lab. After arrival in the lab, the organism were cleaned also from barnacles that are attached to it (Figure 13). Afterwards, the organism were put into the glass aquarium for acclimation.
Figure 13 (a) Sampling organisms and measured the size; (b) Mussels in the cool box; (c) Cleaned the mussels.
a. b.
20
3.3.3 Acclimation and feeding
Acclimation is response organism to specific environmental change(s) e.g temperature, salinity, oxygen and so on, that observed in the lab to distinguish effect and response to these changes e.g. physiology, activity, growth, etc (Nielsen 1990; Braby and Somero 2006). So, the purpose of acclimation is that organism get adapted to lab conditions (temperature, salinity, oxygen) until achieved 1% mortality (GAME X). During acclimation, water exchange and feeding of the mussels were done. Half of the sea water in glass aquarium (26 litre) was exchanged every day. First to second day acclimation, water exchange was done twice a day and next day water was changed once a day. Natural sea water was provided by a 1000 liters tank system equipped with a mechanical and a biological filter unit and is distributed to smaller glass aquaria. All organism must have been acclimatized before use in the experiment. Acclimation tanks can be seen in
Figure 14.
The mussels were fed with coral sands DT’s premium blend live marine phytoplankton (Nanochloropsis aculata, Phaeodactylum tricornutum, Chlorella 2-20 microns) which is a liquid phytoplankton food that had a concentration 1,58 x 10⁷. The first day to second day of acclimation phase, the organism were not fed due to stress from transportation. Afterwards, started to feed the mussels daily with 0.0125 ml/ind with coral sands. They should adapt with the lab condition first. The third day to next days, the organisms were fed.
Total number of organism for acclimation before pilot study was 168 mussels. Total number of organism for acclimation before main experiment was 480 mussels which is the mussels separated in 12 glass aquaria with aeration inside. Each glass aquaria consist of 40 mussels.
21
3.3.4 Experimental design and data analysis.
Most of the ship material was metal and it act as conductor which easily influenced by temperature. Therefore, heat stress was chosen since it is relevant with condition inside ballast water tank or ship hulls. On other hand, heat stress is a relevant stressors for benthic, shallow water organism where they also act on organisms shuttled in ballast water tanks or on ship hulls. Species which attach in the ship hulls and carried on the way which has different lattitude would influenced by temperature as well (Schneider, 2008; Seiden et al. 2011).
This experiment was done to simulated ship transport from Europe to Australia because they have a lot of traffic journey of cargo ship bigger than 10.000 GT in 2007 (Kaluza et al. 2010). It can be seen the traffic journey in Europe to US; US to Asia Pacific; US to Australia; Europe to Austalia and so on. Thus, the simulated took from Europe to Australia because the journey has different temperature from temperate – tropical – temperate (Figure 15).
The experimental design is designed to mimicking transport conditions in the lab. In laboratory experiments, organisms will be exposed to stress regimes likely to occur during transport by ship and which cause moderate mortality until up to 80% around 3 weeks (pre stress). After pre-stress period, the survivors will be given some time (~2 weeks) to recover under stress free conditions and the other group exposed directly to the same stressor again (second stress). Survival rates were measured as a response variable over the course around 3 weeks. Control group, consisting of the same number of conspecifics which have not previously been exposed to adverse condition but have been acclimatized to lab conditions, will be treated the same way and serves as a reference or control. Finally, we compared survival between pre-stressed and non stressed group to investigate whether pre stress group can increase the robustness during transport (Figure 16).
22
Figure 15 Simulated ship transport from Europe to Australia.
23
Figure 17 Main groups for this experiment
The data for this experiment were analyzed by using the R program (version 2.14.2). Kaplan Meier curve to analysed survivorship (log rank test), and normality to analysed byssus and body condition index (Shapiro-Wilk test).
3.3.5 Laboratory experiment
3.3.5.1 Water quality control.
24 based on the set temperature in the heater (thermostat).
3.3.5.3 Problematics
Some lab issue during the experiment. The first issue, electricity off for few hours. The second issue is the cable in the freeze broken. The third issue, the quality of food supply for organism might be not good after the cable in the freeze was broken so that don’t get supply electricity. The fourth issue, we have different temperature in two waterbath for stress group (0.5 0C - 1 0C different each other). The fifth issue, thermometer digital was broken for 1 week.
3.3.6 Experiment 3.3.6.1 Pilot Study
25
a. b.
Figure 19 (a). Single containers on the fiber tanks for pilot study; (b) Each containers fixed in the frame for pilot study.
3.3.6.2 Set up and main experiment
Two wooden frames were built for the water bath. That water bath for stress phase which consist of: (a). wooden frame for stress phase, (b). rubber frame for reference or control group, (c). water tank to supply pre heat water (Figure 20). Single containers was fixed on rubber grid into the water bath for stress phase. Supplied water exchange from pre heat water. Aeration was supplied by an air pump and connected with small hose to each single container supplied with an air stone. Heat source was a heater (thermostat) put inside the waterbath for the stress phase and to pre heat water. Afterwards, a pump was inserted to waterbath to distribute the heat evenly. Each waterbath for stress phase and control contained a thermologger to recorded the temperature inside a single container.
The total number organisms was 342 mussels for main experiment, which consist of 223 mussels in waterbath for stress group either without recovery and with recovery (group A and group B). Non stress group (group D and group C) and reference (control group) had 119 mussels.
26
Figure 20 (a). Wooden frame for thermal stress phase; (b). Rubber frame for control group; (c). Tank to pre heat water.
3.3.6.3 Response variables
3.3.6.3.1 Survivorship, Byssus, Body Condition Index (BCI)
Response variable for the mussels experiment were survivorship, byssus production, and body condition index (BCI). Survivorship is amount of individual survived during experiment. Survivorship of mussels was checked with bamboo stick and the siphon touched. If the mussels are still alive, the siphon will move and the shell of mussels will close; if the mussels are dead, the shell will open and the body decomposed. Survivorship was counted by number of mussels survived and checked continuously every day. The result of survivorship after the experiment finished could answer the hypothesis.
Byssus threads of the mussel to attach on the rock and other surface. Byssus checked each single container and counted number of byssus threads produced. Byssus threads were counted 24 hours after target temperature (350C) in the second stress and only one time.
27
from control group for each period. The mussels were put in the freezer (-200C) for storage until analysis. The length and width of mussels and total wet weight was measured. The wet weight from tissue and shell was measured as well, in which tissue was separated from the shells of each individual before put in the oven for drying to constant weight at 600C for 24 hours. Subsequently, dry weight of soft tissue and shell were measured. Additionally a condition index (CI), as a summary of the overall physiological status of an organism under given environmental conditions (Lucas and Beninger, 1985) was calculated:
(g) weight dry
shell
(g) tissue soft of weight Dry
Figure 21 Measuring BCI of the mussels.
3.3.6.3.2 Position of mussels
The purpose to check position of mussels is to know the position of mussels during heat stress experiment. I was checked 3 parts the position of mussels i.e. before second stress, middle second stress and then after second stress for stress group without recovery. Then checked position for recovery, before second stress and after second stress for stress group with recovery.
3.3.6.3.3 Response behaviour
28
3.3.7 Daily routine
I checked survivorship, temperature, gave food and water exchanged for the mussel experiment everyday per each container and all groups. Checked survival use bamboo stick. The temperature was checked randomly in the single container, waterbath, and the storage tank with a thermometer. The room temperature was checked as well. Feed for the mussels experiment was gave coral sand 0,5 ml was given. During main experiment, the mussel experiment was given food every day per each container. For water exchange, changed 50% sea water or 500 ml sea water per each container so that to reduce additional stress for the organisms that might was occur in the tanks during accumulation of metabolic waste products in the sea water i.e. the increasing amount of dissolved ammonia, nitrite and nitrate (Figure 22).
Figure 22 (a) Water exchanged; (b) Feeding the mussels.
29
4 RESULTS AND DISCUSSION
4.1 Results
4.1.1 Species identification
Based on the species verification (identification key from Poutiers 1987; Carpenter and Niem 1998; Leal 2002), it is verified that the species name is Perna viridis (Linnaeus, 1758).
4.1.2 Acclimation
Total number of organism to acclimated was 168 individuals for the pilot study. Length of acclimation period was 10 days until 1 % mortality was reached. During acclimation, total mortality was got 16 %.
Total number of organism to acclimated was 480 individuals for the main experiment. Length of acclimation period was 13 days until 1 % mortality was reached. During acclimation, total mortality was got 22 %.
4.1.3 Experiment
4.1.3.1 Survivorship of the mussels during the pilot study
30
Figure 23 Survivorshipof the mussels connected with temperature duringpilot study.
4.1.3.2 Performance of the mussels during the main experiment 4.1.3.2.1 Survival
The result of survivorship, compared between pre-stress group and non stress group. Pre-stress group without recovery (group B) and non stress group (group D) has length time 14 days and 15 days (n=15). Based on result survivorship graph shows, pre-stress group without recovery (group B) compared with non stress group (group D) was significant not different each group (coxph, p=0,453) (Figure 24).
31
Figure 24 Survivorship of the mussels for pre stress group without recovery (group B) compared with non pre stress (group D).
32
4.1.3.2.2 Byssus
Number of byssus compared between stress group and non stress group.
Figure 26 shows, pre-stress group without recovery (group B) compared with non stress group (group D) is they are not different.
Afterwards, compared pre-stress group with recovery (group A) with non stress group (group C) is not different. Based on normality test used Shapiro-Wilk and the value p= 1.517e-08, it means significant difference between the groups. The homogeneity of variances used Fligner-Killeen test and the value p=1,064e-07, it means significant difference between the groups.
Figure 26 Byssus of the mussels for each groups
4.1.3.2.3 Body condition index (BCI)
33
Figure 27 Body condition index (BCI) of the mussels each period.
4.1.3.2.4 Position of mussels
Figure 28 shows, position of mussels for group B (stress group without recovery), most of position the mussels before second stress in the bottom. Then during in the middle second stress, most of position the mussels not attach.
Figure 28 Position of mussels for group B (stress group without recovery) (S: surface; M: middle; B: bottom; Ai: air stone; NA: not attach) 0
10 20 30 40 50 60 70 80 90 100
S M B Ai NA
%
In
d
Position
Group B
After 2nd stress (n=0)
Middle 2nd stress (n=11)
Before 2nd stress (n=15)
34
Position of mussels for group D (non stress without recovery) shows, most of position the mussels before second stress are in the bottom (Figure 29).
Figure 29 Position of mussels for group D (non stress group without recovery) (S: surface; M: middle; B: bottom; Ai: air stone; NA: not attach)
Position of mussels for control group shows, most of position the mussels before second stress are in the surface. Then in the middle second stress, most of them in the surface. After second stress, most of position the mussels in the bottom (Figure 30).
35
Figure 31 shows, position of mussels for group A (stress group without recovery) and most of position the mussels start to recovery in the bottom; then not attach and dead.
Figure 31 Position of mussels for group A (stress group with recovery), (S: surface; M: middle; B: bottom; Ai: air stone; NA: not attach)
Position of mussels for group C (non stress without recovery) shows, most of position the mussels during recovery in the surface. Before second stress period, most of the mussels in middle (Figure 32).
36
Position of mussels for control shows, most of position the mussels during recovery and before second stress period in the surface. Then after second stress period they are in bottom (Figure 33).
Figure 33 Position for control group (S: surface; M: middle; B: bottom; Ai: air stone; NA: not attach).
4.1.3.2.5 Response behaviour
Base on mussels experiment response behaviour for group B (stress group without recovery) shows, most of the mussels has fast response and then closed response. The graph shows fluctuate amount of mussels until in the end of experiment (Figure 34).
0 10 20 30 40 50 60 70 80 90 100
S M B Ai NA
%
In
d
Position
Control
After 2nd stress (n=30)
Before 2nd stress (n=37)
37
Figure 34 Response behaviour group B (stress group without recovery) (F: Fast; C: Closed; S: Slow)
Response behaviour for group D (non stress group without recovery) shows, most of the mussels has fast response and the amount of mussels fluctuate until in the end of experiment (Figure 35).
38
Response behaviour for control group shows, most of the mussels has fast response and closed response. The graph still shows fluctuate amount of mussels (Figure 36).
Figure 36 Response behaviour for control (F: Fast; C: Closed; S: Slow)
Base on mussels experiment response behaviour for group A (stress group with recovery) shows, most of the mussels has fast response. Everyday each mussels has different response when I was touched the siphon. Can be seen the graph in Figure 37. The graph shows fluctuate amount response of mussels until in the end of experiment.
39
Response behaviour for group C (non stress group with recovery) shows, most of the mussels has fast response and the graph of mussels shows fluctuate until in the end of experiment (Figure 38).
Figure 38 Response behaviour group C (non stress group with recovery) (F: Fast; C: Closed; S: Slow)
Response behaviour for control group shows, most of the mussels has fast response and closed response. The graph still shows fluctuate amount of mussels. Thus, everyday each mussels has different response (Figure 39).
40
4.2 Discussion
4.2.1 Adverse condition during simulated ship transport.
Base on the mussels experiment for the survival graph shows, pre-stress group and non stress group has same mortality either stress group with recovery and also stress group without recovery. It means, the result shows no difference between pre stress and non stress groups,it could either mean that there were no carry over effects at all or that time span given for recovery was not long enough to let them slacken. The conclusion, no selection for stress tolerant and no stress hardening for this experiment because no effect for the genotypic and phenotypic level.
In the previous stressed, P. viridis survived during 16 days with 86 % mortality. Afterwards, the mussels decrease the performance of survival after exposed directly to the second stressed and survived for 14 days. The mussels more decreased the survival when they have recovery time after previous stressed survived for 9 days. That P. viridis could not increased their survival for adverse condition during simulated ship transport with temperature 270C-350C. But, the introduction of species more increase during transport (Mead et al. 2011). I was assumed, might be the increasing amount of individual introduction species in the harbour by ships (Lewis et al. 2005; Rodriguez, 2006; Briski et al. 2011; Mead et al. 2011) because temperature in ballast water tank or full houling stable during transport or the alteration of temperature during transport significant was not different from ambient temperature or below 350C. P.viridis has the best temperature to survival and growth was 310C and best temperature for settlement was 290C (Nair and Appukuttan, 2003; Rajagopal et al. 2006). According Mcdonald (2012), that P. viridis which introduced in the temperate Western Australia by vessel have temperature 240C - 320C and this species can be spawning and increase the growth. On other hand, P. viridis in the laboratory experiment survived with temperature 270C which was 20C colder than the sea surface temperature at the site were the mussels were collected and also P. viridis have limited time in the laboratory until 61 days totally.
This experiment, not able to called P. viridis which exposed directly to second stress adapted with heat stress. Unfortunately, this experiment could not tested with heat shock proteins (HSPs) of mussels so that to know whether P. viridis adapted or not. Heat shock protein (HSPs) was used to regard responses were addressed through the expression of organism (Anestis et al. 2007; Lockwood and Somero, 2011)
41
4.2.2 Number of byssus during transport.
Adverse condition during simulated ship transport, P. viridis can produced the number of byssus although they get double heat stress (350C). On other hand, other P. viridis fell down to the bottom during transport with maximum temperature 250C, whilst low number of byssus for temperature 50Cover a period 35 days (Young, 1985). According Babarro et al (2008), number of byssus secretion from Mytilus galloprovincialis (size 87 mm) achieved approximately 27-31 number of thread with duration 144 hours, byssal secretion for juvenile with non feeding treatment depends on the exposure time.
4.2.3 Growth performance during transport.
Mimicking transport condition, P. viridis lost the weight. So that, during transport P. viridis exposed to increased temperature (270C - 350C) then their lost weight. There is evidence that the increase in temperature is inversely proportional to the growth rate. So, the lower temperature it will lose weight. On other hand, P. viridis survived in the laboratory experiment with temperature 270C which was 20C colder than the sea surface temperature at the site were the mussels were collected. I have assumed, the mussels have limited time in the laboratory with low temperature or might be the food supply was probably not enough. According Mcdonald (2012) reported in Western Australia that P. viridis introduced by vessel with temperature 240C - 320C and introduced in the temperate are with temperature (140C-160C) will more growth and successful to be invasive species. Schneider (2008) was reported, Mytilus galloprovincialis shows higher levels of growth and survival in warmer water (180C) and more correlated with food availability which has been regarded one of influencing factors for growth (Wong and Cheung, 2001). Thus, this experiment shows that P. viridis decreased growth and affected to survival of the mussels.
4.2.4 Position of mussels during transport
42
hand, heart rate blue mussels (Mytilus trossulus, M. edulis, M. galloprovincialis) increased has a linier relation with increasing temperature to high temperature where would decrease the activity (Braby and Somero, 2006).
4.2.5 Response behaviour during transport
43
5 CONCLUSION AND SUGGESTION
5.1 Conclusion
P. viridiswithsurvival rates for previous stress (without recovery and with recovery) and non stress do not different in their tolerance with heat stress (270 C-350C) during simulated ship transport. But, increased amount individual of introduction species due to condition ballast water tank or hull fouling support the survival of mussels or temperature in ballast water tank below 350C. P. viridis taken from Jakarta Bay, Muara Kamal where influenced by anthropogenic activity, that anthropogenic population could not influence to increase their tolerance with heat stress during transport. Temperature has become dominant factor to determine the geographical distribution marine invertebrates.
This experiment shows that P. viridis can settlement with byssus in the wall of ballast water tank and afterwards some of mussels could not produce the number of byssus because related with exposure time was longer during transport. Afterwards, step by step they falled down to the bottom of ballast water tank.
Adverse condition during transport decreased the weight of mussels. It might be food supply was not enough or might be the mussels have limited time in the laboratory.
44
REFERENCE
Akberali HB, Trueman ER. 1985. Effects of environmental stress on marine bivalves molluscs. Advanced in marine biology volume 22. Academic press Inc (London) Ltd.
Anestis A, Lazou A, Pörtner HO, Michaelidis B. 2007. Behavioral, metabolic, and molecular stress responses of marine bivalve Mytilus galloprovincialis during long-term acclimation at increasing ambient temperature. American journal of physiology. Regulatory, integrative and comparative physiology. 293.
Arafat D. May, 2012. Personal communication arranging to buy and bring sea water to the lab. FPIK, IPB.
Babarro JMF, Fernández Reiriz MJ, Labarta U. 2008. Secretion of byssal threads and attachment strength of Mytilus galloprovincialis: the influence of size and food availability. Journal of the Marine Biological Association of the UK, 88(04), 783–791. doi:10.1017/S0025315408001367
Baker P, R Mann. 1997. The postlarval phase of bivalve mollusks: a review of functional ecology and new records of postlarval drifting of Chesapeake Bay bivalves. Bull. Mar. Sci. 61:409–430.
Baker P, N Richmond, NB Terwilliger. 1999. Re-establishment of a native oyster, Ostrea conchaphila, following a natural local extinction. In: J. Pederson, editor. Marine bioinvasions. Cambridge, MA:MIT Sea Grant. pp. 221–231. Baker P, Fajans JS, Arnold WS, Ingrao DA, Marelli DC, Baker SM. 2007. Range
and dispersal of a tropical marine invader, the Asian Green Mussel, Perna viridis, in subtropical waters of the southeastern United States. Journal of Shellfish Research, Vol. 26, No. 2, 345–355, 2007.
Bax N, Williamsona A, Aguerob M, Gonzalezb E, Geeves W. 2003. Marine invasive alien species: a threat to global biodiversity. Elsevier science direct Ltd. Marine policy. Doi: 10.1016/S0308-597X(03)00041-1.
Bij De Vaate A, Jazdzewski K, Ketelaars HAM, Gollasch S, Van Der Velde G. 2002. Geographical patterns in range extension of Ponto-Caspian macroinvertebrate species in Europe. Can. J. Fish. Aquat. Sci. 59: 1159-1174, doi: 10.1139/f02-098.
45
Briski E, Bailey SA, MacIsaac HJ. 2011. Invertebrates and their dormant eggs transported in Ballast sediment of ships arriving to the Canadian Coasts and the Laurentian Great Lakes. Limnology oceanography 56(5), 2011, 1929– 1939. doi:10.4319/lo.2011.56.5.1929
Brown JE, Stepien CA. 2010. Population genetic history of the dreissenid mussel invasions : expansion patterns across North America, 3687–3710. doi:10.1007/s10530-010-9763-2.
Carpenter KE, Niem VH. 1998. FAO Species identification guide for fishery purposes. The living marine resources of the Western Central Pacific Vol 1: Seaweeds, Corals, Bivalves and Gastropods. Food and agricultural organization of the united nations. Rome.
Castro P, ME Huber. 2007. Marine Biology, Seventh Edition. McGraw Hill Higher Education. 220 pp; 283-301 pp
Damar A. 2003. Effect of enrichments on nutrient dynamics, phytoplankton dynamics and productivity in Indonesian tropical waters: a comparison between Jakarta Bay, Lampung Bay and Semangka Bay. Dissertation, Kiel University, Germany.
Davidson IC, Simkanin C. 2012. The Biology of ballast water 25 years later. Biol Invasions. 14: 9-13, doi 10.1007/s10530-011-0056-1.
Decker MB, Breitburg DL, Marcus NH. 2003. Geographical differences in behavioral responses to hypoxia: local adaptation to an anthropogenic stressor?. Ecological Applications, 13(4), pp. 1104–1109 2003 by the Ecological Society of America.
Drake LA, Ruiz GM, Galil BS, Mullady TL, Friedmann DO, Dobbs FC. 2002. Microbial ecology of ballast water during a transoceanic voyage and the effects of open-ocean exchange. 13-20.
FAO (Food and Agriculture Organization) Fisheries. 2006. Species fact sheet: Perna viridis (Linnaeus, 1758) Mytilidae. Fisheries global information system (FIGIS), Food and Agriculture Organization of the United Nations, FAO Fisheries Department, Rome, Italy. http://www.fao.org/figis.
46
Gindy AN, Al-Busaidi Y, Al-Farsi I, Al-Farsi E, Al-Mazrooei A, Al-Raquishi Y, Al-Yahyai D, Al-Kindy F, Al-Rashdi K. 2001. Mariculture activities in Oman, history, present status and future prospects: An overview. In: S. Goddard, H. Al-Oufi, J. McIlwain & M. Claereboudt, editors. Proc. 1st International Conference on Fisheries, Aquaculture and Environment in the NW Indian Ocean, Sultan Qaboos University, Muscat, Sultanate of Oman. Pp 129–134.
Hadiwinoto S, Leitmann J. 1994. Jakarta. Cities journal 11, 153-157.
Huhn M. 2011. Population specific survival during exposure to hypoxia and heat: Global change increase stress tolerance of the Asian Green Mussel (Perna viridis). Diploma thesis. Julius-Maximilians-Universität Würzburg, Germany.
International Maritime Organization. 2006. International shipping and world trade. Facts and figures. http://www.imo.org/.
ISAC [National Invasive Species Council, Invasive Species Advisory Committee]. 2006. Invasive Species Definition Clarification 6. References State of the Gulf of Maine Report: Marine Invasive Species June 2010 20
and Guidance White Paper.11p.
http://www.invasivespecies.gov/global/ISAC/ISAC_index.html.
Jansen JM, Pronker AE, Kube S, Sokolowski A, Sola JC, Marquiegui MA, Schiedek D, Bonga SW, Wolowicz M, Hummel H. 2007. Geographical and seasonal patterns and limits on the adaptive response to temperature of European Mytilus spp. And Macoma balthica populations.
Kaluza P, Kölzsch A, Gastner MT, Blasius B. 2010. The complex network of global cargo ship movements. Interface journal of the royal society.
Kleunen VM, Dawson W, Schlaepfer D, Jeschke J, Fischer M. 2010a. Are invaders different? A conceptual framework of comparative approaches for assessing determinants of invasiveness. Ecol. Lett. 13, 937-946 pp.
Kölzsch A, Blasius B. 2011. Indications of marine bioinvasion from network theory An analysis of the global cargo ship network. The European physical journal B. DOI: 10.1140/epjb/e2011-20228-5.
Lasiak T, Barnard TCE. 1995. Recruitment of the brown mussel Perna perna onto natural substrata: a refutation of the primary/secondary settlement hypothesis. Mar. Ecol. Prog. Ser. 120: 147 –153.
Leal JH. 2002. Bivalves. Bailey-Matthews shell museum, Florida. USA.
47
Lenz M, da Gama BAP, Gerner NV, Gobin J, Groener F, Harry A, Jenkins SR, Kraufvelin P, Mummelthei C, Sareyka J, Xavier E, Wahl M. 2011. Non-native marine invertebrates are more tolerant towards environmental stress than taxonomically related native species: Results from globally replicated study. Environmental Research, Elsevier Journal. 943-952 pp.
Lewis PN, Riddle MJ, Smith SDA. 2005. Assisted passage or passive drift: a comparison of alternative transport mechanism for non indigenous coastal species into the Southern Ocean. Antarctic science 17 (2), 183-191.
Lockwood BL, Somero GN. 2011. Invasive and native blue mussels (genus Mytilus) on the California coast: The role of physiology in a biological invasion. Journal of Experimental Marine Biology and Ecology. 167-174. Lucas A, Beninger PG. 1985. The use of physiological condition indices in
marine bivalve aquaculture. Elsevier Science Publishers. Amsterdam Netherlands.
Mcdonald JI. (2012). Detection of the tropical mussel species Perna viridis in temperate Western Australia : possible association between spawning and a marine heat pulse. Aquatic invasion 7(4), 483–490.
Mead A, Carlton JT, Griffiths CL, Rius M. 2011. Revealing the scale of marine bioinvasions in developing regions: a South African re-assessment. Biological invasion. doi:10.1007/s10530-011-0016-9
Nair MR, Appukuttan KK. 2003. Effect of temperature on the development, growth, survival and settlement of Green mussel Perna viridis (Linnaeus, 1758). Aquaculture research. 34, 1037-1045.
Nielsen K. S. 1990. Animal Physiology: Adaptation and Environment, Fourth Edition. Cambridge University Press. 217-236 pp.
NIMPIS (National Introduced Marine Pest Information System). 2002. Asian green mussel Perna viridis (Linnaeus, 1758). CSIRO Australia Marine Research, Hobart, Tasmania, Australia.2 pp.http:// crimp.marine.csiro.au/nimpis/. [Accessed February 12, 2004].
Occhipinti-Ambrogi A. 2007. Global change and marine communities: Alien species and climate change. Marine pollution bulletin, 55(7-9), 342–52. doi:10.1016/j.marpolbul.2006.11.014