CHAPTER II LITERATURE REVIEW
2.1.Theoretical Background 2.1.1. Inflation
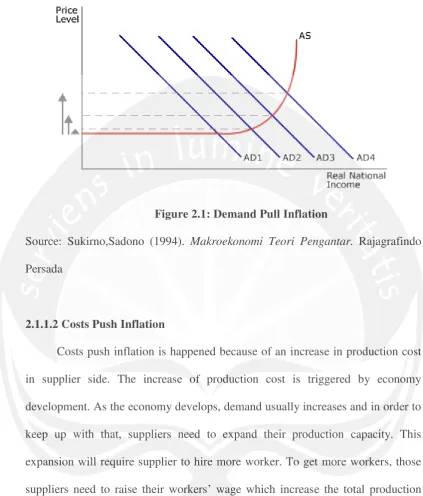
Inflation is the rate that reflects an increase in the overall level of prices in the economy and, subsequently, purchasing power is falling. Because its huge effects of the overall economy, central banks attempt to stop severe inflation, in an attempt to keep the excessive growth of prices to a minimum (Mankiw, 2009:19). According to Sukirno (1994), inflation is categorized into three types based on the cause of the inflation itself, they are: demand pull inflation, cost push inflation and imported inflation.
2.1.1.1 Demand Pull Inflation
Figure 2.1: Demand Pull Inflation
Source: Sukirno,Sadono (1994). Makroekonomi Teori Pengantar. Rajagrafindo Persada
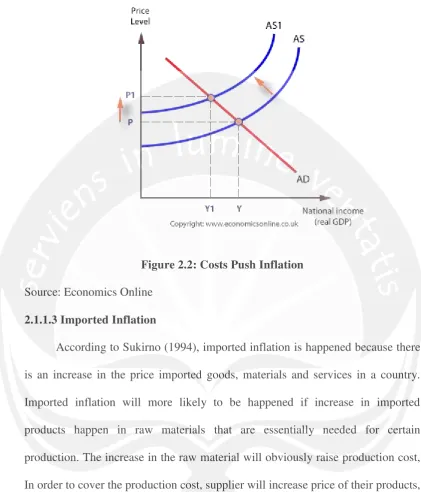
2.1.1.2 Costs Push Inflation
Figure 2.2: Costs Push Inflation Source: Economics Online
2.1.1.3 Imported Inflation
According to Sukirno (1994), imported inflation is happened because there is an increase in the price imported goods, materials and services in a country. Imported inflation will more likely to be happened if increase in imported products happen in raw materials that are essentially needed for certain production. The increase in the raw material will obviously raise production cost, In order to cover the production cost, supplier will increase price of their products, which trigger inflation.
2.1.2 Hedging
direction. As with any bet, there is always the risk of losing money if the price moves in the opposite direction. An investor hedges against this risk if he employs any tool or strategy that minimizes this risk. The most common way to do hedging is using financial derivatives such as options or futures. (Ross, 1991:733)
2.1.2.1. Inflation Hedging
Inflation hedging is an investment in an asset that positively correlated with inflation (Bekaert & Wang, 2010). An asset with positive co-variation will typically rise in value when inflation rates rises. This will give the investor protection again inflation risk when the inflation suddenly rises. The most common asset to hedge inflation is gold. Several other real assets such as land and oil also considered as inflation hedge (Manuel, 2013).
2.1.2.2. Inflation Beta
“Inflation beta is a value that shows how strongly a security’s nominal
return covaries with inflation.” (Ang, Brière, & Signori, 2012). Inflation beta is the inflation coefficient that is derived from regression between inflation rate as
independent variable and asset’s return as dependent variable. Bekaert and Wang
(2010) cited by Ang, Briere and Signori (2012) said that if value of inflation beta is equal to one, the assets hedges inflation perfectly. “A perfect inflation hedge
does not mean that the correlation between asset’s return and inflation rate is also
one because of idiosyncratic risk. But by knowing inflation beta value, investors
could compute hedging ratio and help them to create well diversified portfolio and
2.1.3 Portfolio and Portfolio Construction
Portfolio is a group of assets such as equities and bonds held by investors. The main objective of portfolio construction is to minimize risks faced by the investors (Ross 1991:405). There are three essential steps to construct a portfolio. The first step is to establish investment policies. In determining the investment policies, two important aspects need to be considered. The two important aspects are: assets allocation and constrains. (Habozi, 2011).
According to Habozi (2011), “establishing an investment policy starts with the assets allocation decision”. Assets allocation decision is a decision about how the funds are invested among the major classes of assets (Bodie & Kane, 1992). After assets allocation decision has been made, security selection is the next step. Based on Bodie & Kane (1992), securities selection is a decision about which securities to hold within each asset class (p.12). In order to select best securities, an investor needs to conduct an valuation process of several securities to know the value of each securities. Security analysis will help investor to decide wich security must be hold in his/her portfolio (Bodie & Kane, 1992, p. 12)
After asset allocation decision and security selection has been conducted, constrains that may be faced in constructing a portfolio must also be considered. In Habozi (2011), there are some types of constrains in portfolio construction, they are: client/company constraints, regulatory constraints, and tax and accounting issues. Habozi (2011) stated that “Client imposed constrains” are constrains that come from the client’s limitation or request. The second type of
constrains that came from investment policy such as limitation of concentration in one particular asset (Habozi, 2011).
The next task is selection of portfolio strategy that is consistent with the investment objectives and investment policy guidelines. The selection can be made from a wide range of portfolio strategies. In general, portfolio strategies can be classified as either active or passive (Habozi, 2011:24).
2.1.3.1 Portfolio Strategy
In general, there are two main portfolio strategies; active portfolio strategy and passive portfolio strategy. Active portfolio strategy is defined as strategy to continuously attempts to improve portfolio performance (Bodie & Kane, 1992, p. 14). Someone who uses active portfolio strategy will adjust his/her portfolio continuously to improve his/her portfolio performance. The adjustment process usually uses tool such as forecasting and information in and out the market (Habozi, 2011:25)
In contrast with active portfolio strategy, passive portfolio strategy does not try to readjust portfolio. Passive portfolio strategy only considers holding
diversified portfolio in long term without any additional attempt to improve
portfolio performance (Bodie & Kane, 1992, p. 14). Passive portfolio strategy
assumes that all information has already reflected in the market price (there is no
information asymmetry) (Habozi, 2011:26). In order to decide which strategies to
be chosen, Habozi (2011) pinpointed some factors, they are; market efficiency,
After decision about the portfolio strategy has been made, manager or investor begins to construct portfolio. In constructing portfolio, investor or manager tries to find best combination between several securities to create an efficient portfolio. According to Jones (2002) efficient portfolio is the portfolio that has lowest risk for a given expected return or vice versa. (p.192)
2.1.3.2 Markowitch Modern Portfolio Theory (MPT)
Markowitch modern portfolio theory (MPT) is a well known and the most common approach in portfolio construction. The approach seeks to maximize portfolio expected return in a given level of return or vice versa. (Jones, 2002:192) In order to find the best combination of assets or securities, Markowitz diversification is used. The final product of this approach is what we called as efficient portfolio.
Markowtiz diversification attempts to reduce the risk of the portfolio by looking at the correlation between each asset’s return (Levisauskait, 2010:51). By
knowing the correlation between assets’ return, investor can combine several
assets that have nearly zero correlation or even negative correlation to construct an efficient portfolio (Jones, 2002, p. 192).
2.1.3.3 Inflation Hedging Portfolio
done. One of the techniques to measure inflation hedging ability is inflation beta. Some researchers found that constructing an inflation-hedging portfolio is not an easy task. They found that inflation-hedging abilities of assets are widely dispersed across assets especially in equities. Furthermore, inflation hedging ability of an asset which measured by historical data does not guaranteed future protection against inflation (Ang, Brière, & Signori, 2012). But there are also some researches that suggested positive relation between equity’s return and inflation.
2.1.3.4 Portfolio Performance Evaluation
Evaluation of a portfolio performance is an important activity. Investors
need to know how their portfolio performed over the time. The most basic
portfolio performance evaluation technique is measurement of risk and return of
the portfolio. However, by knowing only about risk and return of the portfolio is
not enough, each portfolio has different risk in different rate of return. Difference
between risk and return between each portfolio makes comparison between one to
another portfolio difficult to be done. Furthermore, risk and return measurement
does not provide any explanation power in explaining portfolio’s performance
against overall market performance.
Further development of portfolio evaluation technique overcomes the
basic problems of the basic risk and return measurement. These approach
combined between risk and return into single calculation and they are called as
adjusted performance measure, they are; Sharpe performance measure, Treynor
performance measure and Jensen measure. (Bodie & Kane, 1992, p. 577)
Sharpe measure or also called as Reward to Variability Ratio (RVAR)
measures excess return of a portfolio to the standard deviation of the portfolio
(Bodie & Kane, 1992, p. 577). Excess return is the additional return for investing
in risky asset. The value of excess return can be gotten by deducting portfolio
return with risk free rate. Based on Jones (2002) explanation about Sharpe
measure, high RVAR in portfolio indicates that the portfolio has a good
performance over the period. RVAR also can be used to compare among
portfolios and the market performance (p.580). Sharpe measure is widely used in
professional portfolio management to asses fund manager performance.
Jack Treynor developed Treynor ratio or reward to volatility ratio (RVOL)
in 1960s. Similar with Sharpe measure (RVAR), Treynor ratio also measures
relation between excess return and risk in portfolio. The difference between
Sharpe ratio and Treynor ratio is in their assumption of risk in portfolio. Treynor
ratio only uses systematic risk in its formula. This is based on assumption that
unsystematic risks have been diversified by the portfolio effectively (Jones, 2002,
p. 582). Same with sharpe ratio, the higher the Treynor ratio the better the
portfolio.
Jensen Differential measure or also known as Jensen alpha also was
developed based on CAPM model. In fact, Jensen alpha is closely related with
Treynor ratio, both of them use beta to represent risk in portfolio. Jensen alpha
measures portfolio excess return to the CAPM expected return (Bodie & Kane,
1. If alpha of a portfolio is positive and significant, the portfolio performance
is superior.
2. If alpha of portfolio is significantly negative, the portfolio has inferior
performance.
3. If alpha is close to zero (insignificantly different from zero), the portfolio
can be considered has the same performance with overall market.
Source: Jones (2002, p.584)
2.1.4 Equity Instrument (Stock)
Equity instrument or commonly known as stock is one type security that
represent a claim of a company asset and revenue (Investopedia). There two types
of equity instrument, preferred equity and common equity. Preferred equity gives
no voting right to its owner but has higher claim (fixed cash dividend) on
company’s earning and assets. In contrast, common equity gives no fixed cash
dividend but the owner of common equity has a voting right.
2.1.5 LQ45 Index
1. At least has been listed in the IDX for three months.
2. High transaction activities is measured based on trading volume, value and market capitalization.
3. Good financial condition and have a good growth prospect in the future. Source: Indonesia Stock Exchange
2.1.6 Risk
Risk is chance that the actual outcome from an investment will differ from the expected outcome (Johns,2002:131). In the financial management perspective, risk can be categorized into two types of risk, systematic and unsystematic risk. The summation between systematic and unsystematic risks is called as total risk. In financial management, total risk of an asset can be seen by looking at the standard deviation value of the asset’s return.
2.1.6.1. Systematic Risk
2.1.6.2. Unsystematic Risk
Unsystematic risk is risk that affect at most small number of assets. Because these risks are unique to individual companies or assets, they are sometimes called as unique or asset-specific risks. The amount of unsystematic can be reduced through appropriate diversification. (Ross, 1991:411)
2.1.6.3 Market Beta
Market beta or commonly known as beta is a measure of an individual security or portfolio volatility to the market volatility (Investopedia). The value of beta shows the sensitivity of the securities with the market common factors such as macroeconomic factors. According to Berk & DeMarzo (2010) there are three conclusions that can be derived by examining beta coefficient of a security, they are:
1. If the value of beta is less than one, it indicates that the security has less volatility than the market.
2. If beta of a security is equal to one, it means that the security has the same volatility with the market in general.
3. If beta of a security is more than one, the volatility of the security is more than the market’s.
2.1.6.4. Single Index Model
common market index such as JCI (Jakarta Composite Index). Single index model divides a security’s return into two main parts: unique part and market-related part
(Jones, 2002). Based on Jones (2002), the unique part of a security return is related to the firm specific risk (unsystematic risk) and the market-related part is related to the macro events that affect overall market (p.514). Single index model of a security can be derived by using this model by regressing market return with the security return.
2.1.6.5. Sources of Risk
According to John (2002,132-133), there are eight sources of risk that affect on the return. The sources of risk are:
a. Interest rate risk refers to the variability in a security’s return resulting from changes in the level of interest rates. In general, interest rate risk affect directly to bond.
b. Market risk is variability in returns resulting from fluctuations in the overall market – that is, the aggregate stock market.
c. Inflation risk is associated with inflation condition of the state itself. As inflation rate rises purchasing power of an currency is declining and resulted in the declining value of an asset’s return.
d. Business risk is the risk of doing business in a particular industry or environment.
f. Liquidity risk. It is the risk associated with the particular secondary market in which a security trades. The more uncertainty about the time of an investment can be bought or sold and the price concession, the higher the liquidity risk. g. Currency risk (Exchange rate risk). Currency risk is resulted from the
movement of exchange rate. The investors who invest only in his or her country’s stocks do not face the currency risk. The investors who invest in
such financial assets as international mutual funds, global mutual funds, closed-end single-country funds, foreign equities, and foreign bonds are affected by currency risk.
2.1.7. Return
Return is a measure of the reward flowing from a business during a specified period, usually the reward as measured by the profit generated. For investors, return is used to refer to the sum of the profit together with the capital gain to have accrued from an investment over a specified period (Gibson, 2003:257). Returns from investing are crucial for investors; they are what the game of investment is all about. The measurement of historical return is necessary for investors in order to assess the investment plan or process. Furthermore, historical return is also essential to estimate future prospect of an investment. (Jones, 2002). There are two components of a typical return: yield and capital gain.
2.1.7.1. Yield
and is usually expressed annually as a percentage based on the investment's cost, its current market value or its face value (Investopedia).
2.1.7.2. Capital Gain / loss
Capital gain or loss is the change in price on a security over some period of time. Capital gain is happened when price of an asset in t+1 is higher then price in
period of t. In contrast, investor is considered suffered a capital loss when price of an asset in t+1 is lower than the price of that asset in the period of t. (Jones, 2002)
2.1.7.3. Expected Return
Based on Jones (2002), expected return is “return that an individual expect to earn in the future from an asset or portfolio.” Expected return is an estimation derived from the observation of the asset’s historical return (Jones, 2002).
2.1.8. Ex Post and Ex Ante 2.1.8.1. Ex Post
Ex-post is another term for actual returns. Ex-post translated from Latin means "after the fact". The use of historical returns has traditionally been the most common way to predict the probability of incurring a loss on any given day. Ex-post is the opposite of ex-ante (Investopedia).
2.1.8.2. Ex Ante
movements in price or the future impact of a newly implemented policy (Investopedia). Ex ante analysis can be conducted by two main methods. First method is by using forecasting and the second method is by using out of sample approach. The out of sample approach is used when the researcher want to test the robustness of the model (Willmot, 2010). Based on Willmot (2010), out of sample model approach is conducted by creating a model only derived from a part of the total sample and uses the rest of the sample to test the robustness of the model.
2.1Previous Research
A same root study conducted by Bond & Rubens (2007) which examined inflation hedging portfolio through inflation beta in international assets found that even an international approach in constructing inflation hedging portfolio did not guaranteed a good result. Based on the result of their research, even international diversification could not be expected to hedged inflation. Although for some sample portfolios, higher return and less variability (risks) was achieved. Another same root study by Martin Hoesli et al (2011) also found similar result. He found very limited evidences of inflation hedging, although some evidences suggested that real estate is better than other asset classes at hedging against expected inflation. Gunasekarage et al research (2008) and Tien-Foo Sing et al research (2010) support Martin Hoesli et al research (2011) finding. Both of them found that real assets provided better inflation hedging ability compared to the financial
assets. All of these findings support Fisher (1930) and Fama & Schwert(1977)
research findings. Their findings stated that in general equity (stocks) has poor inflation hedging ability because there is negative correlation between equity and inflation rate.
In contrast with other research findings, Jacob Boudoukh and Matthew Ricardson (1992) research found an opposite result. They found that there was positive relation between equity returns and inflation rate in long run. Furthermore,
Table below shows the summaries of the previous research about this topic:
Table 2
Summary of Previous Studies
No Author(s) Title Variable(s) Result
1
John Ruff and Vince Childers (2011) Fighting the Next Battle: Redefining the Inflation- Protected Portfolio Real Assets Return, Financial Assets Return and Inflation Rate
Many different assets could potentially hedge against inflation; their effectiveness varies, as does their reliability and their cost-effectiveness. But inclusion of real assets in portfolio, increased the inflation hedging ability of portfolio
2 Martin Hoesli ,Colin Lizieri& Bryan MacGregor (2009) The Inflation Hedging Characteristics
of US and UK Investments: A Multi-Factor Error Correction Approach Real Assets Return, Financial Assets Return and Inflation Rate
Real Assets gave better protection again inflation in the portfolio in both UK and US. However, some of stocks (equities) also correlated postively with inflation movement.
3 Michael T. Bond and Jack H Rubens(2007) Inflation Hedging Through International Equity investment Stock (equity) return and inflation rate
International diversification could not guarantee a good protection again inflation although some equities had a good inflation hedging ability.
4
Gunasekarage, Abeyratna; Power, David M; Zhou, Ting
Ting (2008)
The long-term inflation
hedging effectiveness of real estate and financial assets: New Zealand Investigation Real Assets Return, Financial Assets Return and Inflation Rate
No Author(s) Title Variable(s) Result
6 S. Ganesha and Y.H Ciang (1998) The Inflation Hedging Characteristis tics in Hongkong Real Assets Return, Financial Assets Return and Inflation Rate
Financial assets in Hongkong provided better inflation hedging ability compared to the real assets. 7 Salvatore Bruno and Ludwig Chincarini (2011)
A Multi Assets Approach to Inflation Hedging for U.S Investors Real Assets Return, Financial Assets Return and Inflation Rate
Equity based assets in general had poor inflation hedging ability. In contrast, real assets and bonds provided better inflation hedging ability.
8 Jacob Boudoukh and Matthew Ricardson (1992)
Stocks Are A Good Hedges for Inflation Stock Return and Inflation rate
There was positive relation between equity returns and inflation rate in long run.
9 Eugene F, Fama and G. William
Schert (1977) Assets Return and Inflations Real Assets Return, Financial Assets Return and Inflation Rate
Equity based assets had poor inflation hedging ability. This resulted in poor inflation hedging ability of equity.
10 Lothian and Mc Charty (2001) Equity Return and Inflation: The Puzzlingly Long Lags Equity Return and Inflation
there was a positive relation between inflation and equity
return.
11 Laura Spierdijk and Zaghum Umary (2011) Stock,Bond, T-bills and Inlfation Stock return, bond return, T-bill return and inflation
there were positive and statistically significant, but economically modest, inflation hedging capacity for the stock return