©Universiti Malaysia Pahang
DOI: http://dx.doi.org/10.15282/ijame.9.2013.7.0129
1564
A NEW METHOD IN THE IDENTIFICATION OF NOISE AND VIBRATION CHARACTERISTICS OF AUTOMOTIVE DISK BRAKES IN THE LOW
FREQUENCY DOMAIN
K. Magaswaran, A. S. Phuman Singh and M. Z. Hassan
Department of Automotive Engineering, Faculty of Mechanical Engineering, Universiti Teknikal Malaysia Melaka,
Durian Tunggal, 76100 Melaka, Malaysia, Email: [email protected]
ABSTRACT
Noise and vibration characterization is an important benchmark to reduce brake noise. Brake noise and vibration measurement is commonly done on an actual vehicle or on a brake dynamometer. A full scale brake dynamometer takes into account the attached mass which resembles the mass of a quarter scale vehicle. This paper proposes a testing method which eliminates the need for attached masses. This is achieved through the scaling of the brake system parameters to accommodate the loss of mass and produce similar conditions to those in actual braking. The measurement of noise and vibration is measured simultaneously and an FFT is performed to identify the frequencies of noise and vibration. An experimental modal analysis (EMA) is done to obtain the frequencies which the brake system tends to produce as a validation to the proposed method. It is shown that through this method the noise and vibration characteristics of the brake system and the unstable frequencies can be identified.
Keywords: Brake noise; brake vibration; brake dynamometer; frequency domain;.
INTRODUCTION
1565
characteristics of a braking event are complicated, as the input to the brake system varies with an unlimited number of combinations and the brake assembly itself is a set of multiple components connected with complex interfaces. Low frequency brake noise below 1 kHz has been of particular importance recently due to advances in automotive technology in making vehicles quieter. Thus testing of the brake system is crucial at the prototype stage itself. At that stage, a real vehicle for on road testing might not be available. Therefore, brake dynamometer testing is the only option available. Tests on a brake dynamometer have been done by Bryant, Fieldhouse, Crampton, Talbot, and Layfield (2007), Hetzler and Seemann (2006) and Little, Kao, Ferdani, and Hodges (1998), but those tests were full scale and either included the vehicle mass or suspension components.
The approach used in these tests is a causal approach which tries to identify the mechanism of the produced sound. This approach is suitable to understand the mechanisms which lead to the noise. The drawback is that this method is unable to identify the noise and vibration characteristics of the brake system in a broad frequency domain. The characteristics of the noise and vibration are important to identify the unstable frequencies within the system because it is the unstable frequencies that tend to produce noise. Furthermore, the experiment conducted should yield a result as a function of brake pressure and wheel rotational speed, because these are the local parameters in the brake system, by which the dynamics of the brake system is highly influenced. Such an experiment was done by Lindberg, Hörlin, and Göransson (2013), but it was carried out under laboratory conditions using a full scale vehicle. A full scale vehicle is only available after the vehicle enters production and the test results of a full scale vehicle would contain noise from the engine, transmission, tires and various other disturbances. The sound generated during braking is basically a friction induced sound. Friction plays a role in dissipating energy in the brake system but it can also produce energy. When friction produces more energy than it dissipates, sound is generated1. In a disk brake system, the disk and pad friction pair produces sound from such instability. The disk and pad contact are what produces the friction force, which in turn causes in-plane vibration of the disk (Matsuzaki & Izumihara, 1993; Tzou, Wickert, & Akay, 1998). This vibration exerts a periodic force with respect to disk motion on the edge of the pads as it vibrates. This excites bending mode vibration within the pads. Consequently, it causes the contact of the pad in the disk to fluctuate and excite the bending waves on the disk (Ichiba & Nagasawa, 1993). This phenomenon is referred to as geometric coupling, which is also called geometric instability. As the pad exerts force on the disk, the disk will tilt slightly (Kubota & Suenaga, 1998). This tilt has the potential to produce a groan noise through a stick and slip mechanism (Gouya & Nishiwaki, 1990). All these factors combine to form a wide range of noise and vibration in a single braking event, which is expected in the experiment to identify the brake system noise and vibration characteristics.
1566
THE SCALING OF THE PARAMETERS
The goal of the testing is to identify the characteristics of the brake noise produced. The disk and pad vibratory system is a complex interrelated forced vibration system. In a forced vibratory system, there should be a periodic excitation force. In the brake system, the force is produced by the brake pads but the periodic quality is produced by the rotation of the disk. Thus it is important to implement the same rotational speed to reflect the real vehicle. The variable that causes the excitation force is the brake pressure, thus it is to be scaled. Scaling of the pressure is necessary to produce the desired deceleration. Implementation by applying brake pressure equal to that of a real vehicle will stop the brake rotor abruptly; this makes observation and data collection more challenging. Scaling of the excitation force will decrease the amplitude of the produced noise and vibration but not the frequencies. Therefore, it is predicted that the results will show sound levels which are low in amplitude throughout the sound spectrum but with distinguishable peaks. In order to maintain a constant relationship between the scaled and full scale brake dynamometer, the energy method is used. The change of kinetic energy when the brakes are applied is calculated using Eq. (1) for the actual vehicle and Eq. (2) for the reduced scale brake dynamometer. The change in kinetic energy is taken into account because the brakes are applied to decelerate both the vehicle and the disk brake on the brake dynamometer but not to stop the vehicle and disk brake entirely. The kinetic energy is denoted by the symbol K whereas its subscript indicates the conditions in which the equation is used; m is the mass of the object in motion, which in this case is the quarter scale vehicle, and vn, is the velocity. For the
rotational kinetic energy, the moment of inertia of the disk is represented by I and rotational velocity is denoted by ωn. The variables for the scaling calculations are
obtained from the actual vehicle and the braking system of the vehicle that is going to be tested. Table 1 lists the parameters used for calculations of translational and
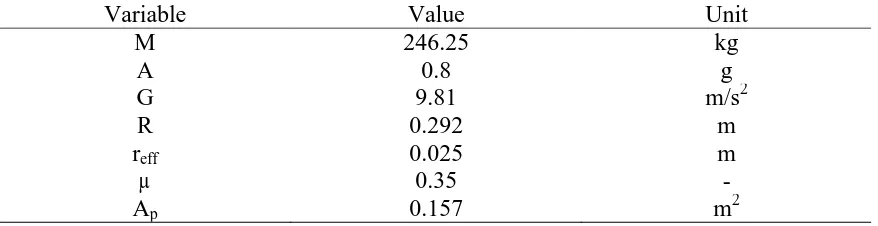
Table 1. List of parameters for translational and rotational kinetic energy calculations
Translational Rotational
1567
known. This is also achieved through calculations. To calculate the pressure applied on a real vehicle, deceleration, a is fixed at 0.8. The force needed to retard the motion of the vehicle is calculated from Eq. (3), where FB is the braking force, m is the mass of the
vehicle, a is the determined deceleration, and g is the gravitational acceleration.
mag
FB (3)
Then the force is used to equate the torque needed by the wheels to decelerate the vehicle by using Eq. (4), where T is the torque and R is the tire radius.
R F
T B (4)
Eq. (5) shows the relation between the torque, friction force Ff and effective radius, reff.
The effective radius is the distance between the center of the disk brake rotor and the center of the mass of the brake pad. The friction force is dependent on the friction coefficient, µ and normal force, Fn which is shown in Eq. (4). The integer 2 in Eq. (6)
indicates the pair of brake pads within the brake system. The normal force is determined by the applied brake line pressure, p on the piston area, Ap. Eq. (8) is obtained from Eq.
(5) to (7). Table 2 shows the parameters used to calculate the brake pressure. The calculated pressure will be scaled accordingly and applied during the experiment.
eff
Table 1. List of parameters for brake pressure calculation
1568
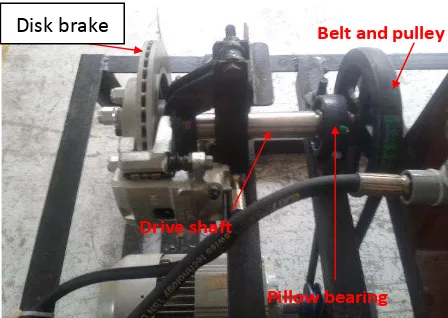
attached to the brake dynamometer frame at the points designed to hold the brake assembly. A shaft is assembled to the brake assembly which acts as a drive shaft. The shaft is supported by pillow bearings which are attached to the dynamometer frame. At the other end of the shaft, a V-type pulley is attached. This is the driven pulley which is linked with a V-belt to a drive pulley which is attached to an electric motor. The dynamometer is driven by a Siemens 4kW 3-phase electric motor. The drivetrain setup is shown in Figure 1. This motor has an ABB adjustable speed drive to start the motor and control its rotational speed. From this controller the initial speed, ω0 can be set and,
as the brakes are applied, the corresponding speed can be read.
Belt and pulley Disc brakes
Pillow bearing Drive shaft
Figure 1. Drivetrain of the disk brakes
The dynamometer is powered up by a start button which starts the drive, and then when the drive is ready the motor can be run on the set desired speed. There is an emergency stop button to shut down the dynamometer immediately in case of an emergency. This is a safety feature. There are also red and green indicator lights to indicate that the motor is running or has stopped. These electrical controls are shown in Figure 2. The braking module is an OEM part of the same locally made vehicle; it has the brake pedal, the master cylinder and a brake fluid reservoir. Along the pressure line of the brake system is attached a pressure gage which is used to monitor the brake pressure applied during braking. A microphone is used to capture the noise level produced during braking and two single axis accelerometers are used to measure the vibration level. The accelerometers used are the Dytran 3225F1 and 3214A3. These accelerometers, which weigh 11 grams, are placed at the surface of the brake pad coinciding with its geometric center, whereas the microphone is placed 100 mm away from the brake disk coinciding with its geometric center. The microphone and the accelerometers are connected to a portable analyzer, model LDS Dactron dynamic signal analyzer PhotonII. The portable analyzer receives the electrical signal from the microphone and accelerometers and relays it to the RT Pro Photon software installed in the laptop. This software displays the sound and vibration spectrums.
1569 Emergency stop button
Green indicator light
Red indicator light ABB adjustable
speed drive
Dyno on/off switch box
Figure 2. Electrical controls of the brake dynamometer
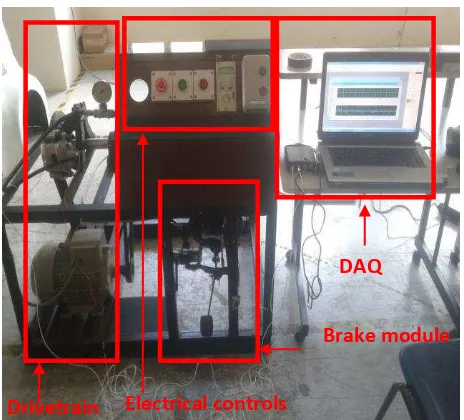
The measurements of the sound level and vibrations are done with reference to 0dB for sound and 1mm/s2 for acceleration. The reference is chosen because if the scaled pressure that is applied in the experiment is quite low then the amplitude of the sound and vibration produced will also be low. Nonetheless, the frequency will not be affected because the periodic characteristic of the excitation force is produced by the disk rotational speed. Figure 4 shows the brake dynamometer used.
Figure 3. From left, the brake module, Dytran accelerometer and LDS Dactron portable analyzer
Figure 4. Full view of the UTeM small scale brake dynamometer Drivetrain Electrical controls
1570
1571
Table 3. Peak frequency and amplitude of brake pad EMA
np Frequency (Hz) Amplitude (m)
Table 4. Peak frequency and amplitude of brake disk EMA
RESULTS AND DISCUSSION
1572
vibrate, a high correlation between the EMA and brake dynamometer would validate the scaling method.
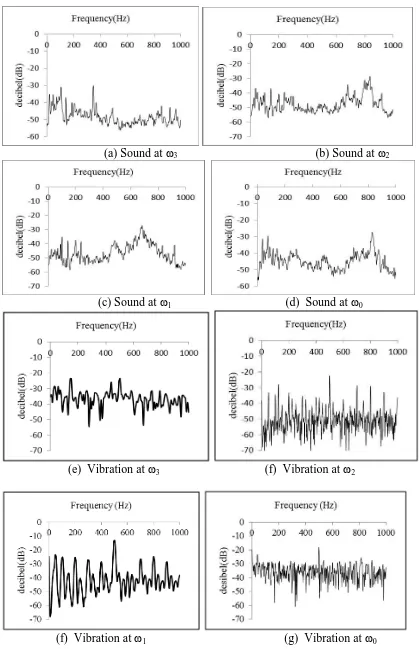
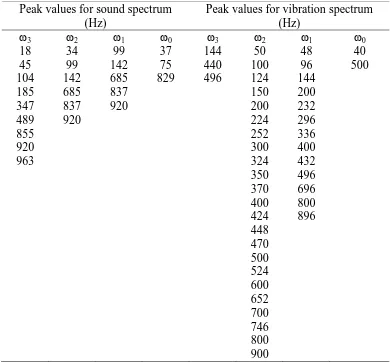
The sound spectrums at different speeds are shown in Figure 6(a)to (d) which correspond to disk rotational speeds ω3 to ω0. Figure 6(a) shows peaks at 18 Hz, 45 Hz, 104 Hz, 142 Hz and 347 Hz which are significantly dominant. There are also peaks at 185 Hz, 489 Hz, 855 Hz, 920 Hz and 963 Hz which are less distinguishable. As the disk decelerates as shown in Figure 6(b), the spectrum changes and the dominant peaks are at 34 Hz, 99 Hz, 142 Hz, 685 Hz and 837 Hz. The peak at 920 Hz is still visible but has been suppressed compared to the dominant peaks. Further deceleration produced dominant peaks at 99 Hz, 142 Hz, 199 Hz, 239 Hz, 479 Hz, 683 Hz and 917 Hz and can be seen in Figure 6c. Some peaks which are dominant in Figure 6(b), such as 99 Hz, 142 Hz, and 683 Hz, have maintained their dominance. Lastly, when the disk rotation speed is at ω0, only the peaks at 37 Hz, 75 Hz and 829 Hz can be seen, with less dominant peaks at 279 Hz, 471 Hz and 697 Hz. As the deceleration progressed, the sound spectrum changed significantly. The deceleration indicates that the magnitude of the periodic quality is reducing. Due to the natural properties of the pad and disk, the amplitudes of the produced sound are also subject to change. This evidence is shown in Figure 6(a) to (d). The distinctive peaks in the spectrum show the frequency at which the sound is more dominant than the other sound frequencies. Studies such as done by Akay (2002); (Dunlap et al., 1999; Tzou et al., 1998)have listed the frequency ranges at which the sound occurs and named those specific sounds which commonly occur in the brake system. The results are in good agreement with sounds such as roughness which is 5–60Hz, groan which is 50–300 Hz, judder vibration which produces an audible tone around 150Hz and moan which is 100–400 Hz. Another sound which has a frequency around 800–900Hz can be classified as a low frequency squeal. The amplitudes of the sound are generally quite low, as predicted, but it is still possible to distinguish the dominant and predominant. Thus, observations are possible with the reduced scale brake dynamometer. The speed of the disk is the parameter that gives the periodic quality to this system. Thus, one frequency is dominant at one speed and another frequency is dominant at another speed, even though the pressure which is the excitation force is the same. The observation made here is that a linearly decreasing speed did not yield a linear trend in the frequencies. This represents the nonlinearity of the system’s behavior.
1573
(a) Sound at ω3 (b) Sound at ω2
(c) Sound at ω1 (d) Sound at ω0
(e) Vibration at ω3 (f) Vibration at ω2
(f) Vibration at ω1 (g) Vibration at ω0
1574
Table 5. Peak values for sound spectrum and vibration spectrum
Peak values for sound spectrum
Table 6. Unstable frequencies within the tested brake system
1575
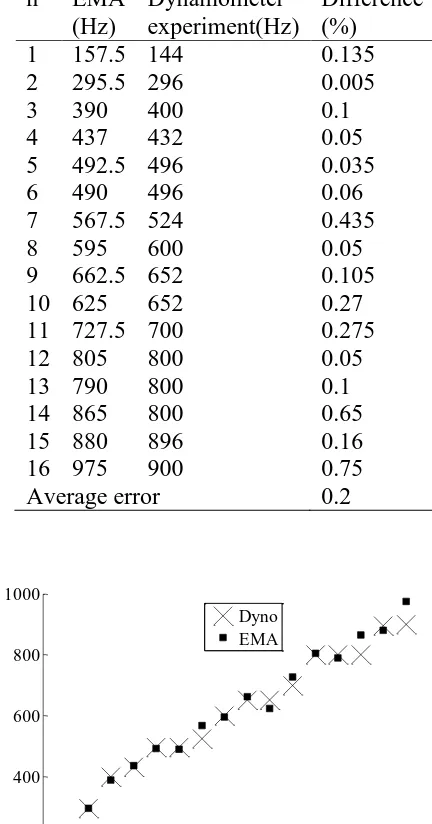
likely to vibrate, thus during braking these frequencies have a strong tendency to be distinct in the frequency spectrums. Table 7 shows a comparison between the EMA frequencies and brake dynamometer experiment frequencies with difference percentages. From the table it can be seen that the brake dynamometer could recreate the EMA frequencies with an average difference of 0.2%. This shows a strong validation of the scaling method. Figure 8 shows the comparison graphically.
Table 7. Comparison between EMA frequencies and dynamometer experiment frequencies.
1576
CONCLUSIONS
The scaling method used to eliminate a quarter scale vehicle’s car mass and other components is validated using the EMA. The brake dynamometer experiment carried out showed that the scaling method yielded the EMA frequencies with high accuracy, thus validating the method. This validation of the method makes the noise and vibration characteristics obtained from the experiment practicable. From these noise and vibration characteristics, unstable frequencies can be identified. These unstable frequencies are the ones that need attention in the effort to eliminate noise from the brake system
ACKNOWLEDGMENTS brake judder investigations using a high speed dynamometer. SAE Technical Paper.
Dunlap, K. B., Riehle, M. A., & Longhouse, R. E. (1999). An investigative overview of automotive disc brake noise. SAE TRANSACTIONS, 108(6; PART 1), 515-522. Gouya, M., & Nishiwaki, M. (1990). Study on disc brake groan SAE Technical Paper
900007.
Hetzler, H., & Seemann, W. (2006). Friction modes in low frequency disc‐brake noise‐experimental results and implications on modelling. Proceedings in Applied Mathematics and Mechanics, 6(1), 307-308.
Ichiba, Y., & Nagasawa, Y. (1993). An experimental study on disc brake squeal modes and squeal exciting energy. Paper presented at the Proceedings of Asia-Pacific Vibration Conference, Kitakyushu, Japan, pp. 1-9.
Jha, S. K., & Sharma, A. (2013). Optimal automobile muffler vibration and noise analysis. International Journal of Automotive and Mechanical Engineering, 7, 864-881.
Kubota, M., & Suenaga, T. (1998). A study of the mechanism causing high-speed brake judder. SAE Technical Paper No. 980594.
Lindberg, E., Hörlin, N.-E., & Göransson, P. (2013). An experimental study of interior vehicle roughness noise from disc brake systems. Applied Acoustics, 74(3), 396-406.
Little, E., Kao, T.-K., Ferdani, P., & Hodges, T. (1998). A dynamometer investigation of thermal judder. SAE Technical Paper No. 982252.
Matsuzaki, M., & Izumihara, T. (1993). Brake noise caused by longitudinal vibration of the disc rotor. Diesel Engine, 2015, 06-22.
1577
case study in malaysia. International Journal of Automotive and Mechanical Engineering, 4, 490-503.
Patel, C. B., Gohil, P. P., & Borhade, B. (2010). Modeling and vibration analysis of road profile measuring system. International Journal of Automotive and Mechanical Engineering, 1, 13-28.
Qatu, M. S., Abdelhamid, M. K., Pang, J., & Sheng, G. (2009). An overview of brake noise and vibration problems. International Journal of Vehicle Noise and Vibration, 5((1/2)), 1-35.
Rhee, S. K., Tsang, P. H. S., & Wang, Y. S. (1989). Friction-induced noise and vibration of disc brakes. Wear, 133(1), 39-45.