Performance Evaluation of Real Power Quality Disturbances
Analysis using S-transform
Abdul Rahim Abdullah
1, a *,
Nur Hafizah Tul Huda Ahmad
1, b,
Noor Athira Abidullah
1, c, Nur Hazahsha Shamsudin
1,dand Mohd Hatta Jopri
1,e 1Technical University of Malaysia Mallacaa[email protected], b[email protected], c[email protected], d[email protected] e[email protected]
Keywords: Power quality, Time-frequency distribution, Time-frequency representation, S-transform
Abstract. Power quality is main issue because of the impact to electricity suppliers, equipments, manufacturers and user.To solve the power quality problem, an analysis of power quality disturbances is required to identify and rectify any failures on power system. Most of researchers apply fourier transform in power quality analysis, however the ability of fourier transform is limited to spectral information extraction that can be applied on stationary disturbances. Thus, time-frequency analysis is introduced for analyzing the power quality distubances because of the limitation of fourier transform. This paper presents the analysis of real power quality disturbances using S-transform. This time-frequency distribution (TFD) is presented to analyze power quality disturbances in time-frequency representation (TFR). From the TFR, parameters of the disturbances such as instantaneous of root mean square (RMS), fundamental RMS, total harmonic distortion (THD), total nonharmonic distortion (TnHD) and total waveform distortion (TWD) of the disturbances are estimated. The experimental of three phase voltage inverter and starting motor are conducted in laboratory to record the real power quality disturbances. The disturbances are recorded via data logger system which is mplemented using LabVIEW while the analysis is done using Matlab in offline condition. The results show that S-transform gives good performance in identifying, detecting and analyzing the real power quality disturbances, effectively.
Introduction
Power quality issue has becoming increasingly important to electricity consumers at all level of usage. Many researches have estimated that, the highest power quality disturbances attributed because of the development and usage of new power semiconductor devices, as well as new converters in electrical power system. These disturbances can lead to failure and malfunction of many sensitive loads connected to the power system, thus incurring a high cost for end user. According to the data provided, Semiconductor Manufacturer in Malaysia is losing between RM 55,000 caused by power quality disturbances [1]. Therefore, an accurate technique is required to determine, identify and remove this problem efficiently.
Importantly, an identification and analysis gives information in characterizing the characteristic power system and improving power quality. To improve the power quality, an effective monitoring system must be developed for detection and classification of power quality disturbances. Fast detection on power quality problem enable the utility personnel to mitigate efficiently, and at the same time it will improve the reliability and quality of the power system network.
Signal processing techniques have been widely used for automatic power quality disturbances detection and classification [1-3]. This techniques provide several functionalities such as disturbance detection, classification, source identification, source localization and parameter estimation [2-5]. Fourier transform is a traditional signal processing technique that only provide the spectral information of the disturbances and track the changes in disturbances magnitude, frequency and phase with time, inadequately [6].
Applied Mechanics and Materials Vols. 752-753 (2015) pp 1343-1348 Submitted: 10.10.2014
© (2015) Trans Tech Publications, Switzerland Revised: 14.12.2014
doi:10.4028/www.scientific.net/AMM.752-753.1343 Accepted: 15.12.2014
In this research, S-transform is employed to analyze the power quality disturbances. This techniques is used to represent the disturbances in time-frequency representation (TFR) which is then used for signal parameters estimation such as instantaneous of root mean square (RMS), fundamental RMS, total harmonic distortion (THD),total nonharmonic distortion (TnHD) and total waveform distortion of the disturbances. The characteristics of real power quality disturbances are also calculated from the signal parameters and are used as input for signal classifier. Experimental results show that, S-transform gives a good performance in analyzing the real power quality disturbances.
S-transform
S-transform is a combination of frequency dependent resolution with simultaneous localizing the real and imaginary spectra. The general S-transform is defined as equation below: [6, 7]
∫
∞where h(t) is the signal of interest and g(t) is a window function. Windows function is a modulated Gaussian function expressed by:
where standard deviation, σ is function of time and frequency, f defined as:
f
1
=
σ (3)
In other words, the windows function is a function of time and frequency. The width of window is determined by frequency. It can be seen that the window is wider in the time-domain for lower, and narrower for higher frequencies [7].
Experimental Setup
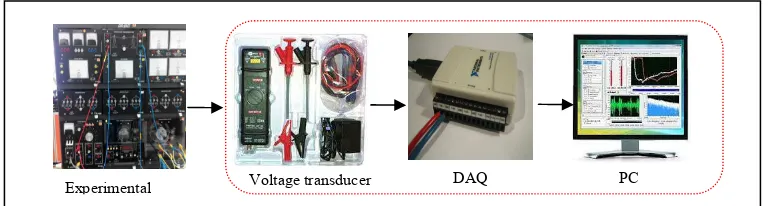
The basic hardware configuration of the procedure for capturing and recording the output voltage waveform is presented in Fig. 1.
Fig. 1 Hardware configuration for the laboratory test
This process includes three parts which are sensor (voltage transducer), USB data acquisition card (DAQ) NI 6009 and a personal computer (PC) running with LabVIEW software. In this research, voltage transducer is used to capture the disturbances. The input range of voltage transducer is 700Vpeak-peak and the output signal of the transducer is sampled using 14bit DAQ card. The DAQ card is designed with 8 analog input channels, and the input range voltage is 5V with 48Ks/S of maximum sampling rate. A personal computer with LabVIEW software enable the user to design a graphical user interface (GUI).
Voltage transducer DAQ PC
Experimental
Real Power Quality Disturbances
An experiment is conducted at Laboratory Faculty of Electrical Engineering, Universiti Teknikal Malaysia Melaka to capture real data of power quality disturbances. The disturbances are then analyzed in offline condition using Matlab to observe the effectiveness of S-transform in extracting the information of power quality disturbances. The experiments are performed with two different test systems to produce harmonic and sag disturbances. For harmonic disturbances, voltage source inverter circuit is constructed, whereas the effect of sag disturbances is obtained by starting a 240Vac single induction motor.
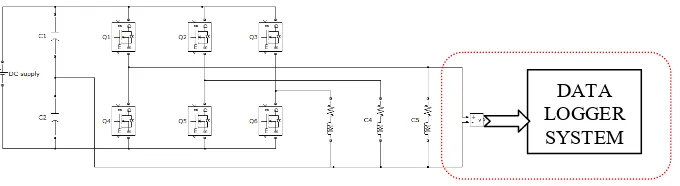
Fig. 2 illustrates a schematic diagram for voltage source inverter that produces harmonic disturbances. The voltage source inverter uses a diode rectifier to converts voltage from AC voltage to DC. The inverter composes of insulated gate bipolar transistor (IGBT) semiconductor switches. The IGBT switches generate a PWM voltage output that regulates the voltage and frequency to the motor.
Fig. 2 Schematic diagram of inverter
Fig. 3 shows the experimental setup in laboratory for three phase inverter system. This testing is selected for analysing the harmonic created by three phase inverter. The main components required are single phase dc supply, IGBT switch, inductor, and resistor. The disturbances are observed while turning on the dc supply. The output waveform of the disturbance is presented in results section. The real data of each phase of inverter are recorded and collected using LabVIEW. The measurements of disturbances are performed at the output of voltage inverter. The power quality disturbances are captured, recorded and saved in a file by the data logger system. The file is then analyzed in offline using Matlab. The starting large induction motor will cause voltage sag disturbances. An induction motor requires a higher current supply than the nominal. This current remains high until the motor gradually reaches its rated speed.The experimental setup for induction motor starting is shown in Fig. 4. In this experiment, a single phase 240Vac source supplies an induction motor (175W – 1415Nm) .Once the switch is closed, the effect of voltage condition during starting motor is observed
Fig. 3 Three phase inverter Fig. 4 Starting motor
Data Logger System
Data logger system is developed in LabVIEW graphic programming environment. The system acquires and stores, continuously, disturbances generated from the experiment setup. LabVIEW programs is generally called as virtual instruments (VI). It is divided into two parts which are front panel and block diagram. Front panel is the user interface, where the controls and indicators are provided as shown in Fig. 5, 6 illustrates the block diagram to record power quality disturbances
3 phase inverter
PC with LabVIEW
Voltage transducer
DATA LOGGER SYSTEM
Switch
240Vac Motor
Dynamoter
involving of interfacing data, displaying the output waveform graph, recording and storing the data in a user specified file. To obtain the real value, the ratio hundred is multiplied based on the specification of voltage transducer.
Fig. 5 Front panel Fig. 6Block diagram LabVIEW
Results
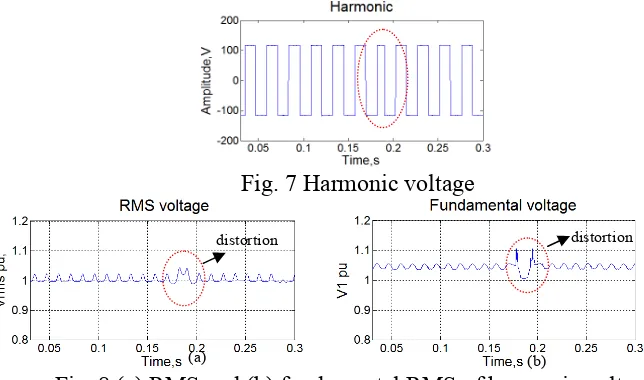
The voltage waveform containing the harmonic disturbance of inverter system is presented in Fig. 7. According to this disturbance it shows that a small distortion occur at 0.2s. In Fig.8, the measured value of continuous monitoring of RMS voltage and fundamental RMS voltage for inverter system are shown. The value of RMS and fundamental voltage for harmonic disturbance is 1 pu. This parameter also illustrates a small distortion happen at 0.2s. The time occurrence of distortion is similar to the original harmonic disturbance as referred in Fig. 7.
Fig. 7 Harmonic voltage
Fig. 8 (a) RMS and (b) fundamental RMS of harmonic voltage
The harmonic spectrum in Fig. 9 is obtained using fast fourier transform and it clearly show that, the disturbance consists of fundamental and harmonic component which are 50Hz and 125Hz, respectively. Fig. 10 shows the harmonic in TFR using S-transform. The x-axis represents the time meanwhile the y-axis represents the frequency of the disturbance. It clearly indicates that, the highest frequency of the harmonic is 200Hz and
the lowest frequency is 50Hz. The highest and lowest amplitude are represented in red and blue colour, respectively. By comparing the Fig. 9 and Fig. 10, there obviously show that S-transform gives more information compared to the fourier transform.
Fig. 9 Power spectrum Fig. 10 TFR S-transform
distortion
125Hz
50Hz 50Hz
125Hz 200Hz
(b)
distortion distortion
(a)
The ouput waveform of voltage after switches close can be illustrated in Fig. 11. The voltage is 365V during the normal condition until the switch is closed at 0.65s,which presents a sag voltage of 315V at 0.65s. The results of the real recorded voltage motor starting in Fig. 11 is analyzed using S-transform.
Fig. 11 Voltage sag
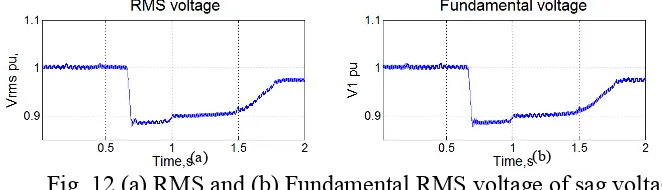
Fig. 12a and Fig. 12b show the comparison of detection results for RMS and fundamental voltage obtained using S-transform. The effect of starting motor can be seen in RMS voltage results. Before the motor is connected to the supply within 0s to 0.65s the RMS voltage is l pu.
Fig. 12 (a) RMS and (b) Fundamental RMS voltage of sag voltage
Fig. 13a shows the power spectrum of starting motor which consists only fundamental frequency which is 50Hz. Fig. 13b shows the TFR plot of sag voltage and it is found that the contours indicates the presence of sag disturbances at 0.65s. Fig. 13b also indicates the TFR contours for S-transform that emphasize around the fundamental frequency of 50 Hz with the decreasing magnitude during starting motor.
Fig. 13 (a) Power spectrum and (b) time-frequency reprentation of the sag voltage
The parameter results of THD,TnHD and TWD are presented in Fig.14. The disturbance shows zero percent of THD and TnHD because it only consists the fundamental frequency. The value of TWD is similar with THD because TWD is summation of THD and TnHD.
Figure 14 : (a) THD , (b) TnHD and (c) TWD of the sag voltage.
normal sag normal
50Hz
sag
(b) (a)
(a) (b)
(a)
(b)
(c)
Conclusion
Nowadays, the interest in using power electronic devices and converter are increasing. These devices should be tested for identifying the response to the power quality disturbances. In this paper, the data monitoring for power quality disturbances system is successfully developed on virtual instrument using LabVIEW. This system has been tested, extensively, using laboratory experimental setup. An experimental study demonstrates the design and operation in generating a real power quality disturbances. An analysis of power quality disturbances using S-transform is, graphically, performed. The result shows that, S-transform is a good solution to analyze power quality disturbances compared to the fourier transform and it also gives an evident that the S-transform provides clear information on the existence of voltage sag and harmonic of the recorded disturbances.
Acknowledgment
The authors gratefully acknowledge the contributions of Ministry of Higher Education (MOHE) and Universiti Teknikal Malaysia Melaka (UTeM) for providing the research grant FRGS (RACE)/2012/FKE/TK02/02/2 F00152 for this research.
References
[1] R.L. Allen and D. Mills, Signal Analysis: Time, Frequency, Scale, and Structure: Wiley, (2004). [2] Y.H. Wang, The Tutorial : S-transform, National Taiwan University, Taipei, Taiwan, ROC,
Taiwan, (2006).
[3] R.G. Stockwell, A basis for efficient representation of the S-transform, Digital Signal Processing, 17 (2007) 371-393.
[4] A. Rodriguez, J.A. Auado, J.J. Lopez, F. Martin, F. Munoz and J.E. Ruiz, Time-Frequency Transform for Classification of Power Quality Disturbances, (2011) 313-330
[5] O. Poisson, P. Rioual and M. Meunier, Detection and measurement of power quality disturbances using wavelet transform, Power Delivery, IEEE Transactions on, 15 (2000) 1039-1044.
[6] N.H.T. Ahmad, A.R. Abdullah, N.A. Abidullah and M.H. Jopri, Analysis of power qualitY disturbances using spectrogram and S-Transform, Int. Rev. Elect. Eng. 9 (3) (2014) 611-619. [7] N. Nordin, A.R. Abdullah, N.Q.Z. Abidin and A. Amin , Leakage Current Analysis on Polymeric
and Non-Polymeric Insulating Materials Using Time-Frequency Distribution, IEEE International Conference on Power and Energy (PECON 2012), Sabah, Malaysis, 2-5 December, (2012).