Power Quality Signals Detection Using S-Transform
N.H.T.Huda, A.R. Abdullah, M.H Jopri Faculty of Electrical Engineering Universiti Teknikal Malaysia Melaka (UTeM)
Malacca, Malaysia
Abstract- Power quality has become very important issue over the last decade. Poor quality can cause equipment failure, data and economical. An automated monitoring system is needed to ensure signal quality, reduces diagnostic time and rectifies failures. In this paper, S-transform is used to analyze the power quality signals such as swell, sag, interruption, harmonic, interharmonic and transient based on IEEE Std. 1159-2009 to detect, localize and classify the disturbance. The S-transform is used to represent the signals in time-frequency representation (TFR). ).To get an accurate TFR, the parameters are estimated to identify the signal characteristics. The signal characteristics are the root means square voltage (Vrms), total harmonic distortion (THD), total non harmonic distortion (TnHD) and total waveform distortion (TWD). To verify the performance of S-transform several sets of data with different time duration are analyzed to determine the accuracy of S-transform. The lowest value of mean absolute percentage error (MAPE) gives the highest accuracy to provide the best performance of TFD.
I. INTRODUCTION
Power quality is the availability of pure sinusoidal voltage and current waveforms at 50 Hz (frequency power-line in Malaysia) without any disturbances at the incoming point of the supply system. Power quality problem results in failure or manifested in voltage, current or frequency deviations with results in the failure or disoperation of end-use equipment or customer equipment and it also produces the burden to the user and give a negative impacts on the environmental[1]. Power quality problems can cost business billions of dollars each year in lost revenue, process improvement and scrapped product. Major causes of power quality related revenue losses are interrupted manufacturing processes and computer network downtime[2]. In order to understand the causes of equipment damaged due to disturbances in power line so it required an automated system that can work online for power quality analysis. Conventional techniques that are currently used for power quality monitoring are based on visual of voltage and current waveforms. The available equipment in the market for the inspection can capture and print the power quality data only at the current time. Therefore, a real time computerized and automated technique for monitoring and analysis is implementing to improve the power quality signal. The real-time monitoring capable to classify the type of disturbance and detect the disturbances, computing parameters such as frequency, time and amplitude of power quality signal, and also find the effective methods to mitigate them.
Power quality signal analysis is carried out using transformation technique. Many techniques were presented by various researchers for detect, analyzing or classifying power
quality problems in real time .One of the most widely used is in signal processing is spectral analysis using Fourier analysis which is Fourier transform[3]. The Fourier transform is powerful technique for stationary signal because the characteristics of the signal not change with time but it not useful for non stationary signal because is inadequate to track the changes in the magnitude, frequency or phase[3, 4]. Because of this problem the time-frequency representation is introduced. There are several time frequency distributions technique which is wavelet transform, short time Fourier transform (STFT), Gabor transform, S-transform, and spectrogram[3-7]. However, this paper focuses on time-frequency analysis techniques to identify the signals in time frequency domain because of the limitation of Fourier transform which does not provide temporal information of different frequency[3, 4].The STFT most often used but it cannot track the signal dynamics properly for non-stationary signal due to limitation of fixed window width[4, 8] .Wavelet transform is good to extract the information from both time and frequency domains but wavelet transform is sensitive to noise and cannot identify the sag and swell and also transient condition but the S-transform exhibit the ability of identifying the power quality disturbances correctly[6, 8, 9]
The S-transform is proposed by Stockwell et al (1996 which time frequency spectral localization method that combine element of wavelet transform and short time Fourier transform (STFT)[5, 6, 10, 11].The S-transform has a frequency dependant resolution of time- frequency domain and entirely refers to phase information. The S-transform is required to emphasize the time resolution in the beginning time and frequency resolution in the later of beginning time[6].the advantage of S-transform provides multiresolution analysis while retaining the absolute phase of each frequency.
In this paper, S-transform technique is used to represent the signals in time-frequency representation (TFR) and then the signal parameters are estimated and the characteristics of the signals are calculated from the signal parameters. The MAPE result is used to identify the accuracy of the signal characteristics that are calculated from TFR. Lastly, the performance of this system is verify by simulate the several signals with different characteristics for each type of power quality signal in order to determine the performance of TFD.
II. SIGNAL MODEL
interharmonic are for waveform distortion and transient is for transient signal. The signal models of the categories are formed as a complex exponential signal based on IEEE Std. 1159-2009[12-15] and can be defined as : -
∑
waveform distortion and ztrans(t) represents transient signal. k
is the signal component sequence, Ak is the signal component
amplitude, f1 and f2 are the signal frequency, t is the time
while Π(t) is a box function of the signal. In this analysis, f1, t0
and t3 are set at 50 Hz, 0 ms and 250 ms, respectively, and
other parameters are defined as below :-
1. Swell: A1= A3 = 1, A2 = 1.2, t1= 70 ms, t2= 170 ms
Time-frequency analysis techniques present a three-dimensional plot of a signal in terms of the signal energy or magnitude with respect to time and frequency. This study focused on S-transform to perform time-frequency of power quality signals.
A. S-transform
The S-transform is combination a frequency dependent resolution with simultaneous localizing the real and imaginary spectra .The general S-transform is defined by the equation [4, 6]. Windows function is a modulated Gaussian function expressed by
and the final expression is becomes
∫
∞Parameters of the signal are estimated from the time frequency representation (TFR) to identify the signal information in time. This information is important to detect the power quality signals [16]
A. Instantaneous RMS Voltage
The instantaneous RMS voltage is
df
maximum frequency of interest.
B. Instantaneous Fundamental Voltage
Instantaneous RMS fundamental voltage is defined as the RMS voltage at power system frequency [17]. It can be calculated as
2
where f1 is the fundamental frequency that corresponds to the
power system frequency and Δfis the bandwidth. In this paper,Δfis set at 50Hz.
C. Instantaneous Total Waveform Distortion
Waveform distortion represents all deviations of the voltage waveform from the ideal sinusoidal waveform in terms of magnitude or frequency the signal[17]. The instantaneous total waveform distortion can be expressed as:-
)
where V1rms(t) is the instantaneous RMS fundamental voltage
and Vrms(t) is the instantaneous RMS voltage.
D. Instantaneous Total Harmonic Distortion
(t)
highest measured harmonic component
E. Instantaneous Total Nonharmonic Distortion
Voltage often contains interharmonic components that are not multiple integer of the power system frequency. For example, a 50 Hz signal distorted with a 255 Hz interharmonic [14,15]. It can be written as:-
The characteristics of power quality signals are calculated from the signal parameters. The characteristics present the information of the signal and are used as input for signal classifier to classify power quality signals. By using the instantaneous RMS voltage, four signal characteristics can be calculated such as duration of swell, sag, interruption and average of RMS voltage and can be respectively defined as:[14]
meanwhile, duration of transient can be identified from the instantaneous total waveform distortion and can be expressed as:-
where TWDtrans,thres is the total waveform distortion threshold
for transient. In this study, the threshold is set at 0.1.
Total harmonic distortion average and total interharmonic distortion average are also important characteristics. They can be calculated, respectively from the instantaneous total harmonic distortion and instantaneous total interharmonic distortion as follows:-
∫
In this section, the results of the power quality analysis are discussed. Fig.1 to Fig.6 shows the examples of power quality signals are represented in TFD using S-transform technique.
Analysis results were obtained from the TFD of power quality signals and the parameters that are analyzed are RMS, THD, TWD and TnHD values.
A. Signal Analysis for Voltage Variation
Voltage variations have three classes which is voltage sag, voltage swell and interruption signal. The characteristics of this signal are calculated from signal parameters by using instantaneous RMS voltage and its duration
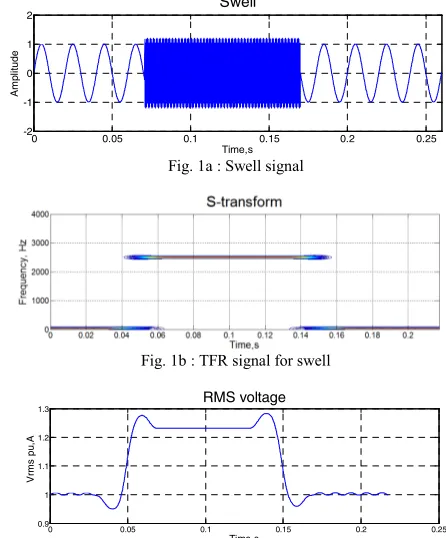
Fig.1a show the example of swell signal with magnitude of swell signal is 1.2 pu between 70 untill 170ms at 50 Hz (fundamental frequency) and 2500 Hz (multiple frequency).The contour TFR in Fig.1b shows that there is a momentary increase of power at 2500Hz (multiple frequency) from 45ms 154ms. The red colors in contour represent the highest power while the lowest power in blue color. Fig.1c shows that the RMS voltage increases from 1 pu to 1.2 pu starting at 50ms for duration of 100ms.
0 0.05 0.1 0.15 0.2 0.25
In Fig.1c-d shows a total harmonic distortion (THD), total nonharmonic distortion (TnHD) and total waveform distortion (TWD) for the swell signals. The signal has THD 120 % at 50ms to 150ms and zero TnHD because the signal only consist multiple frequency, 2500Hz.The value of TWD is similar with THD because TWD is summition of THD and TnHD.
0 0.05 0.1 0.15 0.2 0.25 0
50 100 150
Total Harmonic Distortion, THD
Time,s
P
er
c
en
ta
ge
%
Fig. 1d : Total harmonic distortion, THD for voltage swell
0 0.05 0.1 0.15 0.2 0.25 -1
-0.5 0 0.5 1
Total Non-Harmonic Distortion, TnHD
P
er
c
en
ta
ge
,%
Time,s
Fig. 1e : Total nonharmonic distortion, TnHD for voltage swell
0 0.05 0.1 0.15 0.2 0.25 0
50 100
150 Total Waveform Distortion,TWD
Time,s
Per
c
ent
age %
Fig. 1f : Total waveform distortion, TWD for voltage swell
B. Signal Analysis for Waveform Distortion
Harmonic and interharmornic are categorized in waveform distortion. The modelling of this signals are discussed in previous chapter. Harmonic signals occur when the signal consist multiple integer frequency at fundamental frequency, whereas interharmonic occur at non integer multiple frequency integer. The value of THD and TnHD is used to calculate the characteristic of this signals.
The examples of the interharmonic signals are shown in Fig.2, the signal consist of three frequency component wherein fundamental frequency 50Hz, 3556Hz and 4555 Hz.
Fig.2b show the time frequency representation for interharmonic signal.
0 0.05 0.1 0.15 0.2 0.25 -3
-2 -1 0 1 2 3
A
m
p
lit
u
d
e
Time,s Interharmonics Signal
Fig. 2a : Interharmonic signal
Fig. 2b : Time frequency representation using S-transform
Fig.2b shows the signal parameter of interharmonic signal were estimated from TFR of S-transform. Fig.2c show the RMS voltage of interharmonic signal constant at 1.54pu.The THD is zero along the axis as per Fig.2d.However the TnHD and TWD are steady at 92.36% as shown in Fig.2e and Fig.2f.Therefore the figure clearly shows that the signal only consist of interharmonic component.
0 0.05 0.1 0.15 0.2 0.25 0
0.5 1 1.5
V
rm
s
pu,
A
Time,s
RMS voltage
Fig. 2c : RMS voltage for interharmonic signal
0 0.05 0.1 0.15 0.2 0.25 -1
-0.5 0 0.5
1 Total Harmonic Distortion, THD
Time,s
P
e
rc
en
tage,
%
Fig. 2d : Total harmonic distortion , THD for interharmonic signal
0 0.05 0.1 0.15 0.2 0.25 0
20 40 60 80
100 Total Non-Harmonic Distortion, TnHD
Pe
rc
ent
ag
e,
%
Time,s
Fig. 2e : Total nonharmonic distortion ,TnHD for interharmonic signal
0 0.05 0.1 0.15 0.2 0.25 0
20 40 60 80 100
Total Waveform Distortion,TWD
Time,s
Pe
rc
ent
ag
e ,
%
Fig. 2f : Total waveform distortion ,TWD for interharmonic signal
C. Signal Analysis for Transient
60 80 100 120 140 160 180 0.9
1 1.1
Instantaneous RMS Voltage
Time (msec)
A
m
pl
it
ude (
pu)
60 80 100 120 140 160 180
0 50
Instantaneous Total Harmonic Distortion
Time (msec)
P
e
rc
en
ta
g
e
(%
)
60 80 100 120 140 160 180
0 50
Instantaneous Total Nonharmonic Distortion
Time (msec)
P
er
c
ent
ag
e (
%
)
60 80 100 120 140 160 180
0 50
Instantaneous Total Waveform Distortion
Time (msec)
P
er
c
ent
age (
%
)
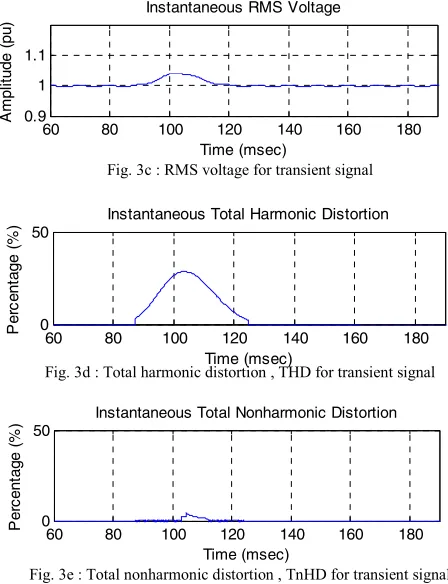
are fundamental frequency and transient frequency at 1000Hz. The TFR also illustrates the duration of transient using S-transform and frequency of transient signal.
60 80 100 120 140 160 180
-1 0 1
Power Quality Signal
Time (msec)
A
m
pl
it
ud
e (
p
u)
Fig. 3a : Transient signal
Fig. 3b : Time frequency representation using S-transform
As shown in Fig.3c, 3d, and 3f, RMS voltage, THD and TWD respectively increased from normal magnitude between 97ms to 116ms It indicates that the duration of transient happen.
Fig. 3c : RMS voltage for transient signal
Fig. 3d : Total harmonic distortion , THD for transient signal
Fig. 3e : Total nonharmonic distortion , TnHD for transient signal
Fig. 3f : Total waveform distortion ,TWD for interharmonic signal
D. Performance Measurement using S-transform
To determine the optimal technique, time-frequency analysis by using S-transform, several set of signals with different time duration have been used to analyze the accuracy of signal characteristics. Each set was tested and the simulation results were collected by using simulation software, MATLAB. In order to assess accuracy of the simulation results, mean absolute percentage error (MAPE) was used as index. Smaller value of MAPE offers more accurate results. It can be define as [18, 19]
(19)
where xi (n) is actual value, xm(n) is measured value and N is
number of data.
The duration for voltage variation signals which is voltage sag, swell, and interruption signal are measured based on characteristic of power quality signal in IEEE 1159-2009 standard. The accuracy of the analysis is important to determine the best TFD.Fig.4 shows the results of the accuracy of the analysis are plotted in one graph. The sag signal values closer to actual time duration compared to the interruption and swell signals.
Fig. 4 : Accuracy of the Analysis of Voltage Variations
VI. CONCLUSION
As a conclusion, this paper presents the analysis and characteristics of power quality signals using S-transform. The observation clearly shows that the TFR represent the useful to determine the characteristics of the power quality signals. The performance of this analysis is verified by using several set of data with various characteristics power quality signals. The results prove that the S-transform provides optimal performance in terms of accuracy.
% 100 )
( ) ( ) ( 1
1
x n x
n x n x N MAPE
N
n i
m i
∑
−
ACKNOWLEDGMENT
The authors would like to thank Universiti Teknikal Malaysia Melaka (UTeM) for its financial support Malaysia for providing the resources for this research.
REFERENCES
[1] Electrical Power System Qual: McGraw-Hill, 2003.
[2] A. Kusko and M. T. Thompson, Power Quality in Electrical
Systems: McGraw-Hill, 2007.
[3] M. H. Bollen and I. Gu, Signal Processing of Power Quality
Disturbances: Wiley, 2006.
[4] R. L. Allen and D. Mills, Signal Analysis: Time, Frequency,
Scale, and Structure: Wiley, 2004.
[5] R. G. Stockwell, L. Mansinha, and R. P. Lowe, "Localization of the complex spectrum: the S transform," Signal
Processing, IEEE Transactions on, vol. 44, pp. 998-1001,
1996.
[6] Y.-H. Wang, "The Tutorial : S-transform," National Taiwan University, Taipei,Taiwan,ROC, Taiwan, 2006.
[7] C. R. P. a. L. Manshinha, "The S-transform with windows of arbitrary and varying shape," 2003.
[8] R. G. Stockwell, "A basis for efficient representation of the S-transform," Digital Signal Processing, vol. 17, pp. 371-393, 2007.
[9] S. Zhang, L. Ruirui, Q. Wang, J. T. Heptol, and G. Yang, "The research of power quality analysis based on improved S-Transform," in Electronic Measurement & Instruments,
2009. ICEMI '09. 9th International Conference on, 2009,
pp. 2-477-2-481.
[10] I. W. C. Lee and P. K. Dash, "S-transform-based intelligent system for classification of power quality disturbance signals," Industrial Electronics, IEEE Transactions on, vol. 50, pp. 800-805, 2003.
[11] Z. Leonowicz, T. Lobos, and K. Wozniak, "Analysis of non-stationary electric signals using the S-transform," COMPEL: The International Journal for Computation and
Mathematics in Electrical and Electronic Engineering, vol.
28, pp. 204-210, 2009.
[12] "IEEE Recommended Practice for Monitoring Electric Power Quality," IEEE Std 2009 (Revision of IEEE Std
1159-1995), pp. c1-81, 2009.
[13] A. R. Bin Abdullah, A. Z. Bin Sha''ameri, and A. B. Jidin, "Classification of power quality signals using smooth-windowed Wigner-Ville distribution," in Electrical Machines and Systems (ICEMS), 2010 International
Conference on, 2010, pp. 1981-1985.
[14] A. R. Abdullah, A. Z. Sha''ameri, A. R. M. Sidek, and M. R. Shaari, "Detection and Classification of Power Quality Disturbances Using Time-Frequency Analysis Technique,"
in Research and Development, 2007. SCOReD 2007. 5th
Student Conference on, 2007, pp. 1-6.
[15] A. R. A. a. A. Z. Sha'ameri, "Power Quality Analysis Using Bilinear Time Frequency Distribution," Journal on
Advances in Signal Processing, vol. Volume 2010, p. 18,
2010.
[16] A. R. Abdullah, A. Z. Sha'ameri, N. A. Mohd Said, N. Mohd Saad, and A. Jidin, "Bilinear time-frequency analysis techniques for power quality signals," 2012, pp. 991-995. [17] A. Z. M. M. C. R. Bansal, "Power Quality Monitoring Analysis
and Enhancement," in Power Quality Monitoring Analysis
and Enhancemented, 2011.
[18] A. R. Abdullah, A. Z. Sha''ameri, and N. M. Saad, "Power quality analysis using spectrogram and gabor transformation," in Applied Electromagnetics, 2007.
APACE 2007. Asia-Pacific Conference on, 2007, pp. 1-5.
[19] A. R. Abdullah and A. Z. Sha''ameri, "Power quality analysis using linear time-frequency distribution," in Power and Energy Conference, 2008. PECon 2008. IEEE 2nd