Power Quality Signals Classification System using Time-frequency
Distribution
A. R. Abdullah
1,
N. A. Abidullah
2, N. H Shamsudin
3,
N. H. H. Ahmad
4,
M. H. Jopri
51, 2, 3, 4,5
Faculty of Electrical Engineering, Universiti Teknikal Malaysia Melaka, Malaysia 1
[email protected], [email protected], 3
[email protected],[email protected], [email protected],
Keywords: Power quality, time-frequency distribution and spectrogram
Abstract. Power quality signals are an important issue to electricity consumers. The signals will affect manufacturing process, malfunction of equipment and economic losses. Thus, an automated monitoring system is required to identify and classify the signals for diagnosis purposes. This paper presents the development of power quality signals classification system using time-frequency analysis technique which is spectrogram. From the time-frequency representation (TFR), parameters of the signal are estimated to identify the characteristics of the signals. The signal parameters are instantaneous of RMS voltage, RMS fundamental voltage, total waveform distortion, total harmonic distortion and total non harmonic distortion. In this paper, major power quality signals are focused based on IEEE Std. 1159-2009 such as swell, sag, interruption, harmonic, interharmonic, and transient. An automated signal classification system using spectrogram is developed to identify, classify as well as provide the information of the signal.
Introduction
The quality of power system has become an important issue to electricity users at all levels of usage. The ability to maintain voltage and current signals with constant amplitude and constant fundamental frequency presents the quality of electrical power supplied to the customers [1]. The power quality signals can cause failure or disoperation of equipment and economic problem. Thus, an real-time power quality signals detection and classification system is needed in order to provide adequate coverage of the entire system, understand the causes of these signals, resolve existing problems and predict future problems [2]. Prompt and accurate diagnosis of signals will ensure quality of power, reduce the risk of interruptions by reducing the time to diagnose and rectify failures [3].
The proper diagnosis of power quality signals requires a high level of engineering expertise [4]. The diagnosis of power quality required expert knowledge in many areas of electric power such as transformers, power electronics, power supplies, protection, power system faults, harmonics, signal analysis, measuring instruments, and general power systems operation [5]. The poor power quality can cause reduction of the lifetime of the load, the bad working of protection devices, instabilities, interruptions in production and significant costs in lost production and downtime [6].
Many techniques were presented by various researchers for classifying power quality signals. The most widely used is in signal processing is spectral analysis using Fourier analysis which is Fourier transform. The Fourier transform is powerful technique for stationary signal because the characteristics of the signal not change with time but it not useful for non stationary signal because is inadequate to track the changes in the magnitude, frequency or phase [7]. The time-frequency representation is introduced for overcome the limitation of this technique. There are numerous of time frequency distributions technique which is wavelet transform, short time Fourier transform (STFT), Gabor transform, S-transform, and spectrogram [7,8]. However, this paper focuses on time a frequency analysis technique which is spectrogram to identify the signals in time frequency domain.
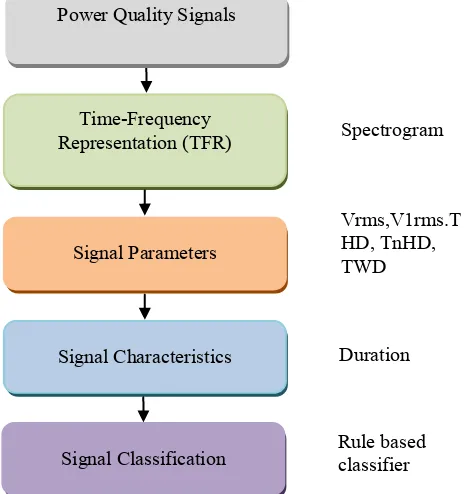
In this paper, spectrogram technique is implemented for power quality signals classification system. The power quality signals are analyzed by representing in time frequency representation (TFR). From TFR, parameters of the power quality signals are estimated such as RMS and fundamental value, total harmonic distortion (THD), total nonharmonic distortion (TnHD) and total waveform distortion (TWD) for voltage and current. Then, the signal parameters are used for classification of power quality signals such as sag, swell, interruption, harmonic, interharmonic and transient. The general system design based on IEEE Std. 1159-2009 as shown in flow chart in Fig.1.
Fig. 1: Flow chart of the general system design.
Signal Model
In this paper, power quality signals are divided into three categories which are voltage variation, waveform distortion and transient signal [9]. Voltage variation consists of swell, sag and interruption while waveform distortion consists of harmonic and interharmonic. Based on IEEE Std. 1159-2009, the signal models of the categories are formed as a complex exponential signal and can be defined as:
Time-Frequency Analysis Technique
Spectrogram is one of linear time-frequency distributions (TFD) that represents the signal in time and frequency domain. The analysis technique is improvement of FFT to cater non-stationary signals whose spectral characteristics change in time. It is the result of calculating the frequency spectrum of windowed frames of a compound signal [10]. This technique can be defined as:
2 where x(t) is the input signal and w(t) is the observation window.
Signals Classification
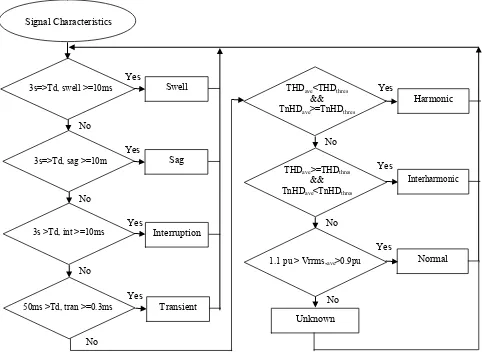
Rule-based classifier is a deterministic classification method which is simple and easy to be implemented. Since the signal characteristics provide good prior knowledge of the power quality signals, the rule-based is suitable to be used for signal classification as discussed in [11]. Flow chart in Fig.2 describes a rule based classifier of the power quality signals based on the signal characteristics. The threshold settings are set based on IEEE std. 1159-2009.
Fig.2: Flow chart of the rule based classifier.
Yes
50ms >Td, tran >=0.3ms 3s >Td, int >=10ms
3s=>Td, sag >=10m
3s=>Td, swell >=10ms THDave<THDthres
&& TnHDave>=TnHDthres
THDave>=THDthres
System Development
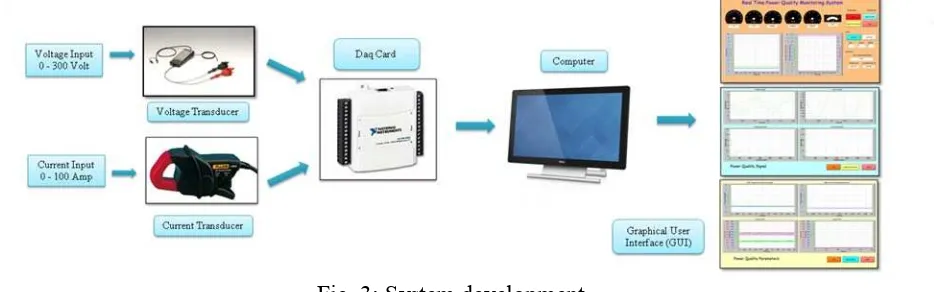
The power quality signals classifiction system consists of three major parts which are input, interfacing and computer as shown in Fig.3. In this system, voltage and current transducers that are used as input can measure power line voltage and current up to 500 V and 100 A, respectively. The transducers are connected to data acquisition card (DAQ) for interfacing with computer.
Fig. 3: System development
DAQ involves the conversion of analog waveforms into digital values and transfers the data to computer. In this system, NI USB 6009 used gives better accuracy, flexible, maximized performance and cost-effective measurement solution. It provides connection to eight single-ended analog input (AI) channels, two analog output (AO) channels, 12 digital input/output (DIO) channels, and a 32-bit counter with a full-speed USB interface.
On computer, a user-friendly graphical user interface (GUI) is developed using Visual Basic to analyze the captured signals from DAQ and then displays and record the signal parameters. Visual Basic is a programming system that offers an exciting experience with a new integrated development environment. It is a tool used to design and create graphical user interface (GUI) applications for the Microsoft Windows of operating systems. The interface of Visual Basic is well organized, optimized for fast functionality and its simplicity is an advantage for programmers.
Results
The development graphical user interface (GUI) of the power quality signals classification system is shown Fig.4. The system is capable of measuring all standard power line measurements such as voltage and current in RMS value, frequency, real power, reactive power, apparent power and power factor which are also plotted in graph. In addition, the system can detect and classify all the power quality signals such as swell, sag, interruption, harmonic, interharmonic and transient as well as provides the characteristics information of the signals which are the duration and percentage drop. Then, all the measurements can be collected and recorded into computer automatically.
Fig.4: Power quality measurement and classification
(a) (b)
(c) (d)
(e)
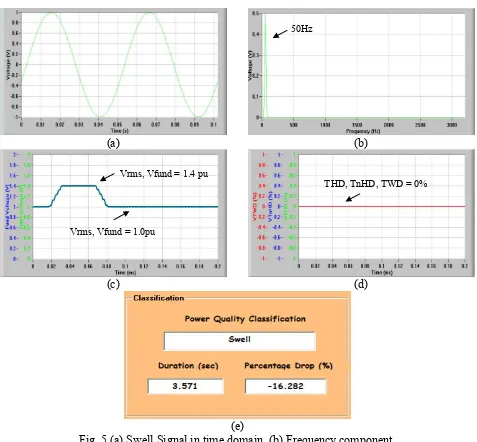
Fig. 5 (a) Swell Signal in time domain, (b) Frequency component,
(c) RMS voltage and RMS fundamental voltage, (d) THD, TnHD and TWD, (e) System classification
Record
Signal Classification Signal Measurement
50Hz
Vrms, Vfund = 1.4 pu
Vrms, Vfund = 1.0pu
Conclusion
This paper presents the analysis, detection and classification system of power quality signals by using spectrogram. Parameters of the signal are estimated from TFR then will be used to calculate signal characteristics that can be used as an input for classification of power quality signals. The system can classify major types of power quality signals such as sag, swell, interruption, transient, harmonic and interharmonic. An automated signal classification system using spectrogram is successfully developed to identify, classify as well as provide the information of the signal. Besides that, the system is able to show the signal including the standard power line measurements, its power spectrum and signal parameters that also can be stored in computer, automatically.
Acknowledgement
The authors would like to thank Ministry of Higher Education (MOHE) and Universiti Teknikal Malaysia Melaka (UTeM) for providing the research grant FRGS (RACE)/2012/FKE/TK02/02/2 F00152 for this research.
References
[1] Hasniaty, A. Mohamed, A. Hussain, “Automating Power Quality Signal Analysis Using the
IPQDA Software Tool”, IEEE in Proc. 2006 IEEE 4th Student Conference On Research and Development Conf., pp. 211-214.
[2] Howe, B. (2007). A New vision of PQ research for the next 10 years. International
Conference on Electrical Power Quality and Utilisation. October 1-6.1-5.
[3] Azam, M. S., Fang, T., Pattipati, K. R. and Karanam, R. (2004). A dependency model-based approach for identifying and evaluating power quality problems. IEEE Transactions on Power
Delivery. 19(3), 1154-1166.
[4] Jin, J., Wang, X., Wu, Y. and Yu, Y. (2009). Pseudo-period segment of ballistocardiogram based on joint time-frequency analysis. Proceedings of theIEEE International Conference on
Intelligent Computing and Intelligent Systems. July 10-13. 467-470.
[5] Reaz, M. B. I., Choong, F., Sulaiman, M. S., Mohd-Yasin, F. and Kamada, M. (2007). Expert System for Power Quality Disturbance Classifier. IEEE Transactions on Power Delivery. 22(3), 1979-1988.
[6] Zhenghua, Z., Yongqiang, L., Fuqiang, Z. and Mingzhi, P. (2009). Design and Data Processing of a Real-Time Power Quality Monitoring Instrument. Proceedings of the Ninth
International Conference on Electronic Measurement & Instruments, October 10-15.
134-139.
[7] M. H. Bollen and I. Gu, Signal Processing of Power Quality Disturbances: Wiley, 2006. [8] R. G. Stockwell, L. Mansinha, and R. P. Lowe, "Localization of the complex spectrum: the S
transform," SignalProcessing, IEEE Transactions on, vol. 44, pp. 998-1001,1996
[9] N. H. T. Huda, A. R. Abdullah, and M. H. Jopri, "Power quality signals detection using S-transform," in Power Engineering and Optimization Conference (PEOCO), 2013 IEEE 7th
International, 2013, pp. 552-557.
[10] A.R. Abdullah and A. Z. Sha’ameri, “Power quality analysis using linear time-frequency
distribution,” in Power and Energy Conference, 2008. PECon 2008. IEEE 2nd International, 2008, pp.313-317.
[11] A. R. Bin Abdullah, A. Z. Bin Sha’ameri, and A. B. Jidin, “Classification of power quality signals using smooth-windowed Wigner-Ville distribution,” in Electrical machines and