First published 2015
Copyright © 2015 by Centre for Advanced Research on Energy (CARe)
All rights reserved. No part of this publication may be reproduced, stored in a retrieval system, or transmitted, electronic, mechanical photocopying, recording or otherwise, without the prior permission of the Publisher.
ISBN: 978-967-0257-51-8 (online)
Published and Printed in Malaysia by: Centre for Advanced Research on Energy (CARe)
Faculty of Mechanical Engineering, Universiti Teknikal Malaysia Melaka, Hang Tuah Jaya, 76100 Durian Tunggal, Melaka, MALAYSI A.
ii
FOREWORD BY THE CHAIRMAN
Assalamu’alaikum wrt. wbt, and Salam Sejahtera,
I would like to express warmest welcome to all participants to the Mechanical Engineering Research
Day 2015 (MERD’15) held at Kampus Teknologi, Universiti Teknikal Malaysia Melaka (UTeM) - Melaka,
Malaysia. Alhamdulillah, all praise to Allah, this is the second event after successful responds at the first event in 2011. The current event is jointly organized by the Faculty of Mechanical Engineering and Centre for Advanced Research on Energy (CARe), UTeM with the theme ‘Pioneering Future Discovery’.
The aim of MERD’15 is to foster a broad range of sustainable collaboration among researchers,
expert, educators and participants, thus promoting new opportunities for research activities enhancement. This is in line with the increasing demand for innovative research ideas, design, optimizing, modeling, processing and solutions involving real engineering problems which advocate the provision of rigorous study among distinct communities.
Pioneering future discovery can gives big impact to the organization, human development and nation. Given ‘Pioneering Future Discovery’ as a theme, MERD’15 is a perfect and excellent platform for academicians, engineers and researchers in broad ranges of sustainable collaborations to share their knowledge of innovation, creativity and latest approaches in various research activities.
I would like to take this opportunity to convey my special thanks to those who are involved in
organizing MERD’15, especially from the Faculty staffs and CARe members for successfully organizing this
event.Finally, I would like to express our deepest gratitude to the sponsors for the support given in ensuring the success of this event.
Thank you.
Associate Professor Dr. Noreffendy Bin Tamaldin
Chairman, MERD’15
iii
Assalamu’alaikum wrt. wbt, and Salam Sejahtera,
Welcome to Mechanical Engineering Research Day 2015 (MERD’15)!
As the organizing director of MERD’15, it is my great pleasure to welcome all participants to the event, jointly organized by the Faculty of Mechanical Engineering (FKM) and Centre for Advanced Research on Energy (CARe) of Universiti Teknikal Malaysia Melaka (UTeM). This is much anticipated event which allows UTeM’s researchers to share and promote their research as well as a chance to extend their network in the mechanical engineering field.
MERD’15 is aimed to be a platform for researchers, academicians and practitioners to seal
advancement of engineering and finding through knowledge sharing and discussion related to current practices, innovations and trends. I t is hoped that this event will catalyze and increase academic and research collaborations between other institutions and respective industries involved. I sincerely believe this will spur further advancement of scientific research and fruitful co-operation between organizations.
Last but not least, I would also like to take this opportunity to express my utmost appreciation and many thanks to all members of the organizing committee and all others who have either directly or indirectly contributed towards the success of MERD’15. I wish all the best to the participants and hopefully, this event will provide new heights of research accomplishment for UTeM’s researchers.
Thank you.
Dr. Mohd Fadzli Bin Abdollah
Director,MERD’
15iv
FOREWORD BY THE EDITOR-IN-CHIEF
This Open Access e-Proceeding contains 74 selected papers from the Mechanical Engineering
Research Day 2015 (MERD’15) event, which is held in Kampus Teknologi, Universiti Teknikal Malaysia
Melaka (UTeM) - Melaka, Malaysia, on 31 March 2015. The theme chosen for this event is ‘Pioneering Future Discovery’.
The response for MERD’15 is overwhelming as the technical committees have received more than 90
papers from various areas of mechanical engineering. From the total number of submissions, the technical committees have selected 74 papers to be included in this proceeding. The selected papers are grouped into 12 categories: Advanced Materials Processing; Automotive Engineering; Computational Modeling and Analysis & CAD/ CAE; Energy Management & Fuels and Lubricants; Hydraulics and Pneumatics & Mechanical Control; Mechanical Design and Optimization; Noise, Vibration and Harshness; Non-Destructive Testing & Structural Mechanics; Surface Engineering and Coatings; Others Related Topic.
With the large number of submissions from the researchers in other faculties, the event has achieved its main objective which is to bring together educators, researchers and practitioners to share their findings and perhaps sustaining the research culture in the university. The topics of MERD’15 are based on a combination of advanced research methodologies, application technologies and review approaches.
As the editor-in-chief, we would like to express our gratitude to the editorial board members for their tireless effort in compiling and reviewing the selected papers for this proceeding. We would also like to extend our great appreciation to the members of the Publication Committee and Secretariat for t heir
excellent cooperation in preparing the proceedings of MERD’15.
Thank you.
Dr. Mohd Zulkefli Bin Selamat
Dr. Reduan Bin Mat Dan
Editor-in-Chief
v
Editor-in-Chief
Mohd Zulkefli Bin Selamat (FKM, UTeM, Malaysia) Reduan Bin Mat Dan (FKM, UTeM, Malaysia)
Editors
Abd Rahman Bin Dullah (FKM, UTeM, Malaysia) Abd Salam Bin Md Tahir (FKM, UTeM, Malaysia) Abdul Munir Hidayat Syah Lubis (FKM, UTeM, Malaysia) Abdul Talib Bin Din (FKM, UTeM, Malaysia)
Ahmad Anas Bin Yusof (FKM, UTeM, Malaysia) Ahmad Kamal Bin Mat Yamin (FKM, UTeM, Malaysia) Ahmad Rivai (FKM, UTeM, Malaysia)
Aliza Binti Che Amran (FKE, UTeM, Malaysia) Azma Putra (FKM, UTeM, Malaysia)
Cheng See Yuan (FKE, UTeM, Malaysia) Chong Shin Horng (FKE, UTeM, Malaysia) Faiz Redza Bin Ramli (FKM, UTeM, Malaysia)
Fatimah Al-Zahrah Binti Mohd Sa'at (FKM, UTeM, Malaysia) Herdy Rusnandi (FKM, UTeM, Malaysia)
Hilmi Bin Amiruddin (FKM, UTeM, Malaysia) I mran Syakir Bin Mohamad (FKM, UTeM, Malaysia) Mariam Binti Md Ghazaly (FKE, UTeM, Malaysia) Md I sa Bin Ali (FKM, UTeM, Malaysia)
Md. Fahmi Bin Abd. Samad @ Mahmood (FKM, UTeM, Malaysia)
Md Radzai Bin Said (FKM, UTeM, Malaysia)
Mohd Ahadlin Bin Mohd Daud (FKM, UTeM, Malaysia) Mohd Asri Bin Yusuff (FKM, UTeM, Malaysia)
Mohd Azli Bin Salim (FKM, UTeM, Malaysia) Mohd Azman Bin Abdullah (FKM, UTeM, Malaysia) Mohd Fadzli Bin Abdollah (FKM, UTeM, Malaysia) Mohd Haizal Bin Mohd Husin (FKM, UTeM, Malaysia) Mohd Juzaila Bin Abd. Latif (FKM, UTeM, Malaysia)
Mohd Khairi Bin Mohamad Nor (FKM, UTeM, Malaysia) Mohd Nizam Bin Sudin (FKM, UTeM, Malaysia) Mohd Rizal Bin Alkahari (FKM, UTeM, Malaysia) Mohd Zaid Bin Akop (FKM, UTeM, Malaysia) Mohd Zulkefli Bin Selamat (FKM, UTeM, Malaysia) Nona Merry Merpati Mitan (FKM, UTeM, Malaysia) Nor Azmmi Bin Masripan (FKM, UTeM, Malaysia) Norasra Binti A.Rahman (FKM, UTeM, Malaysia) Noreffendy Bin Tamaldin (FKM, UTeM, Malaysia) Nur Rashid Bin Mat Nuri @ Md Din (FTK, UTeM, Malaysia)
Omar Bin Bapokutty (FKM, UTeM, Malaysia) Rafidah Binti Hasan (FKM, UTeM, Malaysia) Rainah Binti I smail (FKM, UTeM, Malaysia) Roszaidi Bin Ramlan (FKM, UTeM, Malaysia) Safarudin Gazali Herawan (FKM, UTeM, Malaysia) Shamsul Anuar Bin Shamsudin (FKM, UTeM, Malaysia) Siti Hajar Binti Sheikh Md. Fadzullah (FKM, UTeM, Malaysia)
Siti Nurhaida Binti Khalil (FKM, UTeM, Malaysia) Sivakumar A/ L Dhar Malingam (FKM, UTeM, Malaysia) Sushella Edayu Binti Mat Kamal (FKM, UTeM,
Malaysia)
Tan Chee Fai (FKM, UTeM, Malaysia) Tee Boon Tuan (FKM, UTeM, Malaysia)
vi
ORGANIZING COMMITTEE
Chairman
Assoc. Prof. Dr. Noreffendy Bin Tamaldin
Director
Dr. Mohd Fadzli Bin Abdollah
Deputy Chairman
Dr. Abd Rahman Bin DullahDeputy Director
Dr. Tee Boon TuanSecretary
Dr. Umar Al-Amani Bin Haji Azlan Mrs. Suhaila Binti Mohd Yusof
Publication
Dr. Mohd Zulkefli Bin Selamat Dr. Reduan Bin Mat Dan
Submission
Dr. Rainah Binti I smail Mr. Hilmi Bin Amiruddin Mrs. Sushella Edayu Binti Mat KamalRegistration
Dr. Shamsul Anuar Bin Shamsudin Mr. Muhammad Zulfattah Bin Zakaria
Evaluation Panel
Prof. Dr. Md. Radzai Bin Said Assoc. Prof. I r. Dr. Abdul Talib Bin DinAssoc. Prof. Ahmad Rivai
Logistic and Technical
Dr. Mohd Azman Bin AbdullahDr. Faiz Redza Bin Ramli
Publicity
I r. Dr. Mohd Rizal Bin Alkahari
Certificate and Souvenir
Dr. Siti Nurhaida Binti Khalil Mrs. Norasra Binti A. Rahmanvii
FOREWORD BY THE CHAI RMAN ……….……….… ii
FOREWORD BY THE DI RECTOR ……….…. iii
FOREWORD BY THE EDI TOR-I N-CHI EF ………..……… vi
EDI TORI AL BOARD ………. v
ORGANI ZI NG COMMI TTEE ………..……… vi
TABLE OF CONTENTS ……… vii
Theme 1: Advanced Materials Processing 01. Preliminary study of KNN thin films doped by rare-eart hs for sensor applications. M.H. Maziati Akmal, A.U. Al-Amani, A.R. Mohd Warikh, A. Nurul Azuwa ……… 1
02. Effect of pineapple leaf fiber loading on the properties of pineapple leaf fiber-polypropylene composite. A.N. Kasim, M.Z. Selamat, N. Aznan, S.N. Sahadan, M.A.M. Daud, S. Salleh, R. Jumaidin ………...……… 3
03. I nvestigation of t he stress conditions of U-bend 316L stainless steel after performing cold mechanical process. W.M.F.W. Mohamad, M.Z. Selamat, B. Bunjali, H.M. Dom ……….…….……….……… 5
04. Comparison of thermal conductivity for HHT-24 CNF-based nanofluid using deionized water and ethylene glycol as based fluid. N.S. Zaini, S.N. Syed I drus, N. Abdullah, M.H.M. Husin, I .S. Mohamad ... 7 05. The effect of nanocarbon characteristics on enhancing thermal properties of nanofluids. S. Zainal Abidin, I .S. Mohamad, N. Abdullah, A.Y. Bani Hashim ………. 9
06. Thermal properties and heat transfer study of dispersed fluid with functionalized multi-walled carbon nanotube (MWCNT) particles. N. Zahari, M.R.H. Noor Salim, I .S. Mohamad, N. Abdullah, S. Thiru ……… 11
07. Effect of process variables on the tensile shear strengt h of spot welds in 6061-T6 aluminum alloy. S.Thiru, Siti Hajar Ahmad Razin, S. Hema, I .S. Mohamad …….……… 13
08. Charpy impact response of oil palm empty fruit brunch fiber reinforced metal laminate system. Fadzila Hussain, D. Sivakumar, S. Kathiravan, Mohd Ahadlin Mohd Daud ……….… 15
viii
Theme 2: Automotive Engineering
10. Fabrication and testing of energy regenerative suspension.
M.A. Abdullah, J.F. Jamil, N.S. Muhammad ……… 19
11. Experimental validation of single cylinder diesel engine using engine simulation tools.
M.H. Ahmad, N. Tamaldin, A.K. Mat Yamin, S.C. Lee ………..……… 21
12. Formula varsity race car - Roll dynamic analysis.
M.A. Abdullah, J. F. Jamil, N. I smail, M.Z. Mohammad Nasir, M.Z. Hassan ………. 23
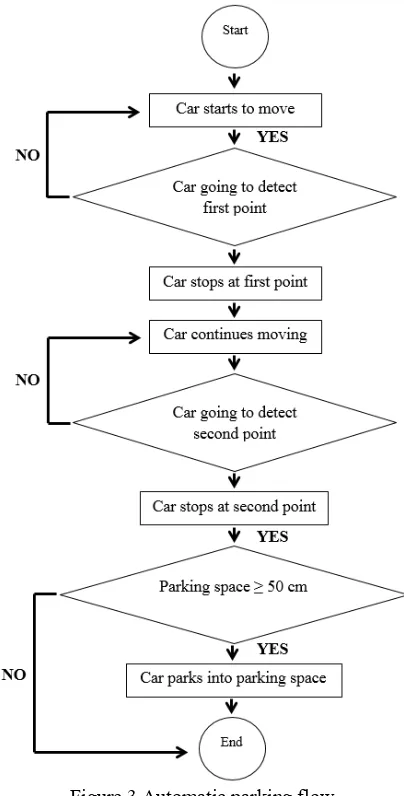
13. Driving assistance system – Automatic parking maneuver using Lego Mindstorms.
M.A. Abdullah, M.A. Romeli, F.R. Ramli, M.K. Mohamed Nor ………..………... 25
14. Autonomous vehicle convoy using Lego Mindstorms.
M.A. Abdullah, M.A. Azan, F.R. Ramli, M.K. Mohamed Nor ……… 27
15. The effect of different t hickness material stacking for four layer spot welding.
Mohd Harris Fadhilah, Nur Fatihah Madi ……….. 29
16. Pneumatic gear shifter analysis.
M.A. Abdullah, M.A. Mohd Ahyak, M.A.I . Abd Hamid, F.R. Ramli, S.A. Shamsudin ……….. 31
Theme 3: Computational Modeling and Analysis & CAD / CAE
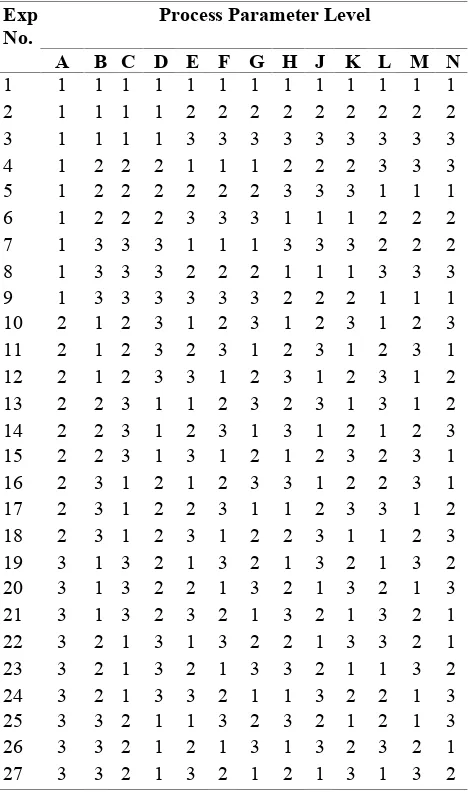
17. Taguchi modeling of process parameters in VDG-MOSFET device for higher ION/ IOFF ratio.
K.E. Kaharudin, A.H. Hamidon, F. Salehuddin ……….. 33
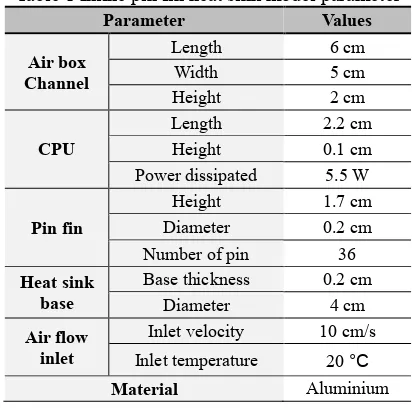
18. I nline pin fin heat sink model and thermal performance analysis for central processing unit. Khalil Azha Mohd Annuar, Fatimah Sham I smail, Mohamad Haniff Harun,
Mohamad Firdaus Mohd Ab Halim ……… 35
19. Stress level on sustainable vibration isolator using numerical method.
M.A. Salim, S. N. Jamaluddin, A. Putra, M.A. Abdullah ……… 37
20. The effect of diffuser angle on modified generic side view mirror.
Nur Rashid bin Mat Nuri, Abdul Rahman bin Mohd Nasir, Mohd Suffian bin Ab Razak ……….. 39
21. Design from nature: Development of a database to support product development.
S.F. Wong, S. Maidin ……….. 41
22. Study of electrical characteristic for 50nm and 10nm SOI body thickness in MOSFET device.
M.N.I .A. Aziz, F. Salehuddin, A.S.M. Zain, K.E. Kaharuddin ……….. 43
23. Redesign of automotive brake pedal based on castabilit y analysis.
ix
Younus Fahad Breesam, B.T. Tee, Z.M. Zulfattah ……….. 47
25. Energy analysis on ACMV system for an academic building – Case study in UTeM.
Ahmad Zubair Yahaya, B.T. Tee, Yusmady Mohamed Arifin ………. 49
26. Preliminary study on tribological properties of banana peel broth as additive in paraffin oil.
M.M.B. Mustafa, N.A.B. Masripan, M.F.B. Abdollah, J. Basiron ……… 51
27. I nvestigation on oxidation of jatropha oil.
A.M.H.S. Lubis, B. Ariwahjoedi, M.B. Sudin ……… 53
28. Stability of nano-oil by pH control in stationary conditions.
H. Amiruddin, M.F.B. Abdollah, A.M. I dris, M.I .H.C. Abdullah, N. Tamaldin ………. 55
Theme 5: Hydraulics and Pneumatics & Mechanical Control
29. Modeling for assessing the dynamic performance of pneumatic valve.
N.S. Osman, A.Y. Bani Hashim ………..……… 57
30. Precision control performances of a vertical motion electrostatic actuator stage with locking function.
M.M. Ghazaly, Y.P. Chin, K. Sato ………. 59
31. Force tracking control of MR damper and controller parameter optimization using sensitivity analysis method.
M.F. Md I sa, M.H. Harun, M.A. Abdullah, N.S. Muhammad ……… 61
Theme 6: Mechanical Design and Optimization
32. Comparative study for material removal rate, surface finish and electrode wear rate on die sinking EDM.
H.H. El Grour, S. Maidin ……….………..……… 63
33. Kinematic synthesis of planar, shape-changing rigid body mechanisms for slat design profile.
M.H. I smail, S.A. Shamsudin, M.N. Sudin ……….….………. 65
34. Optimizing PI D controller for an electro-hydraulic servo system via gradient descent technique. C.C. Soon, R. Ghazali, H.I . Jaafar, S.Y.S. Hussien ……… 67
35. Body to ground improvement at trim and form machine in end-of-line process.
M.H. Mohtar, S. Maidin ……….. 69
36. Performance on tensile properties of GFRP stacking sequence using Taguchi method. M.A. Md Ali, A.K. Khamis, N.I .S. Hussein, R.I . Raja Abdullah, M.S. Kasim, M.H. Abu Bakar,
x
37. Design of slanted glass injection mould for flow visualization of molten plastic.
M.A. Md Ali, M.F. Khalik, S. Subramonian, Z. Abdullah, R. Jaafar, P.J. Liew, M.S. Abdul Aziz …… 73
38. Design of semi-auto line for gula Melaka processing.
K.A. Azlan, T. Manoharan, H. Zainuddin, J. Basiron, M.K.M. Nor, F.R. Ramli ……….. 75
39. I ntegrated recycle system concept for low cost 3D-printer sustainability.
F.R. Ramli, M.I . Jailani, H.Unjar, M.R. Alkahari, M.A. Abdullah ……… 77
Theme 7: Mechatronics Engineering
40. Forward-chaining approach to expert system for machine maintenance.
S.N. Mohamad, A.Y. Bani Hashim ………...……… 79
41. Decoding wrist gesture with combinational logic for the development of a practical EMG electrode sleeve.
Z. Fu, A.Y. Bani Hashim , Z. Jam aludin, I . S Moham ad ………. 81
42. Application of defect detection in gluing line using shape-based matching approach. Mohamad Haniff Harun, Khalil Azha Mohd Annuar, Aminurrashid Noordin,
Mohd Hanif Che Hasan, Muhammad Salihin Saealal, Mohd Firdaus Mohd Ab Halim,
Muhammad Fareq I brahim ……….. 83
43. I nvestigation of sway angle characteristics in gantry crane system by PSD analysis.
S.Y.S. Hussien, R. Ghazali, H.I . Jaafar, C.C. Soon ……….. 85
44. Hopping peak height algorithm for a one legged robot hopping height control.
A.H. Azahar, S.H. Chong, A.M. Kassim ………. 87
Theme 8: Noise, Vibration and Harshness
45. Experimental investigation on the road transmitted vibration of a mountain bicycle
A.Y. I smail, M.F.A.M. Shukri, M.A.A. Johar ………....……… 89
46. I nvestigation on reed I mperata Cylindrica as sound absorber.
F.A. Khair, A. Putra, M.J.M. Nor, N. Atiqah ………. 91
47. Fundamental model of structure-borne vibration transmission in building using portal frame approach.
Y.M. Cheah, A. Putra, N. Muhammad, R. Ramlan ………..……… 93
48. Preliminary study on sound absorption of natural kenaf fiber.
Z.Y. Lim, A. Putra, M.J.M. Nor, M.Y. Yaakob ……….. 95
49. Mobility of rectangular plate with constraint and unconstraint edges.
K.H. Lim, A. Putra, R. Ramlan ……… 97
50. Oil palm empty fruit bunch fibers as sustainable acoustic material.
xi
52. Double layered micro-perforated panel as acoustic absorber in mosque.
D. Hafizah, A. Putra, M.J.M. Noor, M.S. Py ………. 103
53. Noise analysis in Malaysian passenger car cabin.
M.A. Abdullah, J.F. Jamil, N. Basrah, A. Putra, M.A. Salim ………. 105
54. Variability of vibration input power to a beam structure.
N.F. Saari, A. Putra, H. Bakri, R. Md Dan ……… 107
55. Analysis on degree of nonlinearity in hardening nonlinear system of a vibration based energy harvesting device.
P.S. Low, R. Ramlan, N.S. Muhammad, H.A. Ghani ……….. 109
Theme 9: Non-Destructive Testing & Structural Mechanics
56. Study on corrosion features analysis for visual inspection & monitoring system: A NDT technique.
Syahril Anuar I dris, Fairul Azni Jafar, Nurhidayu Abdullah ………. 111
57. Analytical work of honeycomb based on single ring hexagonal ring subjected to quasi-static lateral loading.
M.R. Said, A.J. Chuli ……… 113
Theme 10: Renewable Energy
58. Low-NOX combustion of biogas from palm oil mill effluent using flameless combustion.
Afiqah Hamzah, Abuelnuor Abdeen Ali Abuelnour, Mazlan Abdul Wahid ………..………. 115
59. Engineering design on food waste composting bin.
S.N. Khalil, K.A. Zulkifli ………..……… 117
60. Binary mixture of t he decanter cake and fiber from t he oil palm industry waste as a potential solid fuel.
Mohd Haizal Mohd Husin, Ting Sze Choi, Nur Haziqah Mohd Ruzmi, I mran Syakir Mohamad …… 119
61. Study the performance of single cylinder spark ignition engine for gasoline and compressed natural gas.
M.Z. Yunus, M.T. Musthafah, M.Z. Akop ……….. 121
62. Performance and emission characteristics of castor blends biodiesel in single cylinder diesel engine dynamometer.
Mohd Zaini Jamaludin, Safarudin Gazali Herawan, Yusmady Mohamed Arifin ………..…….. 123
63. Hardware design multi-sources light electric vehicles.
xii
64. On the dynamics of a beam-SDOF energy harvester system.
S. Susilo, A. Putra, K.S. Leong, M.J.M. Nor ……… 127 65. Relationships derived from physical properties of waste cooking oil / diesel blends and
biodiesel fuels.
M.I . Ali, J. Faezah ……….. 129 66. Broadening t he bandwidth of energy harvesting devices by using different magnet
configurations.
H.A. Ghani, R. Ramlan, M.J.A. Latif, P.S. Low ………. 131
Theme 11: Surface Engineering and Coatings
67. The evaluation of machinability and surface roughness in conventional vertical milling machine. M.A.M. Daud, W.T. Ng, D.L. Sivakumar, M.Z. Selamat ……… 133
68. Study on surface diffusion of an effective powder-pack boronizing.
N.H. Omar, R. Hasan, S.M.M. Shahidan, N.R. Morjani, M.H. Kamaludin ……… 135
69. Comparative study of surface roughness in milling AI SI D2 steel using PVD coated and uncoated tungsten carbide insert.
B.I . Redzuwan, M.S.A. Aziz, M.F. Ayub, M.S. Kasim, R. I zamshah, M. Amran ……… 137
Theme 12: Others Related Topic
70. Comparison of camera calibration method for a vision based mesoscale measurement system.
A.R.K. Anuar, H. Hanizam, S. Mohd Rizal, N. Nazrul Anuar ………..……… 139
71. Analysis of body dynamic posture to detect body discomfort by using a webcam and python image histogram.
N.S.A. Ramdan, A.Y. Bani Hashim, Seri Rahayu Kamat, Siti Azirah Asmai ……… 141
72. Development of innovation in Malaysian traditional palm sugar cooking machine. R. Hasan, S.A. Shamsudin, N. Muhammad, N. Tamaldin, H. Ali, M.I . Jaafar,
T.E. Tengku Mansor, F.Z. Zainuri, N.S.A. Abdul Razak ………..………. 143
73. A humanoid robot for autism rehabilitation: Does I Q influence response in child-robot interaction?
S. Shamsuddin, H. Yussof, F.A. Hanapiah, S. Mohamed ………. 145
74. A comparative study for concrete strength prediction using Fuzzy modeling and Neuro-Fuzzy modeling techniques.
__________
© Centre for Advanced Research on Energy
Preliminary study of KNN thin films doped by rare-earths for sensor
applications
M.H. Maziati Akmal1, A.U. Al-Amani2,*, A.R. Mohd Warikh1, A. Nurul Azuwa1
1) Faculty of Manufacturing Engineering, UniversitiTeknikal Malaysia Melaka,
Hang Tuah Jaya, 76100 Durian Tunggal, Melaka, Malaysia.
2) Faculty of Engineering Technology, UniversitiTeknikal Malaysia Melaka,
Hang Tuah Jaya, 76100 Durian Tunggal, Melaka, Malaysia.
*Corresponding e-mail: [email protected]
Keywords: KNN; doping; rare-earths; yttrium
ABSTRACT – Among ferroelectrics systems, potassium sodium niobate (KNN) has drawn much attention due to a clear-cut advantage of high piezoelectric and ferroelectric performances. The volatility of alkaline element (K,Na) is detrimental to the stoichiometry of KNN, contributing to the formation of intrinsic defects. Thus, the primary goal of this study is to design a solution to overcome the volatility issue of KNN. Introduction of rare-earth cations in the host KNN could reduce the vacancies in KNN. Currently, three arrays of dopants were integrated into KNN. In this preliminary work, a sol-gel technique was employed to produce a thin film that can be utilized later in the sensor applications. The structural and electrical properties were characterized using Raman spectroscopy and 2-point probe equipment, respectively. The typical Raman spectra of KNN thin films were shifted towards lower or higher wavenumbers depending on the cations deficiencies or redundancies. The conductivity of thin films was found to be increased as the dopant concentration was increased.
1. INTRODUCTION
Alkaline niobate, in particular, potassium sodium niobate, (KxNa1-x) NbO3 (KNN) is derived from a
combination of simple perovskite structure of KNbO3
(KN) and NaNbO3 (NN). It has a high Curie
temperature (420 ͦ C) and exhibits good ferroelectric and piezoelectric properties. However, the proportion of K, Na, and Nb is likely to deviate from stoichiometry due to the evaporation of K and Na at high temperature. Theoretically, the formation of intrinsic defects in the perovskite structure results in reduced ferroelectric and piezoelectric properties [1].
Substitutions of several cations inKNN structure would improve the properties of KNN-based ceramics.
Improvement of properties is believed due to the coexistence of orthorhombic-tetragonal phases at room temperature. This occurrence allows a better electrical poling process because of the existence of more crystallographic directions for the polarization [2-4]. Rare-earth elements (i.e. Ce, La, Nd) are dominant dopants to be substituted for KNN-based materials. It was stated that rare-earth elements are known to demonstrate useful functions of stabilizing and lowering dissipation factor in dielectric ceramics [5]. In previous
work on lead-free barium titanate (BT), it was found that the appropriate amount of rare-earth in KNN could enhance the electrical properties of BT [3]. A similar idea could be addressed to compensate the volatility of K and Na in KNN. For this reason, the present study is concentrated on the doping elements in KNN materials in response to having excellent properties. Different content of dopants were used in this study.
2. METHODOLOGY
There are several stages to fabricate rare-earths doped KNN. Two alkali precursors that are potassium acetate and sodium acetate were used as starting solutions. The precursors were mixed with rare-earth nitrate-based, i.e., and yttrium nitrate hexahydrate. Different content of rare-earth were used in this work (Y = 0, 0.25, 0.5). These chemicals were dissolved in a polar organic solvent, 2-methyoxyethanol with constant stirring at room temperature. Then, niobium ethoxide was added to the mixture solution. To retain the stability of the niobium ethoxide, acetylacetone was introduced to the prepared solution.
The solution was then deposited on the Si substrate to produce the thin films. The films were spun onto the wafer at 2000-3000 rpm for 60 seconds. After spinning, the wet films were heated at 200ͦ C for 5 minutes. Then, the thin films were annealed for 30 minutes at 650ͦ C in the furnace.
Subsequently, Raman microprobe measurements were used to study the changes in the Raman scattering modes of KNN thin films prepared with different yttrium contents. Later, the electrical properties were observed using I-V measurement by 2-point probe equipment.
3. EXPECTED RESULTS AND DISCUSSION
Raman spectra of KNN thin films with different yttrium content are depicted in Figure 1. The Raman-active mode v1, v2 and v3 correspond to the stretching
modes of NbO6 octahedra [6]. The peak position shifted
toward the higher wavenumber side (619 to 621 cm-1) as
Maziati Akmal et al., 2015
2 coordinate of the oxygen atom. Additionally, the peak shift occurs when the A-site in the ABO3 crystal
structure was integrated with a smaller ion.
Figure 1 Magnified Raman spectra with vibration changes of stretching mode v1.
The I-V characteristics of the KNN thin films recorded at room temperature are shown in Figure 2. Current increase as more yttrium dopant was introduced in KNN thin films. From the graph, it presented that the most conductive sample is 0.5% Y-KNN and the least conductive is undoped KNN. The increase in conductivity is due to more free electrons were generated by integrating Y ions which increase the carrier concentration in thin film [8].
Figure 2 I-V characteristics of KNN thin films at various dopant concentration
4. CONCLUSIONS
The KNN thin films were successfully fabricated by sol-gel method. Raman spectra indicate that the variation of peak shifting around 619 cm-1 attributed to
the enhancement of binding strength dominated by
dopant concentration. Meanwhile, the I-V
measurements show that the thin film conductivity was high at 0.5% Y-doped KNN. Hence, the encouraging results could contribute to the incorporation of these thin films in sensor devices.
5. ACKNOWLEDGMENT
The authors would like to thank the Ministry of Higher Education, Malaysia for funding our research. (FRGS/1/2014/TK04/UTEM/02/3)
6. REFERENCES
[1] P. K. Panda, “Review: environmental friendly lead-free piezoelectric materials,” Journal of Materials Science, vol. 44, no. 19, pp. 5049–5062, Jul. 2009.
[2] S. Qian, K. Zhu, X. Pang, J. Liu, J. Qiu, and J. Du, “Phase transition , microstructure , and dielectric properties of Li / Ta / Sb co-doped ( K , Na ) NbO 3 lead-free ceramics,” Ceramics International, vol. 40, no. 3, pp. 4389–4394, 2014.
[3] X. Huang, R. Xing, C. Gao, and Z. Chen, “Influence of CeO2 doping amount on the property of BCTZ lead-free piezoelectric ceramics sintered at low temperature,” Journal of Rare Earths, vol. 32, no. 8, pp. 733–737, Aug. 2014. [4] E. M. Alkoy, “Effect of Cu and Li Addition on the
Electrical Properties of KNN Ceramics,” pp. 1–4, 2010.
[5] C.-H. Kim, K.-J. Park, Y.-J. Yoon, M.-H. Hong, J.-O. Hong, and K.-H. Hur, “Role of yttrium and magnesium in the formation of core-shell structure of BaTiO3 grains in MLCC,” Journal of the European Ceramic Society, vol. 28, no. 6, pp. 1213–1219, Jan. 2008.
[6] K. Kakimoto, K. Akao, Y. Guo, and H. Ohsato, “Raman scattering study of piezoelectric (Na0.5K0.5)NbO3-LiNbO3 Ceramics,” J. Phys.
Soc. Jpn, vol. 44, pp. 7064-7067, 2005.
[7] F. D. Hardcastle and I. Wachs, “Determination of niobium-oxygen bond distances and bond orders by Raman spectroscopy,” Solid State Ion., vol. 45, no. 3–4, pp. 201–213, April 1991.
__________
© Centre for Advanced Research on Energy
Effect of pineapple leaf fiber loading on the properties of pineapple leaf
fiber – polypropylene composite
A.N. Kasim1,2,*, M.Z. Selamat1,2,*, N. Aznan1, S.N. Sahadan1,2, M.A.M. Daud1,2, S. Salleh1,2, R. Jumaidin1,2
1) Faculty of Mechanical Engineering, UniversitiTeknikal Malaysia Melaka, Hang Tuah Jaya, 76100 Durian Tunggal, Melaka, Malaysia.
2) Centre for Advanced Research on Energy, UniversitiTeknikal Malaysia Melaka, Hang Tuah Jaya, 76100 Durian Tunggal, Melaka, Malaysia.
*Corresponding e-mail: [email protected], [email protected]
Keywords: Pineapple Leaf Fiber (PLF); Polypropylene (PP); Fiber Reinforced Polymer (FRP)
ABSTRACT – Nowadays, the natural fibers are widely used in FRP composite especially as automotive interior parts because it is much cheaper and natural availability compare to glass fiber and carbon fiber. This paper discusses the effects of pineapple leaf fiber (PLF) loading on the mechanical properties of pineapple leaf fiber/polypropylene (PLF/PP) composite. An alkaline treatment was conducted to enhance the PLF properties before the formation process of PLF/PP composite. The mechanical properties of PLF/PP composite were determined using tensile test, hardness test, density measurement and microstructure analysis. The result of PLF/PP composite with a composition of 30/70 showed the best mechanical properties comparable to others composition ratios.
1. INTRODUCTION
Natural fiber is an alternative to glass fiber in FRP composite materials industry, especially in automotive application. Natural fibers composite give a combination of excellent mechanical property, dielectric property, and environmental advantages such as recyclable, biodegradable and renewability [1-2,7]. Pineapple leaf fiber is one of the most attractive materials as a strengthening natural fiber, and the mechanical properties of PLF are listed in Table 1. Mohamad et al [6], states that in Malaysia the pineapple industry is markable but only the fruit is used and other part such as leaf is thrown away, thus causing pollution and wasting the best potential sources of fiber. Furthermore, this study aims to investigate the effect of PLF loading on the properties of PLF/PP composite and to explore the potential of this composite. The mechanical properties such as tensile stress, hardness, bulk density and microstructure are observed.
Table 1 Properties of pineapple leaf fiber: [5]
Property Value
Density (g/cm3) 1.526
Softening Point (°C) 104
Tensile Strength (MPa) 170
Young’s Modulus (MPa) 6260
Specific Modulus (MPa) 4070 Elongation at Break (%) 3
Moisture regain (%) 12
2. METHODOLOGY
The materials used in the fabrication of FRP composites are PLF and PP. Figure 1 (a) and (b) shows the image of PLF and PP. Meanwhile, the composition of this composite is listed in Table 2.
(a) (b)
Figure 1 Photograph image: (a) PLF ; (b) PP
Before the PLF can be used as filler, an alkaline treatment was done. The raw pineapple leaf was first cut into small pieces with the length of 10 cm and then rolled used roll mill machine. After that, these small pieces were then immersed in 5% concentration of the NaOH. The 1% concentration of the HCL was used to neutralize the PLF. The functions of chemical treatments are to clean all the impurities, treat the fiber surface and also to stabilize the molecular orientation [2-4]. Vinod and Sudev [3] state that by undergoing the chemical treatments the mechanical properties of the material can be improved. After the formation process by using a hot compression mold, some mechanical testing was conducted that are tensile test (ASTM D 3039/D 3039M-00), shore hardness test, density measurement and microstructure analysis.
Table 2 Composition of PLF/PP composite
PLF (%) PP (%)
70 30
60 40
50 50
40 60
30 70
3. RESULTS AND DISCUSSION
Kasim et al., 2015
4 microstructure of each composite as shown in Table 3 shows that the voids percentage was reduced as PP content increased and it also shows a good adhesion between the PLF and PP. Hence, it has held the PLF firm and this affected their mechanical properties.
Figure 2 Tensile stress (MPa) versus PLF loading (%)
Figure 3 Hardness (Shore-D) and density (g/cm3) versus PLF loading (%)
Table 3 Microstructure of PLF/PP composites Ratio (%)
PLF/PP Microstructure view Remark
70/30
60/40
50/50
40/60
30/70
Figure 3 shows the graph of hardness (Shore-D) and density (g/cm3) versus composition of PLF in PLF/PP composites. The results show that the hardness and density has increased with the increasing of PLF until 50%PLF and after that both value has reduced as
PLF content has been increased. Based on the mechanical properties test has been conducted, for tensile and density tests the best result is shown by 30%PLF, while for the hardness test for PLF loading 50% up to 30 % the values are almost same. Moreover, for PLF loading 70% up to 60%, all the properties is shown the lowest value is due to less wetted of PP with PLF.
4. CONCLUSIONS
The effects of pineapple leaf fiber loading on the properties of PLF/PP composite have been studied and determined. Based on the results of tensile stress, hardness and density, it can be concluded that the PLF/PP composite with the composition ratio of 30/70 has shown the best mechanical properties comparable to others composition ratios. However, for PLF/PP composites with PLF loading of 60% and 70% is not suitable for composite materials because it shows the lowers mechanical properties.
5. ACKNOWLEDGEMENT
The authors would like to thank the Malaysia Ministry of Higher Education, Malaysia Ministry of Science, Technology and Innovation for sponsoring this work under Grant PJP/2013/FKM (14A) /S01240 and Advanced Material Research Group (A-MAT), Faculty Mechanical Engineering, University Teknikal Malaysia Melaka (UTeM) for financially sponsoring during this research.
6. REFERENCES
[1] J.P. Dhal, and S.C. Mishra, “Processing and Properties of Natural Fiber-Reinforced Polymer Composite”, Journal of Materials, pp.1–6. 2013. [2] M.Z. Selamat, A.N.Kasim, S.A. Shamsudin,
“Effect of bamboo fibre length on the mechanical properties of bamboo fiber/polypropylene composite,” in 8th MUCET 2014.
[3] D. Chandramohan, and K. Marimuthu. “Tensile and Hardness Tests on Natural Fiber Reinforced Polymer Composite Material”, Vol. 6, No. 1, 097 – 104.
[4] N.T. Phong, T. Fujii, B. Chuong, K. Okubo. “Study on How to Effectively Extract BFs from Raw Bamboo and Wastewater Treatment” Vol.1,
No.1 pp.144-155, 2012.
[5] B. Vinod, and L.J. Sudev, “Effect of Fiber Orientation on the Flexural Properties of PLAF Reinforced Bisphenol composites”, International Journal of Science and Engineering Applications. Vol. 2, ISSN-2319-7560, 2013.
[6] A.R. Mohamed, S.M. Sapuan, M. Shahjahan, and A. Khalina, “Characterization of pineapple leaf fibers from selected Malaysian cultivars”, Vol.7 (1): 2 3 5 - 2 4 0. 2009.
[7] R. Shyamraj, P. Sivasubramanian, and P.B Dhanusha, “Investigationson Mechanical Properties of Pineapple Fiber Reinforced Polymer Composite Material”,Vol. 4, 4-8, 2013.
PP PLF Good adhesion
__________
© Centre for Advanced Research on Energy
Investigation of the stress conditions of U-bend 316L stainless steel
after performing cold mechanical process
W.M.F.W Mohamad1,2,*, M.Z. Selamat1,2, B. Bunjali3, H.M. Dom1,2
1) Faculty of Mechanical Engineering, Universiti Teknikal Malaysia Melaka, Hang Tuah Jaya, 76100 Durian Tunggal, Melaka, Malaysia.
2) Centre for Advanced Research on Energy, Universiti Teknikal Malaysia Melaka, Hang Tuah Jaya, 76100 Durian Tunggal, Melaka, Malaysia.
3) Department of Chemisty, Institut Teknologi Bandung, Jl. Ganesha 10 Bandung, Jawa Barat-Indonesia.
*Corresponding e-mail: [email protected]
Keywords: 316L Stainless Steel; cold mechanical process; stress conditions.
ABSTRACT – This study reports on the investigation of the stress conditions of the U-bend 316L stainless steel through the cold mechanical process, starting with cold rolling of 0 up to 50% reduction in thickness and then, bending. The stress conditions; such as applied and residual stresses of the U-bend steel were obtained experimentally from the bending stress-strain curves and resulted curvature. It was found that the applied and residual stress has a higher value in the steel with a 30% cold reduction, which was about 257 MPa and 240 MPa, respectively.
1. INTRODUCTION
Cold rolling and bending have been used as a common cold mechanical process of metallic materials which covers most of the engineering applications. Past researches have proved that the cold deformation processes produce such amount of stresses. They have developed a great solution for the prediction of stress conditions, either as individual or combination of an analytical, simulation and experimental [1-2]. For the experimental solution, there were numerous preparation methods of the bent shape, as recommended by the ASTM standard. It was involved in the preparation of the various bent sheet metal, such as U-bend, V-bend, C-ring and bent-beam. The U-bend shape was selected since the stress conditions were considered unknown [3]. Furthermore, this solution was also applied to measure the residual stress in the sheet metals which were initially straight shape by measuring the resulted curvature of the bent shape.Zhang et. al. [4] and Tan et. al. [5] have produced an analytical solution that the residual stress was a sum of the stress before unbending and elastic spring back stress.
Therefore, this study was emphasized on the determination of the stress conditions of the U-bend steel through an experimental solution. The applied and residual stress was estimated from the bending stress-strain curves of the U-bend steel with a different level of the cold reduction. In addition, the related bending behaviors of the U-bend steel were also highlighted in this research.
2. METHODOLOGY
Experiments were carried out on 316L stainless steel (SS) with chemical compositions (in wt.%) of 316L [Fe, 16.61% Cr, 10.44% Ni, 1.048% Mo, 2.03% Mn, 0.02% C, 0.0022% S, 0.03% P, 0.571% Si, 0.28% Cu and 0.0221% N] as provided by the manufacturer. The test specimen with an initial thickness of 2.0 mm were unidirectional rolled to 0, 10, 30 and 50% reduction in thickness (%RT). Three sets of the specimen were prepared for each particular cold reduction. Then, the specimens were CNC milled to a dimension of 80.0 x 20.0 mm, with a hole of 10.0 mm in diameter on both sides. The bending process was done according to ASTM G 30-97, using a two stage stressing. In the first stage, the specimen was stressed to a U-bend shape using the bending jig, which was attached to the tensile machine: model Instron 8802 (US) system of 250 kN capacity. The process was subjected to a 3-point bend test with a constant speed of 1.0 mm/min. The second stage of the bending process was performed by manually stressing the specimen, and the U-bend shape was finally obtained.
A simple analysis of the U-bend steel was done before and after unbending using an image mapping techniques as shown in Fig. 2(a). It was used to measure the resulted curvature, in terms of the longitudinal deflection, D, lateral deflection, W and bend angle, . The metallography analysis of the specimens was done using microscopy techniques. The specimens were cut to a reduced scale, approximately 8.0 mm from its maximum bending region. A standard metallographies technique was applied during the sample preparation.
3. RESULTS AND DISCUSSION
Mohamad et al., 2015
6 After exceed this limit, the stress was rapidly dropped until the steel was permanently deformed to the U-bend shape. This was probably due to the formation of the inner cracks in the center of the U-bend steel as shown in Fig. 2(b).
Fig. 1 Bending stress-strain curves.
Fig. 2 (a) Image mapping techniques, and (b) the formation of inner cracks.
Another bending behavior of the U-bend steel was related to the spring back phenomena. Table 1 illustrates the resulted curvature of the U-bend steel before and after unbending condition using an image mapping techniques. The increment of D and reduction of W after unbending, with reflected to the condition before unbending, was closed due to the spring back. It means that the specimen with a higher cold reduction produces a greater spring back and a higher residual stress.
Table 1 The measurement of the resulted curvature.
Sample
ID %RT
After unbending unbending Before
Da
(mm) (mm)Wa (oa) (mm)Wb
SS-2.0 0 37.55 20.10 85.32 15.00
SS-1.8 10 37.40 24.10 80.01 14.75
SS-1.4 30 36.35 30.60 75.51 14.05
SS-1.0 50 33.70 40.10 65.22 13.90
Furthermore, the stress conditions of the U-bend steel were investigated according to the stress after and before unbending condition. It was obtained from their bending load-displacement and stress-strain curves. Fig. 3 shows the stress of each of the U-bend steel. The stress before unbending refers to an applied stress, ap at
the maximum deflectionof the U-bend steels. Whereas, the maximum deflection refers to the final displacement in longitudinal direction before unbending, Db with a
bend angle, b of 90o into the U-bend shape. The Db
values of all specimens were about 37.70 mm. As expected, the U-bend steel without cold reduction (0%RT) shows a lower ap of about 161 MPa. The value
was increased to 209 and 257 MPa for the U-bend steel with 10 and 30 %RT, respectively. However, the ap was
decreased to 218 MPa for the U-bend steel after extensively cold reduction to 50 %RT.
Fig. 3 The stress conditions of the U-bend steel.
The stress after unbending was closely referred to the residual stress, re, as stated in the previous
researchers [4,5]. From Fig. 3, the re also shows a
similar pattern with the ap where the highest value was
about 240 MPa for the U-bend steel with 30 %RT. In addition, the elastic spring back stress, of all the U-bend steel have a negative value (where = re - ap).
This was due to the nature of the spring back that it will be returned back to the previous bending path.
4. SUMMARY
The stress conditions of the U-bend 316 SS after performing cold mechanical process has been defined experimentally from the bending stress-strain curves and resulted curvature. It can be concluded that:
a. The processes were confirmly produced such amount of the residual stress. It has been preliminary predicted from the resulted curvature of the steel as a result of the spring back for each particular cold reduction.
b. The applied stress at the maximum deflection was higher than its residual stress. The highest value of the both stresses was obtained in the U-bend steel with 30 % cold reduction.
5. REFERENCES
[1] R. Schilling, “Sheet bending and determination of residual stress by means of FEM,” Engineering Structures, vol. 26, pp. 1249–1259, 2004.
[2] M. Weiss, B. Rolfe, P.D. Hodgson, and C. Yang, “Effect of residual stress on the bending of aluminium,” Journal of Materials Processing Technology, vol. 212, pp. 877–883, 2012.
[3] A.J. Sedricks, and B.C. Syrett, Stress Corrosion Cracking Test Methods, NACE: Houston; 1990. [4] Z.T. Zhang, and S.J. Hu, “Stress and Residual
Stress Distributions in Plane Strain Bending,” International Journal of Mechanical Sciences, vol. 40, no. 6, pp. 533-543, 1998.
[5] Z. Tan, W.B. Li, and B. Persson, “On analysis and measurement of residual stresses in the bending of sheet metals,” International Journal of Mechanical Sciences, vol. 36, no. 5, pp. 483–491, 1994.
0 50 100 150 200 250 300
0 10 30 50
Be
nd
in
g
st
re
ss
(M
Pa
)
Percent reduction in thickness (%RT)
Stress before unbendi ng SS-2.0; 0
%RT SS-1.8; 10
%RT SS-1.4; 30
%RT SS-1.0; 50
%RT
A
B
C
A
B
C
0
10 30 50
W
D
__________
© Centre for Advanced Research on Energy
Comparison of thermal conductivity for HHT-24 CNF-based nanofluid
using deionized water and ethylene glycol as based fluid
N.S. Zaini1,*, S.N. Syed Idrus1, N. Abdullah2, M.H.M. Husin1, I.S. Mohamad1
1) Faculty of Mechanical Engineering, Universiti Teknikal Malaysia Melaka, Hang Tuah Jaya, 76100 Durian Tunggal, Melaka, Malaysia.
2) Department of Chemistry, Centre for Foundation Studies, Universiti Pertahanan Nasional Malaysia, Kem Sungai Besi, 57000, Kuala Lumpur, Malaysia
*Corresponding e-mail: [email protected]
Keywords: Carbon nanofiber; nanofluid; thermal conductivity
ABSTRACT – Nanofluid are widely used in industrial applications due to their high thermal conductivity. In this experiments, thermal conductivity of various ratio carbon nanofiber based-nanofluid both in ethylene glycol and deionized water were investigated. The thermal conductivity of 1.0% CNF volume concentration at 400C for deionized water-based is 0.745 W/m.K while ethylene glycol-based is 0.349 W/m.K. It shows that deionized water-based recorded higher thermal conductivity compared to ethylene glycol-based. This is due to the effect of some parameter such as particle volume fraction, size and the temperature of thermal conductivity.
1. INTRODUCTION
Nanofluids are the mixture of nanoparticles, dispersing agent and based fluid in a solution. These fluids are stable colloidal suspensions of nanoparticles such as nanotube or nanofiber in base fluid. Choi and Eastman primarily studied nanofluids at Argonne National Library [1].
The potential of nanofluids as a new medium in enhancing heat transfer are closely related to their thermal conductivity. Choi et al. [2] proposed that thermal conductivity of nanofluid is higher compared to those currently used heat transfer fluids thus lead to the enhancement of heat transfer. However, the value of thermal conductivity for nanofluids might be differ according to the base solution use as the conductivity of the base solution itself play an important roles in determining the thermal conductivity result. Research fromDing et al. [3] conclude that the enhanced thermal behaviour of nanofluids could provide a basis for an enormous innovation for heat transfer intensifiction. This is a major importance to a number of industrial sectors including transportation, power generation, as well as heating, cooling, ventilation and air-conditioning. In this study, the thermal conductivity of water based and ethylene glycol based is compared.
2. METHODOLOGY
The nanoparticles used in this experiment are Pyrograf III Carbon Nanofiber High-Heat Treated (HHT-24). HHT-24 carbon nanofibers were produced by Pyrograf Products Inc. Nanofluids were prepared by mixing the carbon nanofiber and polyvinylpyrrolidone
(PVP) in two different based-solutions. Those are deionized water and ethylene glycol solution. The samples were homogenized by using Digital Homogenizer LHG-15 for 3 minutes at 10000 rpm. The purposes of homogenization are to ensure the solid particles inside are uniformly dispersed. Next, the nanofluids sample undergoes ultrasonication cleaning process by being ultrasonicated using ultrasonic cleaner for about an hour at 25oC at the highest frequency. The ultrasonicator removes any contaminants in the nanofluid. The samples were then homogenized once again for five minutes at 2000 rpm. The thermal conductivity of the nanofluids was measured at three different temperatures (6oC, 25oC, 40oC) using KD-2 Pro Thermal Properties Analyser from Decagon Devices Inc. All samples were tested for thermal conductivity after being well homogenized to avoid any sedimentation which can affect the result.
3. RESULTS AND DISCUSSION
The thermal conductivity of nanofluid is tested and the data were shown at Figure 1. Table 1 show the percentage enhancement of ethylene glycol based nanofluids for three different temperatures (60C, 250C, and 400C) and the usage of 40% of PVP.
Figure 1 Thermal Conductivity for different temperature of ethylene glycol based nanofluid
The thermal conductivity of the nanofluid samples then compared with the thermal conductivity of the standard sample by calculating the enhancements of nanofluid through Equation 1:
0 0.05 0.1 0.15 0.2 0.25 0.3 0.350.4
0 0.1 0.2 0.3 0.4 0.5 0.6 0.7 0.8 0.9 1
Th
er
m
al
C
on
du
cti
vi
ty
,k
(W/
m
.K
)
Percentage of HHT-24 CNF (%)
6
25
Zaini et al., 2015
8
% of enhancement = T. C of samples − T. C of coolant/waterT. C of coolant/water x
Table 1: Percentage of thermal conductivity enhancements for ethylene glycol based nanofluid
CNF %
Percentage of Enhancement (%) at temperature (°C)
6 25 40
0.1 8.88 9.02 -6.54
0.2 10.81 -4.51 7.69
0.3 10.04 1.22 11.15
0.4 25.87 -6.14 23.07
0.5 41.31 -3.28 15.38
0.6 3.86 0.41 15.21
0.7 15.44 22.22 28.52
0.8 17.76 6.17 32.32
0.9 8.88 18.93 33.08
1.0 36.68 0 32.70
The result of thermal conductivity and percentage enhancement of carbon nanofibers deionized water based nanofluids with the different percentage of PVP compared to ethylene glycol based nanofluids is show at Figure 2 and Table 2 respectively. The PVP used for the water-based nanofluid formulation is PVP with 10% weight of CNF.
Figure 2 Thermal conductivity for different temperature of deionized water-based nanofluid
Then, the enhancement percentage is calculated according to the percentage of enhancement formula as stated in (1) for deionized water-based. Table 2 shows the tabulated data of percentage of thermal conductivity enhancement for deionized water-based nanofluid at different temperature.
At the tested concentrations, thermal conductivity increases with nanoparticle volume fraction, ϕ for both cases. From the result, it can be seen that deionized water recorded the higher thermal conductivity compared to ethylene glycol. However, in term of percentage enhancement, ethylene glycol recorded more
percentage enhancement of thermal conductivity compared to deionized water. This is because; pure ethylene glycol has a specific heat capacity about one-half that of deionized water thus reducing the thermal conductivity of pure ethylene glycol. However, the mixture of ethylene glycol and water at rate 50/50 could increase the thermal conductivity [4].
Table 2: Percentage of thermal conductivity enhancements for deionized water-based nanofluid
CNF %
Percentage of Enhancement (%) at temperature (°C)
6 25 40
0.1 2.59 2.14 16.55
0.2 7.96 19.64 18.97
0.3 -1.11 19.82 8.79
0.4 4.07 3.93 0.34
0.5 -2.78 0.53 47.93
0.6 -8.33 -11.61 26.20
0.7 -6.67 -4.64 20.86
0.8 7.78 16.96 17.41
0.9 24.62 20.54 19.66
1.0 33.33 22.32 28.45
4. CONCLUSIONS
In general, adding solid nanoparticles increases thermal conductivity of nanofluid either for water based or ethylene glycol based nanofluids. Nanofluids with higher volume fraction rate of CNT possess high thermal conductivity compared to the pure base solution itself.
5. REFERENCES
[1] S. Choi. and J.A. Eastman, “Enhancing Thermal Conductivity of Fluids with Nanoparticles”, in International Mechanical Engineering Congress and Exhibition, pp. 99-105,1995.
[2] W. Yu and H. Qie, “A Review on Nanofluids: Preparation, Stability, Mechanisms and Applications” Journal of Nanomaterials,vol. 2012, no. 1, pp. 1-17, 2012.
[3] Y.L. Ding, H.S. Chen, Y.R. He, A. Lapkin, and Y. Butenko, "Forced Convective Heat Transfer of Nanofluids" Advance Power Technology, 2007. [4] L.S. Sundara, M.H. Farookyb, S.N. Saradab, M.K.
Singha, “Experimental thermal conductivity of ethylene glycol and water mixture based low volume concentration of Al2O3 and CuO nanofluids,” International Communications in Heat and Mass Transfer, vol. 41, pp 41-46, 2013.
0 0.1 0.2 0.3 0.4 0.5 0.6 0.7 0.8 0.91
0 0.1 0.2 0.3 0.4 0.5 0.6 0.7 0.8 0.9 1
Th
er
m
al
C
on
du
cti
vi
ty
, k
(W/
m
K
)
Percentage of HHT-24 CNF (%)
__________
© Centre for Advanced Research on Energy
The effect of nanocarbon characteristics on enhancing thermal
properties of nanofluids
S. Zainal Abidin1,*, I.S. Mohamad1, N. Abdullah2, A.Y. Bani Hashim3
1) Faculty of Mechanical Engineering, Universiti Teknikal Malaysia Melaka, Hang Tuah Jaya, 76100 Durian Tunggal, Melaka, Malaysia.
2) Department of Chemistry, Centre for Foundation Studies, Universiti Pertahanan Nasional Malaysia, Kem Sungai Besi, 57000, Kuala Lumpur.
3) Faculty of Manufacturing Engineering, Universiti Teknikal Malaysia Melaka, Hang Tuah Jaya, 76100 Durian Tunggal, Melaka, Malaysia.
*Coresponding e-mail: [email protected]
Keywords: Carbon nanotube; thermal properties; nanofluids
ABSTRACT – The different in nanocarbon structure may result in thermal conductivities performance. In this research, the understanding about the behavior and characteristic of different types of nanocarbon are investigated. The morphology and functionalized-group attachment on the nanocarbon surface were characterized using Scanning Electron Microscopy (SEM) and Fourier Transform Infra-Red (FTIR). The thermal conductivity testing were performed to select the best CNT which can possess a good thermal properties. The result shows that the CNT3 (HHT24) has the higher thermal conductivity enhancement.
1. INTRODUCTION
Nanofluids were formed by fine dispersion of nano-sized solid particles in a liquid. Even in dilute concentrations, typical colloids form aggregates that are dependent on the solution chemistry, surface charges, and thermal Brownian motion of the nanoparticles [1]. The external fields such as gravity and temperature can support or destroy the formation of aggregates. Thus, the tested nanofluids in most experimental shows that there is a competition between the growth of fractal-like structures, coalescence into large clumps, sedimentation, and fragmentation [2]. In general, the viscosity and thermal conductivity are sensitive to geometrical configuration and the connectivity [3] of the formed aggregated structure.
Carbon nanotubes with rolled-up graphene sheets have high thermal conductivity and has the ability to remain in stable suspension for a long period of time. The carbon nanotubes were discovered by Iijima in 1991 [4] and since that, carbon nanotubes have received much attention. The diameters and arrangement of the hexagon rings along the tube length determined the metal properties of the carbon nanotubes, metallic or semi-conductive. The consistent arrangement of the hexagon rings without any loose bonds make the carbon nanotube walls to become unreactive [5].
The intrinsic mechanical and transport properties of CNT make them an ultimate carbon fiber. By and large, CNT demonstrate an exceptional blend of stiffness, strength, and tenacity contrasted with other fiber materials which generally fail to offer one or a
greater amount of these properties.
2. METHODOLOGY
The characterizations which being conducted for the selected nanocarbon such as Carbon Nanotube (Nanoamor-CNT), Multiwalled CNT and Carbon Nanofiber (Pyrograf-CNF). The objectives is to find the best nanocarbon, which can enhance and possess a good thermal properties based on the structural analysis. Thermal conductivity testing was conducted using KD2Pro Thermal properties Analyzer. The results were used to syncronized the performance of thermal conductivity with the surface characteristic of nanocarbons. Table 1 shows the properties of commercial carbon nanotubes used in this studies.
Table 1 Properties of the commercial CNT
Sample
coding Types
Outer Diameter (nm)
Specific Surface Area (m2/g)
CNT1
Multiwalled-CNT 30-50 60
CNT2 Nanoamor
-CNT 10-30 100
CNT3 Pyrograf
-CNF 100 43
2.1 Scanning Electron Microscopy (SEM)
Zainal Abidin et al., 2015
10
2.2 Fourier Transform Infrared (FTIR)
An infrared spectrum represents a fingerprint of a specimen with absorption peaks which correlate to the frequencies of vibrations between the obligations of the atom that making up the material. In order to make an identification and requires a frequency spectrum, as the measured interferogram signal cannot be interpreted, a means of decoding the individual frequencies is required. This can be solved only through the well-known mathematical method called the Fourier transform. This transformation will be performed and solved by the computer which then presents the user with desired spectral information for analysis.
2.3 Thermal Conductivity Testing
The thermal conductivity test of the nanofluid will be taken at three different temperatures which are at 6°C, 25°C and 40°C. To obtain such temperature of the nanofluid, those three samples will be immersed in the water bath so that the temperature of the samples will maintain at desired temperature.
3. RESULTS AND DISCUSSION
The morphology of three different types of carbon nanotubes is shown in Figure 1. The nanotubes morphology are randomly entangled and highly interconnected, probably due to the van der Waal’s.
Figure 1 SEM images of a) CNT1, b) CNT2, c) CNT3
The surface areas contribute to the enhancement of physical and chemical properties of nanofluids. The properties that found to influence surface area were number of walls or diameter, impurities, and surface functionalization with hydroxyl and carboxyl groups. All images shown in Figure 1 illustrated agglomerate carbon nanotube and nanofibers, primarily with non-uniform tubular structure. The increase in diameter size will reduce the surface area. Higher surface areas are expected to provide a better media for thermal transport in nanofluid.
Figure 2 shows the FTIR spectra of the CNTs. On the horizontal axis is the infrared wavelengths expressed in term of a unit called wavenumber (cm-1) which represent the number of waves fit into one centimeter. The peaks in the COOH spectrum represent the functional groups that are present in the molecule. The results reveal that the CNT1 (fMWNT) shows the higher COOH spectrum followed by CNT2 (Nanoamor), and CNT3 (HHT24). The higher in the peak spectrum will enable a good dispersion of CNT in nanofluids and improve the stability of nanofluids.
Figure 2 FTIR spectra of CNTs
Table 2 Thermal conductivity (W/mK) for CNT at various temperatures
CNT 6 Temperature (25 oC) 40
CNT1 0.55 0.50 0.50
CNT2 0.57 0.50 0.60
CNT3 0.58 0.60 0.60
Table 2 shows the thermal conductivity analysis for the all CNTs. CNT3 shows the higher thermal conductivity compared to others due to the decrement of diameter size in carbon nanofiber. The smallest diameter generates the best enhancement in thermal conductivity which contribute to the higher surface area.
4. CONCLUSIONS
In conclusion, the study of surface area of the selected CNT nanocarbon shows that the decrement in diameter size will attributed to the highest surface area and possesses a good thermal conductivity. The experimental studies shows that CNT3 (HHT24) generates the best enhancement in thermal conductivity. High surface area of the CNT3 (HHT24) offers a better media for thermal transport in nanofluids.
5. REFERENCES
[1] Weitz, D. A., Huang, J. S., Lin, M. Y., and Sung, J., “Dynamics of Diffusion-Limited Kinetic Aggregation,” Phys. Rev. Lett., vol. 53, pp. 1657– 1660, 1985.
[2] Meakin, P., “Aggregation Kinetics,” Phys. Scr., vol. 46, pp. 295–331, 1992.
[3] J. Eapen, R. Rusconi, R. Piazza and S. Yip, “The Classical Nature of Thermal Conduction in Nanofluids”, Journal of Heat Transfer, vol. 132, no. 10, pp. 1-14, 2010.
[4] Iijima.S. (2007). “Nano-carbon materials: Their Fundamentals and Various Applications including Nano-Biotechnology”. University of Wien. [5] Lin, T., Bajpai, V., Ji, T. and Dai, L., “Chemistry
of Carbon Nanotubes”. Australian Journal of Chemistry, vol. 56, no. 7, pp. 635-651, 2003.
4000 3500 3000 2500 2000 1500 1000 500
10
26
13
83
16
24
34
37
Nanoamor MWCNT HHT24
Tr
an
sm
itt
an
ce
[a
.u
]
Wavenumber [cm-1]
(a) (b) (c)
__________
© Centre for Advanced Research on Energy
Thermal properties and heat transfer study of dispersed fluid with
functionalized Multi-Walled Carbon Nanotube (MWCNT) particles
F.N. Zahari1,*, M.R.H. Noor Salim1, I.S. Mohamad1, N. Abdullah2, S. Thiru3
1) Faculty of Mechanical Engineering, Universiti Teknikal Malaysia Melaka, Hang Tuah Jaya, 76100 Durian Tunggal, Melaka, Malaysia.
2) Department of Chemistry, Centre for Foundation Studies, Universiti Pertahanan Nasional Malaysia,
Kem Sungai Besi, 57000, Kuala Lumpur, Malaysia.
3) Department of Mechanical Engineering, King Abdul Aziz University - North Campus P.O. Box 80204, Jeddah 21589, Kingdom of Saudi Arabia.
*Corresponding e-mail: [email protected]
Keywords: Thermal conductivity; MWCNT; specific heat capacity
ABSTRACT – Water, ethylene glycol and engine oil are commonly used in heat exchanger applications as coolant. However, these fluids possess low thermal conductivity. The advancement in nanotechnology has enabled nano-size particles to be included in a base fluid and this is known as nanofluids. The aim of this study is to investigate the most stable and homogeneous nanofluids with different weight percentage that produced excellent result in thermal properties and heat transfer characteristics. For this study, the usage of MWCNT as nanoparticles and deionized water as based fluids with surfactant were investigated for their stability and thermal properties. Different temperature and particle volume concentration were used in this study and this will affect the thermal conductivity, viscosity and specific heat as well as the heat transfer characteristics of nanofluids. As a result, the thermal conductivity and specific heat capacity of nanofluids were increased when the temperature and particle volume concentration increased. Besides that, the viscosity of nanofluids seem to decreased when temperature was increased but not for its particle concentration.
1. INTRODUCTION
Nanofluids are a new generation of thermal fluids which have particular features that affect their behavior. One of these features is response of nanofluids to temperature difference. Nanofluids have been found to possess enhanced thermophysical properties such as thermal conductivity, thermal diffusivity, viscosity and convective heat transfer coefficients as compared to those of base fluids like oil or water. Owing to their enhanced properties as thermal transfer fluids for instance, nanofluids can be used in engineering applications ranging from use in the automotive industry to the medical arena. Besides, it also being use in power plant cooling systems as well as computers. Focused on the nanofluids thermal properties, the temperature are greatly affected their thermal properties. It increasing the thermal conductivity for nanofluid when the temperature range increased [1,5]. The results suggested the application of nanofluids as coolant for devices with high energy density where the cooling
fluid works at temperature higher than room temperature. Besides that, the viscosity of nanofluids also increased with increasing MWCNT concentration and decreasing temperature [2] meanwhile the specific heat of nanofluids decreases with an increase in concentration and an increase in temperature [3].
2. METHODOLOGY
2.1 Preparation of Nanofluids
To produce nanofluids, the MWCNT particles were used in this study and deionized water (DI) as well as polyvinylpyrrolidone (PVP) were used as base fluid and surfactant respectively. The nanofluids were prepared by dispersing MWCNT nanoparticles and PVP in a base fluid. They were mixed together by using a homogenizer at a rotational speed of 10000 rpm for about 5 minutes. Each of the samples will undergo 30 minutes of intensive ultrasonication to disperse the nanoparticles. This process was conducted by using the Elmasonic S30H Ultrasonicator (50-60 kHz frequency with 280W of output power). It generates high shear forces that break particle agglomerates into single dispersed particles.
2.2 Stability Test
Zahari et al., 2015
12
2.3 Thermal Properties Test
To recognize the thermal properties of the nanofluid, several tests need to be conducted such as thermal conductivity, viscosity and specific heat. The tests were conducted at three different temperatures at 6
°C, 25 °C and 40 °C. In order to stabilize the samples
temperature, the samples were placed inside the refrigerated water bath and this can minimize the effect of temperature variation.
For thermal conductivity test, the KD2Pro thermal analyzer (Decagon, USA) was used to measure the nanofluid thermal conductivity. It was set on automatic mode and left on the flat table to avoid any movement or table vibration during the measurement process. Any movement of the sample would create the convection.
For the viscosity test, the Brookfield rotational viscometer was used. Using multiple speed transmission and interchangeable spindles, a variety of viscosity ranges were measured. The viscosity of CNT-water nanofluids as a function of shear rate was measured. Besides that, nanofluids provide better fluid performance due to the higher shear rate at the wall which results in low viscosity there. Meanwhile, for specific heat test, it was conducted by employing the IKA C200 Bomb Calorimeter. The specific heat capacity determines the convective flow nature of the nanofluid and it necessarily depends on the volume fraction of the nanoparticles.