Fatty acids intake among diverse ethnic groups in Indonesia
Ratna Djuwita Hatma*, Widjaja Lukito, Yohanna S.P. Rumawas
Abstrak
Pola makan, khususnya asupan asam lemak dapat merupakan informasi yang sangat berarti dalam memberikan pengertian atau penjelasan mengenai peranan hubungan diet dengan penyakit-penyakit kronis, khususnya pennyakit jantung koroner (PJK). Desain
penelitian ini adalah “cross sectional”. Informasi dikumpulkan untuk dapat menggambarkan asupan nutrien khususnya asupan asam lemak pada 4 (empat) kelompok etnik yaitu: etnik Minangkabau, Sunda, Jawa dan Bugis. Persentase asam lemak jenuh terhadap total energi sekitar 20% pada keempak kelompok etnik ini.Persentase asam lemak tidak jenuh majemuk terhadap total energi berkisar diantara 4.4% sampai 4.6% pada kelompok etnik Sunda dan Jawa.Sedangkan pada kedua etnik lainnya, persentase asam lemak tidak jenuh majemuk terhadap total energi lebih rendah, 2.6% pada suku Minangkabau dan 2.8% pada suku Bugis. Persentase asam lemak tidak jenuh tunggal terhadap total energi lebih tinggi pada etnik Sunda dan Jawa (6.1% vs 5.5%) Sedangkan persentase asam lemak tidak jenuh tunggal terhadap total energi pada kedua etnik lainnya Minangkabau dan Bugis lebih rendah (2.6% vs 2.8). Berdasarkan ratio dari asam lemak tidak jenuh majemuk dengan asam lemak tidak jenuh tungal dan dengan asam lemak jenuh, dapat disimpulkan bahwa suku Minangkabau dan Bugis memiliki kualitas pola diet asupan lemak yang kurang baik. Selain kurang baiknya pola diet asuapan lemak, suku Minangkabau juga mengkomsumsi total asupan lemak yang cukup tinggi, dengan demikian dapat disimpulkan bahwa suku Minangkabau mempunyai risiko tinggi terhadap dislipidemia dibandingkan dengan ketiga kelompok etnik lainnya. (Med J Indones 2005; 14:242-8)
Abstract
The use of dietary pattern specifically fatty acids intake should prove to be an informative and powerful means to augment our understanding of the role of diet in chronic disease particularly CHD. Cross sectional study was implemented to describe the nutrients intake specifically fatty acids intake of 4 (four) ethnic groups in Indonesia, such as Minangkabau, Sundanese, Javanese and Buginese. The percentage of saturated fatty acid (SAFA) to total energy intakes were around 20%. The percentage of polyunsaturated fatty acid (PUFA) to the total energy were about 4.4% to 4.6% among the Sundanese and the Javanese.While among the other two ethnic groups, the percentage of PUFA to total energy were less, 2.6 % among the Minangkabau and 2.8% among the Buginese ethnic. The percentage of mono unsaturated fatty acid (MUFA) to total energy intake were higher among the two ethnic groups, Sundanese and Javanese (6.1% vs. 5.5%). While the percentages of MUFA between the other two ethnic groups Minangkabau and Buginese ethnic were lower (2.6% vs. 2.8%). Based on the ratio of PUFA: MUFA: SAFA, we could consider that Minangkabau and Buginese ethnic groups both had poor quality of dietary fat pattern. Having the poor quality of dietary fat pattern and higher fat intake, we might take into consideration that the Minangkabau ethnic groups, had higher risk toward dyslipidemia compared to the other three ethnic groups. (Med J Indones 2005; 14:242-8)
Keywords : fatty acids intake,SAFA, MUFA, PUFA , ethnic
Nutrient intake or fatty acids intake patterns might be a consequence of cultural and ethnic heritage and of many environmental factors. Increasing in the incidence of various chronic disease particularly coronary heart
diseases had followed changes in fatty acids intake
pattern towards the “affluent” diet. The use of dietary
pattern specifically fatty acids intake should ultimately prove to be an informative and powerful means to augment our understanding of the role of diet in chronic disease.
Different fatty acids had bee shown to affect the risk of Coronary Heart Disease (CHD) such as hyper-cholesterolemia. The American Heart Association dietary guidelines had published recommendation to *
Department of Epidemiology, School of Public Health University of Indonesia, Depok, Indonesia
SEAMEO-TROPMED, Regional Center for Community Nutrition,
achieve and maintain desirable plasma total cholesterol and LDL cholesterol by reducing dietary saturated fatty acid to less than 10% of energy intake.1 Reduction of dietary fat intake from 37% to 30% of calories did not lower plasma total and LDL cholesterol concentrations unless the reduction in total fat was achieved by decreasing in saturated fatty acids.2 Seven Countries study showed that there was a strong correlation between the intake of saturated fatty acid and the mean concentration of serum total cholesterol. It had been suggested that the variation in serum total cholesterol level between populations could be largely explained by the differences in saturated fatty acid intake. Populations with an average percentage of saturated fatty acid to total energy were between 3% and 10% were characterized by a serum total cholesterol less than 200 mg/dl and groups, those Japanese who lived in Japan, Honolulu and San Francisco were 7, 23 and 26%. And this percentage calorie from saturated fatty acid showed a positive linear regression with serum cholesterol.5
PUFA (polyunsaturated fatty acid) specifically linoleic acid tend to lower plasma total cholesterol and LDL, but their effect was only half strong as the raising effect of saturated fatty acid. MUFA (monounsaturated fatty acid) specifically oleic acid had a smaller cholesterol lowering effect.3,6 PUFA include the essential fatty acids required for human health. The WHO Study Group on Diet, Nutrition and Prevention of Non-communicable Diseases, suggested that diets that provided at least 3% of energy as PUFA, would be adequate to achieve this requirement.7 According to the WHO Study Group the upper limit of the percentage of PUFA to total energy was 7%. When saturated fatty acid in the diet was replaced by PUFA specifically linoleic acid there was a decreased in LDL cholesterol. However a high intake (above 10% of energy, might decrease HDL cholesterol as well.8,9 Since HDL cholesterol had a protective effect toward CHD, high intake of PUFA were not recommended. The current recommended of percentage of MUFA to total energy was 10%.
Indonesia is a multiethnic society with a population consisting of approximately 50 ethnic groups. And each ethnic had their own traditional food or nutrient
intake patterns as well as their fatty acids intake. The objective of this study is to describe the differences of nutrient intake patterns specifically fatty acids intake of 4 (four) ethnic groups out of those 50 ethnic groups in Indonesia, which were Minangkabau, Sundanese, Javanese and Buginese ethnic groups.
METHODS
This study was a cross sectional study design. The study population consists of adult aged 18 years old and over at the time of contact and lived in 4 cities namely Padang, Bandung, Yogyakarta and Makasar and those who were Minangkabau, Sundanese, Javanese and Buginese ethnicity. Ethnicity was defined according to the ethnicity of the parents. At least both mother and father of the respondent were from the same ethnicity with no mixed marriage. The information concerning to the ethnicity of the respondent and the parent was achieved through self-perceived definition.
This study was the sub sample of “Body Mass Index Survey” cities in Indonesia. This study was conducted
within the collaboration between The Nutrition Directorate Ministry of Health Republic of Indonesia and Faculty of Public Health University of Indonesia Sub sample of those 4 ethnicity were randomly selected from total sample respondents from Padang, Bandung, Yogyakarta and Makasar city, according to sample size requiremente. The required sample size was from 300 until 400 respondents.
RESULTS
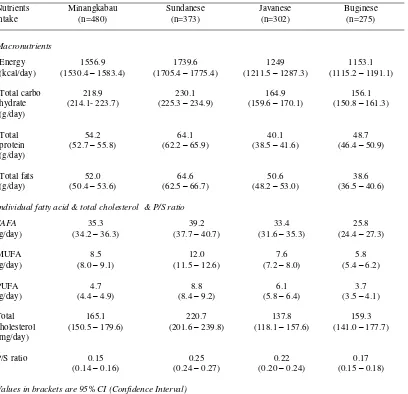
Fat intakes consist of total fat intake, individual fatty acids such as saturated fatty acids (SAFA), mono-unsaturated fatty acids (MUFA) and polymono-unsaturated fatty acids (PUFA). Fatty acid ratios are presumed as polyunsaturated fatty acids to saturated fatty acids ratio (P/S ratio).
The highest mean total fat intakes (65 g/day), saturated fatty acids (40 g/day), monounsaturated (12 g/day), polyunsaturated fatty acids intakes 8 g/day) were among the Sundanese ethnic. While the lowest of all the mean total fats and all fatty acids intakes were among the Buginese ethnics. Minangkabau ethnics have the second highest of mean saturated fatty acids intake (35 g/day) and the second lowest intake of poly-unsaturated fatty acids intake about 4.5 g/day (Table 1).
Table 1. Mean macro nutrients, individual fatty acid, total cholesterol and P/S ratio intakes among Minangkabau, Sundanese, Javanese and Buginese ethnic groups.
Nutrients
Individual fatty acid & total cholesterol & P/S ratio SAFA
275 302
373 480
N =
Ethnic groups
Buginese Javanese
Sundanese Minangkabau
25
24
23
22
21
20
19
18
Figure 1. Mean percentage of SAFA to total energy intake among Minangkabau, Sundanese, Javanese and Buginese ethnic groups
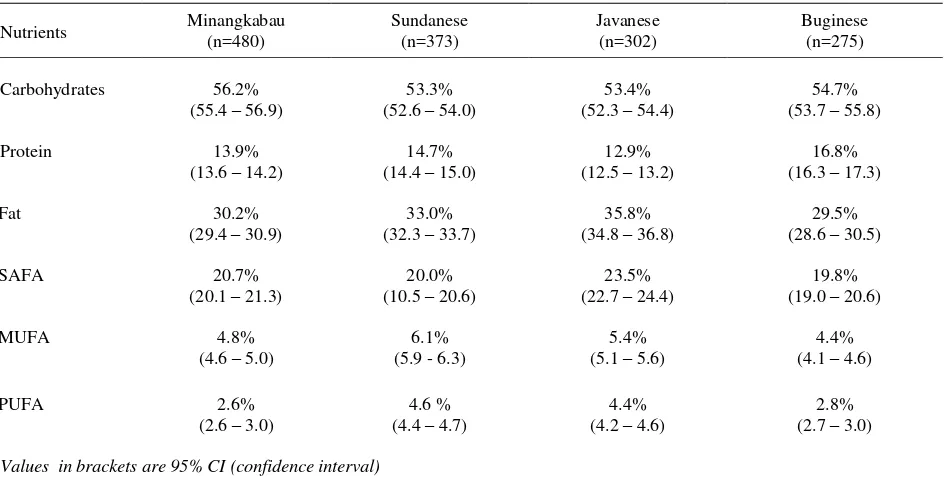
Table 2. Contribution of carbohydrate, protein, total fat, saturated fatty Acids (SAFA), monounsaturated fatty acids (MUFA), polyunsaturated fatty acids (PUFA) to total energy intake among Minangkabau, Sundanese, Javanese and Buginese ethnic groups
Nutrients Minangkabau
(n=480)
Sundanese (n=373)
Javanese (n=302)
Buginese (n=275)
Carbohydrates 56.2%
(55.4 – 56.9)
53.3% (52.6 – 54.0)
53.4% (52.3 – 54.4)
54.7% (53.7 – 55.8)
Protein 13.9%
(13.6 – 14.2)
14.7% (14.4 – 15.0)
12.9% (12.5 – 13.2)
16.8% (16.3 – 17.3)
Fat 30.2%
(29.4 – 30.9)
33.0% (32.3 – 33.7)
35.8% (34.8 – 36.8)
29.5% (28.6 – 30.5)
SAFA 20.7%
(20.1 – 21.3)
20.0% (10.5 – 20.6)
23.5% (22.7 – 24.4)
19.8% (19.0 – 20.6)
MUFA 4.8%
(4.6 – 5.0)
6.1% (5.9 - 6.3)
5.4% (5.1 – 5.6)
4.4% (4.1 – 4.6)
PUFA 2.6%
(2.6 – 3.0)
4.6 % (4.4 – 4.7)
4.4% (4.2 – 4.6)
2.8% (2.7 – 3.0)
The percentage of PUFA to the total energy of two ethnic in this study were more than 3%, 4.6% among the Sundanese and 4.4% among the Javanese respectively. While the other two ethnic groups the percentage of PUFA were a little bit less than 3%, 2.6% among Minangkabau and 2.8% among the Buginese ethnic respectively (Figure 2 and Tables 2).
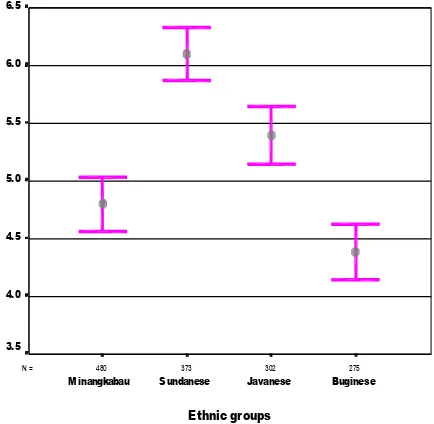
Similar with the percentage of PUFA to total energy, the percentage of MUFA to total energy intake were higher among the two ethnic groups, Sundanese and Javanese (6.1% vs 5.5%). While the percentage of MUFA between the other two ethnic groups Minangkabau and Buginese ethnic were lower (2.6% vs 2.8%) (Figure 3 and Tables 2). We could consider, that the percentages of MUFA of the four ethnic groups were still not adequate based on the recommended value.
275 302
373 480
N =
Ethnic groups
Buginese Javanese
Sundanese Minangkabau
5.0
4.5
4.0
3.5
3.0
2.5
2.0
Figure 2 . Mean percentage of PUFA to total energy intake among Minangkabau, Sundanese, Javanese and Buginese ethnic groups
275 302
373 480
N =
Ethnic groups
Buginese Javanese
Sundanese Minangkabau
6.5
6.0
5.5
5.0
4.5
4.0
3.5
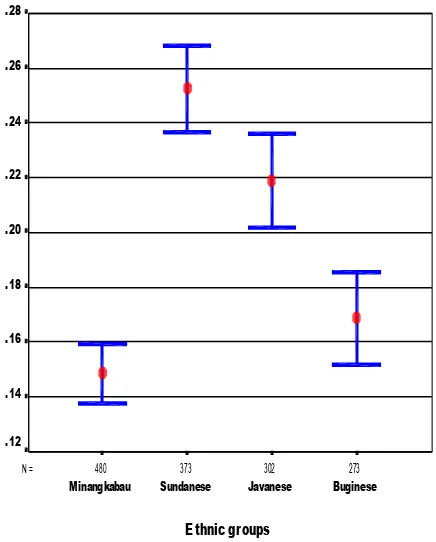
The percentage of fat and SAFA to total energy intake among Sundanese and Javanese ethnic were considered high and the percentage of PUFA and MUFA among these two ethnics were also considered high compared to the other two ethnics, Minangkabau and Buginese ethnics. This might explain also the differences of the fatty acid ratios among those four ethnics (Figure 4.). Sundanese and Javanese ethnic groups had the highest P/S ratio 0.25 and 0.22, while the Minangkabau and Buginese ethnic had lower ratio, 0.15 and 0.17 respectively.
Among the Minangkabau ethnics, the mean fatty acid ratios, the P/S ratio was significantly lower compared to the other two ethnics, Sundanese and Javanese. Although Sundanese have the highest mean total fats and all mean of fatty acids intake, but in term of mean P/S ratio, Sundanese ethnic have the highest mean P/S ratio compared to the other two ethnics, Minangkabau and Buginese ethnics. The mean of P/S ratio between Sundanese and Javanese ethnics were more or less similar, not significant different (Figure 4 and Table 1).
273 302
373 480
N =
Ethnic groups
Buginese Javanese
Sundanese Minangkabau
.28
.26
.24
.22
.20
.18
.16
.14
.12
Figure 4. Mean P/S ratio among energy among Minangkabau, Sundanese, Javanese and Buginese ethnic groups
Dietary food with a low P/S ratio approximately 0.2 will be considered as a diet that might increase plasma cholesterol level and considered as more atherogenic. While higher P/S ratio around 0.8 was considered as less atherogenic and might reduced plasma cholesterol level.10,11 It was also suggested that the P/S ratio should not exceeded 1.5. Because when the P/S ratio was above 1.5 the HDL cholesterol would be decreased.12
The P/S ratio of these four ethnic groups were all approximately or less than 0.2. If we used 0.2 as a cut
For those who were concerned about their risk of heart disease, they should consume generally healthy diet and reduced their fat intake, limit the total fat intake to 30% or less of total energy. And out of this 30%, about one third should come from SAFA, one third from PUFA and one third from MUFA. It was recommended that the ratio of PUFA: MUFA: SAFA should be 1: 1: 1. Table 3 showed the total fat intake, fatty acid ratios to relative saturated fatty acid intakes among the four ethnic groups. Although the ratios of the four ethnic groups were far from the recommended ratio, like P/S ratio, Sundanese and Javanese ethnic groups had better ratios compared to the ratios of Minangkabau and Buginese. Based on the ratio of PUFA: MUFA: SAFA, we could consider that Minangkabau and Buginese ethnic groups both had poor quality of dietary fat pattern. Based on the mean total fat intake, it was shown that Minangkabau had much higher fat intake compared to the Buginese. Having the poor quality of dietary fat pattern and higher fat intake, we might take into consideration that the Minangkabau ethnic groups, had higher risk toward dyslipidemia compared to the other three ethnic groups
CONCLUSSION
1. There were differences of fatty acid intake among the four ethnic groups.
2. Based on P/S ratio as well as ratio of PUFA : MUFA : SAFA, Minangkabau ethnic had poorest quality of dietary fat pattern.
3. Based on the mean total fat intake, it was shown that Minangkabau had much higher fat intake compared to Buginese ethnic.
RECOMMENDATION
To achieve better fatty acid intake profiles, protective food against CHD risks, such as food sources of PUFA, risk can be advised to be added to the daily diets, especially toward the Minangkabau ethnic.
Nutrition health education should take into consideration food consumption pattern among the ethnic which are related to lipid profiles. Such as those food which considered as protective food toward CVD and those non protective food.
Indonesia should develop food consumption tables, which consists fatty acid consumption of all Indonesian foods.
REFERENCES
1. Krauss RM, Eckel RH, Howard B, Appel LJ, Daniels SR,
Deckelbaum RJ, et al. AHA Dietary Guidelines: revision 2000: A statement for healthcare professionals from the Nutrition Committee of the American Heart Association. Circulation 2000; 102: 2284-99.
2. Barr SL, Ramakrishnan R, Johnson C, Holleran S, Dell RB, Ginsberg HN. Reducing total dietary fat without reducing saturated fatty acids does not significantly lower total plasma cholesterol concentrations in normal males. Am J Clin Nutr 1992; 55:675-81.
3. Keys A. Coronary heart disease in seven countries. XVII. The diet. Circulation, 1970; 41:162-83.
4. Kromhout D, Menotti A, Bloemberg B, Aravanis C, Blackburn H, Buzina R, Dontas AS, Fidanza F, Giampaoli S, Jansen A, et al. Dietary saturated and trans fatty acids and cholesterol and 25-year mortality from coronary heart disease: the Seven Countries Study. Prev Med 1995; 24:308-15.
5. Kato H, Tillotson J, Nichaman MZ, Rhoads GG, Hamilton HB. Epidemiologic studies of coronary heart disease and stroke in Japanese men living in Japan, Hawaii and California. Am J Epidemiol 1973; 97:372-85.
6. Yu S, Derr J, Etherton TD, Kris-Etherton PM. Plasma cholesterol-predictive equations demonstrate that stearic acid is neutral and monounsaturated fatty acids are hypocholesterolemic. Am J Clin Nutr 1995; 61:1129-39. 7. WHO. Technical Report Series 797. Diet nutrition, and
the prevention of chronic disease: Geneva, 1990.
8. Mensink RP, Katan MB. Effect of a diet enriched with monounsaturated or polyunsaturated fatty acids on levels of low-density and high-density lipoprotein cholesterol in healthy women and men. N Engl J Med 1989; 321:436-41. 9. Kushi LH, Lew RA, Stare FJ, Ellison CR, el Lozy M,
Bourke G, Daly L, Graham I, Hickey N, Mulcahy R, et al. Diet and 20-year mortality from coronary heart disease. The Ireland-Boston Diet-Heart Study. N Engl J Med 1985; 312:811-8.
10. Hayes KC. Dietary fat and coronary hear t disease. In Preventive nutrition :The comprehensive guide for health professionals, Bendich A & Deckelbaum R (eds) pp. 153-169. Human press Inc: Totowa, New Jersey, 1997. 11. Guthrie HA, Picciano MF. Lipid. In Human Nutrition pp.
111-150. Mosby, A Times Mirror Company. St Louis Missouri, 1995.