UNIVERSITI TEKNIKAL MALAYSIA MELAKA
A Fibre Optic Sensor on Acetone Concentration Detection Using
Beam-through Technique
This report is submitted in accordance with the requirement of Universiti Teknikal Malaysia Melaka (UTeM) for the Bachelor of Electronics Engineering Technology
(Telecommunications) with Honours
by
CARVYN BLAISE B071210122 930124-13-5603
6
UNIVERSITI TEKNIKAL MALAYSIA MELAKA
BORANG PENGESAHAN STATUS LAPORAN PROJEK SARJANA MUDA
TAJUK: A Fibre Optic Sensor on Acetone Concentration Detection Using
Beam-through Technique
SESI PENGAJIAN: 2015/16 Semester 2
Saya CARVYN BLAISE
mengaku membenarkan Laporan PSM ini disimpan di Perpustakaan Universiti
Teknikal Malaysia Melaka (UTeM) dengan syarat-syarat kegunaan seperti berikut:
1. Laporan PSM adalah hak milik Universiti Teknikal Malaysia Melaka dan penulis. 2. Perpustakaan Universiti Teknikal Malaysia Melaka dibenarkan membuat salinan
untuk tujuan pengajian sahaja dengan izin penulis.
3. Perpustakaan dibenarkan membuat salinan laporan PSM ini sebagai bahan pertukaran antara institusi pengajian tinggi.
4. **Sila tandakan ( ) SULIT
TERHAD
TIDAK TERHAD
(Mengandungi maklumat yang berdarjah keselamatan
atau kepentingan Malaysia sebagaimana yang termaktub
dalam AKTA RAHSIA RASMI 1972)
(Mengandungi maklumat TERHAD yang telah ditentukan
oleh organisasi/badan di mana penyelidikan dijalankan)
iii
DECLARATION
I hereby, declare that this thesis entitled “A Fibre Optic Sensor on Acetone Concentration Detection Using Beam-through Technique” is the result of my own research except as cited in references.
Signature : ………
iv
APPROVAL
This report is submitted to the Faculty of Engineering Technology of UTeM as a partial fulfilment of the requirements for the degree of Bachelor’s Degree of Electronic Engineering Technology (Telecommunications) (Hons.). The member of the following supervisory is as follow:
v
ABSTRACT
The design of current sensor technology especially when related to the chemical still requires a certain degree of the quantitative reliability. The conventional chemical-related sensor may enable a cross sensitivity to happen as the chemical used as the parameter requires an ultra active electrode catalyst and a high operating potential for its oxidation. In this case, chemical substances that are more easily oxidised such as alcohol and carbon monoxide could interfere the sensitivity of the sensor. The chemical such as acetone is mostly to be found in the bodily fluid during the fasting period especially those who are in a diabetic condition. Along with glucose, the acetone level may also need to be monitored as it could indicate the severity of the diabetes. Thus a fibre optic sensor which is more inert to the oxidation reaction may be developed. Fibre optic sensor has gained much attention in the research field, as it is considered to be more sensitive, fast detection rate and reliable sensors. The development of fibre optic sensor on acetone detection by using beam-through technique could be a milestone in the health and sensor field.
vi
ABSTRAK
Rekaan teknologi sensor pada masa kini terutama yang melibatkan bahan kimia, masih memerlukan kebolehpercayaan pada tahap tertentu. Sensor konvensional yang berkaitan dengan kimia boleh menyebabkan berlakunya sensitiviti silang kerana bahan kimia yang digunakan sebagai perimeter memerlukan pemangkin elektrod yang sangat aktif dan potensi operasi yang tinggi untuk proses pengoksidaan. Dalam hal ini bahan kimia yang lebih senang untuk berlakunya proses pengoksidaan seperti alkohol dan karbon monoksida boleh menggangu kepekaan sensor tersebut. Bahan kimia seperti aseton kebanyakkannya boleh dijumpai dalam bendalir badan sewaktu tempoh berpuasa terutamanya bagi golongan yang mengidap diabetes. Selain glukosa, paras aseton dalam badan juga perlu untuk dipantau kerana ia boleh menunjukkan betapa tahap parah diabetes itu Oleh itu sensor berasaskan gentian optik yang lebih tidak reaktif kepada tindak balas pengkosidaan boleh dibangunkan. Sensor berasakan gentian optik telah mendapat sambutan meluas dalam bidang penyelidikan, kerana ia dianggap sebagai lebih sensitif, kadar pengesanan yang tinggi, san sensor yang booleh dipercayai. Pembangunan sensor berasaskan gentian optic terhadap pengesanan aseton menggunakan teknik pancaran-terus boleh menjadi bermakna dalam bidang kesihatan dan bidang sensor.
Kata kunci: sensor berasaskan gentian fiber, pengesanan aseton, teknik pancaran
vii
DEDICATION
viii
ACKNOWLEDGEMENT
Thanks be to God, who with His willing; giving me the opportunity to complete this Final Year Project entitled Fibre Optic Sensor on Acetone Detection Using Beam-through Technique. This final year project report was prepared for Faculty of Engineering Technology, Universiti Teknikal Malaysia Melaka (UTeM), basically for student in final year to complete the undergraduate programme that leads to the Bachelor Degree in Electronic Engineering Technology (Telecommunications).
Firstly, I would like to express my deepest thanks to, Mr. Md Ashadi Md Johari, a lecturer at Faculty of Engineering Technology, UTeM, and also assigned as my supervisor who had guided me throughout this project. Many thanks also to Mr. Azham Akram Abdullah for allowing me to conduct this project in his laboratory.
ix
LIST OF ABBREVATIONS, SYMBOLS AND NOMENCLATURES ... xvi
CHAPTER 1: INTRODUCTION ... 1
1.1 Introduction ... 1
CHAPTER 2: THEORETICAL BACKGROUND ... 4
2.1 Introduction ... 4
2.2 Fibre Optic ... 4
x
2.3.1 Fibre optic surface plasmon resonance sensor ... 6
2.3.2 Fibre optic displacement sensor ... 8
2.3.3 Fibre optic bundle displacement sensor ... 9
2.3.4 Highly sensitive fibre optic sensor ... 10
2.4 Microfibre Optic Sensor ... 11
2.4.1 Fibre Bragg gratings in optical microfibre [9] ... 11
2.4.2 Conducting polymer coated optical microfibre sensor [10] ... 13
2.4.3 Optical microfibres decorated with PdAu for hydrogen sensing [11] ... 15
2.4.4 Optical microfibre for current sensing ... 15
2.5 Light Source Used in Fibre Optic Sensor [4] ... 17
2.6 Acetone [14] [15] ... 18
2.6.1 Acetone in Diabetic Ketoacidosis ... 18
2.6.2 Acetone Usage in Industry ... 20
2.7 Previous Research on Acetone Concentration Sensor ... 21
2.7.1 A novel acetone sensor utilising cataluminescence [23] ... 21
2.7.2 Selective detection of acetone and ethanol using MOX-sensor [24] ... 22
2.7.3 Highly accurate acetone sensor based on C-doped WO3 [25] ... 23
2.7.4 Low concentration acetone detection for exhaled breath sensing [25] ... 24
2.7.5 C-nanotubes–SnO2 nanocomposite sensor for acetone detection [26] ... 25
2.7.6 Acousto-optic method for quality control of liquid mixture ... 26
xi
CHAPTER 3: METHODOLOGY ... 28
3.1 Introduction ... 28
3.2 Flow Chart ... 28
3.3 Selection of the Title ... 29
3.4 Discussion With Supervisor ... 29
3.5 Literature Review of Related Issues ... 29
3.6 Methodology Research and Justification of the Procedure ... 30
3.7 Raw Material Inspection ... 30
3.8 Fibre Optic Sensor (FOS) Development ... 31
3.9 Fibre Optic Sensor (FOS) Testing ... 33
3.10 Acetone Sensor Testing ... 34
3.11 Collection of Data ... 35
3.12 Report Writing and Proofreading ... 35
CHAPTER 4: RESULTS AND DISCUSSION ... 36
4.1 Introduction ... 36
4.2 Input wavelength, λi = 1550 nm ... 36
4.2.1 Comparison of power loss of each different concentration... 37
4.2.2 Comparison of front and back slope of each concentration graph ... 38
4.2.3 Sensitivity and linearity of fibre optic sensor based on the graphs ... 40
4.2.4 Conclusion ... 42
xii
4.3.1 Comparison of power loss of each different concentration... 43
4.3.2 Comparison of front and back slope of each concentation graph ... 44
4.3.3 Sensitivity of the fibre optic sensor based on the graphs ... 46
4.3.4 Conclusion ... 48
4.4 Overall Conclusion ... 48
CHAPTER 5: CONCLUSION AND FUTURE RECOMMENDATION ... 49
5.1 Introduction ... 49
5.2 Conclusion on Chapter 1 and Chapter 2 ... 49
5.3 Conclusion of Chapter 3 ... 49
5.4 Conclusion of Chapter 4 ... 50
5.5 Future Recommendation ... 50
REFERENCES ... 52
APPENDICES
A Fibre Optic Sensor (Theoretical Background) B Acetone (Theoretical Background)
xiii
LIST OF TABLES
Table 4.1 Sensitivity of the 1550 nm graph ... 40
Table 4.2 Linearity of the 1550 nm graph ... 42
Table 4.3 Sensitivity of the 1310 graph ... 46
xiv
LIST OF FIGURES
Figure 2.1 Basic anatomy and mechanism of fibre optic ... 4
Figure 2.2 Schematic of a fibre optic sensing system ... 5
Figure 2.3 Variation of resonance wavelength with the concentration of glucose ... 6
Figure 2.4 Sensitivity & detection accuracy of the sensor with glucose concentration 7 Figure 2.5 Output voltage against displacement for various concentrations of sodium chloride in de-ionised water using 594nm He-Ne laser. ... 8
Figure 2.6 Experimental setup of FOBDS ... 9
Figure 2.7 Schematic of a fibre taper with a FBG inscribed over the uniform region 12 Figure 2.8 Peak separation for the mFBG in rectangular microfibre with a = 4.8 µm12 Figure 2.9 Wavelength shift during optical measurement of each alcohol tested ... 14
Figure 2.10 Schematic of a current sensor... 16
Figure 2.11 Displacement response when POF coupler is used as a sensor probe .... 17
Figure 2.12 CTL response profiles for different acetone concentrations ... 21
Figure 2.13 Sensor response for acetone ... 23
Figure 2.14 Sensing response at different temperatures to acetone (0.2-5 ppm) ... 24
Figure 2. 15 Acoustic velocity as a function of each mixtures. ... 26
Figure 3.1 Project Flowchart ... 28
Figure 3.2 Mixtures of four kinds of acetone concentration ... 30
Figure 3.3 Splicing device (Fujikura Fusion Splicer 19/70S) ... 31
Figure 3.4 The conditions of splicing two fibre optics ... 31
Figure 3.5 Splicing status as viewed on the device’s screen ... 32
Figure 3.6 MU connector ... 32
Figure 3.7 A fully developed fibre optic sensor ... 33
xv
Figure 4.1: Power loss of different concentration tested using λi = 1550 nm ... 37
Figure 4.2 Power loss of the 20% acetone concentration as λi = 1550 nm ... 38
Figure 4.3 Power loss of the 40% of acetone concentration as λi = 1550 nm ... 38
Figure 4.4 Power loss of the 60% of acetone concentration as λi = 1550 nm ... 39
Figure 4.5 Power loss of the 80% of acetone concentration as λi = 1550 nm ... 39
Figure 4.6 Power loss of different concentration tested using λi = 1310 nm ... 43
Figure 4.7 Power loss of the 20% of acetone concentration as λi = 1310 nm ... 44
Figure 4.8 Power loss of the 40% of acetone concentration as λi = 1310 nm ... 44
Figure 4.9 Power loss of the 60% of acetone concentration as λi = 1310 nm ... 45
xvi
LIST OF ABBREVATIONS, SYMBOLS AND NOMENCLATURES
˚C : Degree Celcius
(CH3)2CO : Acetone / propane-2-one
[CH3COCH2COH(CH3)2] : Diacetone alcohol
∆ : Birefringence
µm : Micrometre
µm / rad : Micrometre per radian
Λ : Wavelength
2-[14C]-acetone : 2-Carbon-14 acetone
3D : Three dimensional
A : Core radius
AO : Acousto-optics
AOT : Dioctyl sodium sulfosuccinate
CH3•CO•CH2•COH(CH3)2 : Diacetone alcohol
CH3•CO•CH3 : Acetone / propane-2-one
CO2 : Carbon dioxide
CTL : Cataluminescence
DC : Direct Current
DKA : Diabetic Ketoacidosis
FBG : Fibre Bragg Gratings
FO-SPR : Fibre Optic Surface Plasmon Resonance
xvii
FODS : Fibre optic displacement sensor
He-Ne : Helium-Neon
HRTEM : High-resolution transmission electron microscopy
IO : Inverse Opals
IUPAC : International Union of Pure and Applied Chemistry
LDO : Layered double oxide
MBK : Methyl iso-butyl Ketone
mFBG : Microfibre Bragg Gratings
mg / dL : Milligram per decilitre
mM : Millimole
MMZI : Microfibre Mach-Zehnder interferometre
MOX : Metal Oxide
mV / % : Millivolt per percentage
MWCNT : Multiwall carbon nanotubes
NH+ : Ammonium ion
NH3 : Ammonia
nm : Nanometre
Nm / % : Nanometre per percent
PAA-ran-PAAPBA : Borate polymer
PAni : Polyaniline
PdAu : Lead-Gold
xviii
ppm : Parts per million
RI : Refractive index
RIU : Refractive-index unit
RSD : Relative standard deviation
SEM : Scanning electron microscope
SMF : Single Mode Fibre
SMS : Single-mode-multi-mode-single-mode
SPA : Surface plasmon sensor
SnO2 : Tin Oxide
UV : Ultraviolet
VOCs : Volatile Organic Compounds
WO3 : Tungsten trioxide
XPS : Xray Photoelectron Microscopy
XRD : Xray Powder Diffraction
1
CHAPTER 1
INTRODUCTION
1.1 Introduction
This chapter discusses about the project background, the problem statement, objectives of the project, project limitation and the scope of the project.
1.2 Background
A sensor is a device that is used to sense some characteristic of its environs. It detects events or changes in quantities and provides a corresponding output. Technological progress allows more and more sensors to be manufactured on a microscopic scale as micro-sensors. In most cases, a micro-sensor reaches a significantly higher speed and sensitivity compared with macroscopic approaches.
In recent years, fibre optic sensors received more considerable research efforts as the need for more sensitive and reliable sensors to measure a large range of physical, chemical and biomedical quantities. These research efforts are done due to the fact that fibre optic sensor has a potential sensitivity, detection speed and abilities to the widely assay condition.
Acetone is an organic compound with the formula (CH3)2CO. It is a colourless, volatile, flammable liquid, and is the simplest ketone. Its IUPAC (International Union of Pure and Applied Chemistry) name is propan-2-one.
2
substances are commonly known as ketone body. Measurements of ketone in urine and blood are widely used in the management of patients with diabetes as adjuncts for both diagnosis and ongoing monitoring of Diabetic Ketoacidosis (DKA).
Overall this project is mainly focusing on the fibre optic sensor of acetone detection using beam-through technique development.
1.3 Problem Statement
A precise and highly sensitive sensor is highly preferred when it comes to measurement and analyse a chemical substance. In medical laboratories for example, a blood sample is obtained from a diabetic ketoacidosis patient and thus it requires an accurate and precise acetone concentration information for further evaluation.
Various kind of sensors have been developed nowadays. In general, the chemical sensors are broadly classified into gas, liquid, and solid particulate sensors based on the phases of the analyte. They can be further categorised as optical, electrochemical, thermometric, and gravimetric (mass sensitive) sensors according to the operating principle of the transducer. The design of chemical sensors also requires appreciation of the needed degree of quantitative reliability (precision or accuracy).
An electrochemical sensor for an example, has been also introduced to determine the chemical concentration. Nonetheless, a cross sensitivity could happen because the chemical that is used as the might require a very active working electrode catalyst and high operating potential for its oxidation. In this case a chemical substance which are more easily oxidised such as alcohol and carbon monoxide could interfere the sensitivity of the sensor.
3 1.4 Objective
The objectives of this project are: i. To study fibre optic sensor
ii. To develop fibre optic sensor for acetone detection
iii. To analyse the performance of fibre optic for different value of acetone concentration
1.5 Limitation
This project would be implemented by optimising the usage of fibre optics sensor based on beam-through technique. This sensor will be used to detect the concentration of acetone.
1.6 Scope
4
CHAPTER 2
THEORETICAL BACKGROUND
2.1 Introduction
This chapter will provide the review form previous research that is related to this final year project. There are previous researches understanding on the fibre optic sensor, technique used in fibre optic sensor, the role of acetone in the diabetic ketoacidosis, acetone in industrial usage, and the current acetone sensor.
2.2 Fibre Optic
(a) A cylindrical glass fibre core cladded by lower refractive index
glass.
(b) Light rays incident are trapped inside the fibre core.
Figure 2.1 Basic anatomy and mechanism of fibre optic
5
supported, and supporting structures may distort the fibre considerably, thereby affecting the guidance of the light wave. This can be avoided by choosing a sufficiently thick cladding. When the core radius a is large (≈ 25 µm or more); a more detailed description
of single and multimode fibre is given in the next section. For a typical (multimode) fibre,
a ≈ 25 µm, n2 ≈ 1.45 (pure silica), and Δ ≈ 0.01, giving a core index of n1 ≈ 1.465. The
cladding is usually pure silica, while the core is usually silica doped with germanium; doping by germanium results in an increase in the refractive index.[1]
2.3 Fibre Optic Sensor
Figure 2.2 Schematic of a fibre optic sensing system
6
Doppler anemometers, noncontact vibration measurement, and pressure sensors which find wide applications in automobiles and aerospace, for example.[1]
2.3.1 Fibre optic surface plasmon resonance sensor
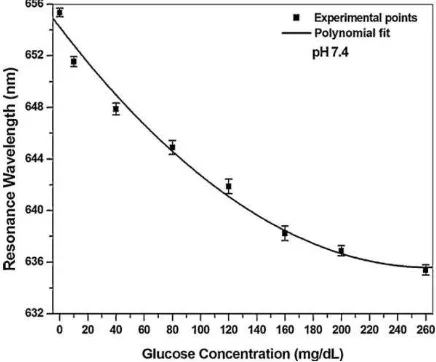
Singh and Gupta (2013) [2] reported that the fabrication and characterisation of a surface plasmon resonance (SPR) based fibre optic sensor, working on wavelength interrogation method, to measure the low glucose concentration (similar to the human blood) in aqueous fluid. The sensing probe is prepared by coating of films of silver and silicon on the optical fibre core followed by immobilisation of enzyme (glucose oxidase) using gel entrapment method.
Figure 2.3 Variation of resonance wavelength with the concentration of glucose