ISSN 0973-4562 Volume 9, Number 22 (2014) pp. 12393-12402 © Research India Publications
http://www.ripublication.com
EMG Signal Statistical Features Extraction Combination
Performance Benchmark Using Unsupervised Neural
Network for Arm Rehab Device
Z.H. Bohari1#, M.H. Jali2#, M.F. Baharom3#, M.N.M.Nasir4#, H.I. Jaafar5# and W.M. Bukhari6#
#
Faculty of Electrical Engineering, Universiti Teknikal Malaysia Melaka (UTeM) Hang Tuah Jaya, 76100 Durian Tunggal, Melaka, Malaysia
E-mail: [email protected], [email protected],
3
[email protected], [email protected],
5
[email protected], [email protected]
Abstract
Keyword: Arm Rehabilitation Device, EMG, Time Domain Features, Self-Organizing Maps (SOM)
1.
Introduction
Human support system is called endoskeleton. Endoskeleton plays a role as a framework of the body which is bone. Our daily movements are fully depends on the functionality of our complex systems in the body. The disability one or more of the systems in our body will reduce our physical movements. The assistive device is a need for rehab as an exoskeleton. The functionality of the rehabilitation device has to smooth as the physical movement of normal human. The rehabilitation programs provide the suitable program for conducting the nerve and stimulate the muscles. People who have temporary physical disability have the chances to recover. Nowadays, rehabilitation program are using exoskeleton device in their tasks. The functionality of exoskeleton depends on muscle contraction.
The technique of measuring electrical activity that produced from the muscles during rest or contractions known as electromyography (EMG) [1],[3] [4] [14]. The electric signal generates from the brain and sends to the muscles via motor neuron. The EMG may detect the dysfunctional of the muscles or failure in signal transmission from nerve to muscle. The failure of sending the electrical signal from the brain requires electrical stimulation from the external source to muscles. Electrodes are used for signal detection of electrical activity in muscles. The study of this electrical activity is important for combination of electromyogram and rehabilitation device. Electromyogram studies help to facilitate the effectiveness of the rehabilitation device by analyzing the signal transmitted from the muscle [10] [12] [16][17][18][19][20].
The rehabilitation device is a tool that used to help the movements for daily life activities of the patients who suffer from the failure of muscle contractions, due to the failure of the muscles contractions the movements is limited. The ability of the patients to do the tasks in the rehabilitation programs need to be measured. The rehabilitation programs have to assure whether the tasks will cause effective or bring harm to the patients [11].
Historically, the rehabilitation tasks have been avoided due to a belief that it would increase spasticity [7]. In this paper, the analysis of the data will be focusing on upper limb muscles contraction consisting of biceps muscles only. The experiment is limited to the certain of upper limb movements that use in training. EMG is a division of bio signal; the bio signal analysis is the most complex analysis. Thus, the signal analysis is a complicated process that has to be through many phases of analysis [2]-[3].Therefore, the challenge of this study to assure that the signal processing is conducted properly to overcome the environment noise during data collection.
induced through negative feedbacks between neurons. The system is called Self Organizing Map (SOM) because all nodes are forced to be self-organized through the feedback path.
a) Based on neurological studies, all human sensory inputs are mapped onto certain areas at the cerebral cortex that form a map called Topographic Map [15]. It has two most essential assets;
b) At each stage of processing, every each information is reserved in its proper environment.
c) Close related information nodes will be close to each other to ensure short synaptic connections.
d) SOM primary purpose is to transform incoming input patterns into a one or two dimensional discrete map. This process must be performing in orderly approach. In this research work, SOM is used to determine the features combination for rehabilitation control.
2.
Methodology
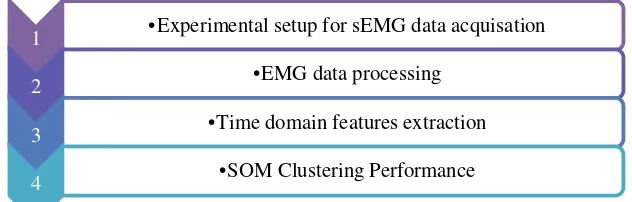
Fig. 1 shows a chevron diagram of our research methodology that consists of four major phases. It started with the experimental setup sEMG data gathering. Second phase is EMG data processing. Third phase is the extraction time domain features. Finally, SOM will do the clustering and the performances are observed.
Fig. 1: Research Strategy
2.1 Experimental Setup
Implementation of arm rehabilitation device based on movement is recorded from the EMG signal of healthy subjects. From the human anatomy studies, different angle movements of upper limb with elbow as the reference is depends on relation of agonist and antagonist. This study is focusing on the behaviour of biceps muscle as agonist and the triceps as the antagonist respectively. Muscle that involved in this movement is biceps and triceps, however in this study to understand the electrical activity during muscle contraction, the biceps is the only muscle that taking into account. The movements’ ranges in between position of arm flexion until arm fully extend.
The environment is in a room with low lighting especially the fluorescent light, any electromagnetic devices is away from the experiment equipment and the environment
1 •Experimental setup for sEMG data acquisation
2 •EMG data processing
3 •Time domain features extraction
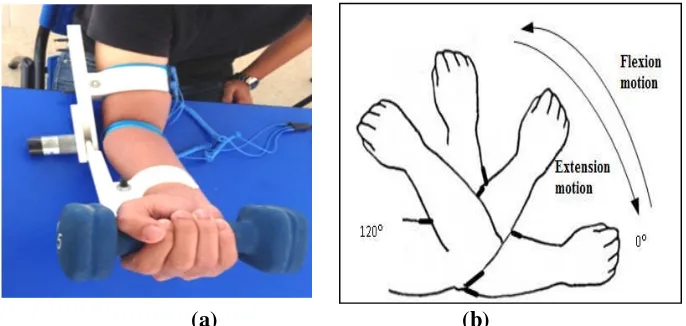
is in silent room. Then, the experimental is set up with the subject sit on the chair while the hand is on the table. The subject has to complete the task of lift up the dumbbell with 2.268kg of weigh in Fig. 2(b) for 5 times. Normally, the appearance of EMG signal is chaos and noisy depends on the type of electrodes also the noise factor. To simplify the difference of amplitude response for the motion, the dumbbell is functioned to amplify the amplitude in analysing the electrical activity during rest and contract. The rehabilitation devices (white in colour on Fig 2(a). helps to keep the position of the elbow joint and the wrist joint in line. Mostly, the EMG signal is obtained after several trials of the movements. These movements are specified from angle of 0° (arm in rest position), up to 120°(arm is fully flexion). These electrodes are connected to the combination of hardware Olimex EKG-EMG-PA and Arduino Mega for data collection [16]-[20].
(a) (b)
Fig. 2: Subject is set-up with arm rehabilitation assistive device for experiment (a). Simulation of subject’s to lift up the dumbbell 2.268kg of weight (b). 2.2 EMG Data Processing
The filtering signal is accessed for features extraction. The raw sEMG signal is continued by filtering for removing the noise in purpose to obtain the clean features. Low pass filter is chosen for removing the unwanted frequencies of a sEMG signal. The filter preserves the wave shape of any filtered signals across the group delay in the pass band. EMG signal is filtered in the range of above 10Hz as a cut off frequency for low pass filtered. The DC offset of the EMG signal is removed and is rectified to obtain its absolute value. Finally, the signal was smoothed and normalized passing it through a 5th order Butterworth type low-pass filter with cut off frequency 10Hz. 2.3 Time-domain Features Extraction
can be implemented in real time. These features can be analyze by using the powerful tool which is MATLAB, as for this study, the analysis is conducted in MATLAB 2013a. There are many features that related to time domain and below is described more on features used in this study;
1) Root mean square (RMS)
The RMS represents the square root of the average power of the EMG signal for a given period of time. It is known as a time domain variable because the amplitude of the signal is measured as a function of time.
∑
= under the EMG signal once it has been rectified, it is defined by thenegative voltage values have been made positive. The MAV is used as a measure of the amplitude of the EMG signal like the root mean square (RMS) the RMS is often preferred over the MAV because it provides a measure of the power of the EMG signal while the MAV does not. The mean absolute value is calculated using a moving window. It is calculated for each window of data according to the equation:∑
taken from data are frequently written as the mean ± SD.∑
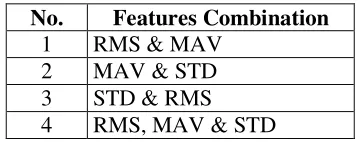
The combinations of selected features are extremely important to produce the best clustering result for SOM. This research work proposed four combinations features as presented in Table 1;
Table I:Combination of SOM Clustering Performance. No. Features Combination
‘range’ normalization. Features extracted (RMS, MAV & STD) from the sEMG signal are evaluated using SOM to determine the best combination. The performances of each combination of feature are evaluated according to their quantization error, topographic error and training time. The intended for both quantization and topographic error is zero (0 or near zero) while for training time, the best value are equal or less than 5 seconds. These values will determined the performance of the combination and eventually lead to selection of best combination for further classification.
5) Architecture of SOM Network
SOM structure built from two main layers; input and output layer that sort in two-dimensional preposition. SOM algorithms resemble Learning Vector Quantization (LVQ). In LVQ all neurons are arranged on a grid together with selected neurons whereas SOM has a feed-forward structure with a single computational layer arranged in rows and columns. Each neuron is fully connected to all the source nodes in the input layer. Neighbouring nodes will be updated to perform neurons order. This indicates that SOM as a multidimensional scaling method from input space to two-dimensional output space. Visual format of SOM help researcher to define clusters, relations and structures in complex input database [15].
Fig. 3: SOM Architecture [15]
6) Best Matching Unit (BMU)
Number of neuron may vary from a few dozen up to several thousands. Each neuron is represented by a d-dimensional weight vector (prototype vector, codebook vector) m = [m1,....,md], where d is dimension of input vectors. Neurons connected to the adjacent
neurons through neighbourhood relation that dictates its topology.
SOM is then subjected to iteration for training the network. In the iteration process, one sample vector s from the input data will be selected randomly, and the distances between all the nodes are then calculated by particular distance measures. The neurons that have closest weight vector to the selected sample sis called best matching unit (BMU) and denoted by c
3.
Results and Discussion
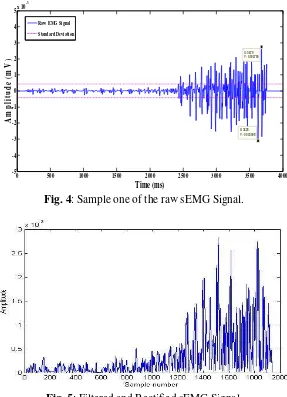
The EMG signals are produced by the subjects during flexion and extension motion by lifting the dumbbell weight at 5 pounds weight using their right hand. The device is designated for right handed person. Fig. 4 shows the sample of raw EMG signal collected from one subject while in Fig. 5 presented a sEMG signal after removing the DC offset of the signal and rectification to obtain its absolute value. Proper filtering is essential to prevent invalid pre-processed data. Five (5) trials are done for every subject to produce the best combination of features. All those combination of values are inputs for SOM clustering performances.
Fig. 4: Sample one of the raw sEMG Signal.
Fig. 5: Filtered and Rectified sEMG Signal.
In Table 2, all type of combination produces near zero in both quantization and topographic error except STD & RMS combination that got zero value for both errors.
0 500 1000 1500 2000 2500 3000 3500 4000
-5 -4 -3 -2 -1 0 1 2 3 4 5x 10
-3
X: 3679 Y: 0.002755
Time (ms)
A
m
p
li
tu
d
e
(m
V
)
X: 3628 Y: -0.003098
For STD & RMS by using the optimum value of neurons (200), this combination proven to be the best when comparing to other combination (RMS & MAV, MAV & STD and RMS, MAV & STD) in terms of error produced and training time needed to produce a good result in clustering.
Table III: Results of SOM Clustering Performance.
No Results
Features Combination
No of Neuron
Quant. Error Topo. Error Train. Time (s)
1 RMS & MAV 200 0.0000 0.0067 9
2 MAV & STD 200 0.0000 0.1330 10
3 STD & RMS 200 0.0000 0.0000 5
4 RMS, MAV & STD 200 0.0010 0.1330 5
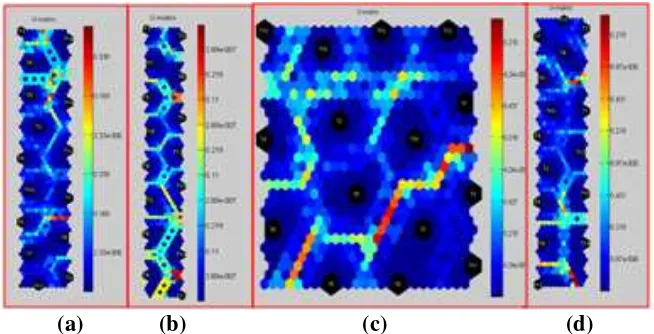
Next, for further analysis, the U-Matrix results for the four feature combinations are depicted in Fig. 5(a), (b), (c) and (d). By using same number of neurons (200) with hexagonal topology the combination of STD & RMS still the most reliable result especially for the Unified Matrix mapping. Theoretically, (RMS, MAV & STD) features with more combination will produce the best result but according to this research work (STD & RMS) combination is the best. It proved that the right features combination produced more accurate and quality classification result compare to more features combination. The clarity and quality of mapping and the produced boundary or separation between different trials produced by SOM clustering. This combination will be further utilized in further research to optimize the classification process.
(a) (b) (c) (d)
4.
Conclusion
In conclusion, based on the experiment result a combination of RMS and STD generate the best result in term of error and training time and proved only certain features produce high impact on designing the rehab device. The combination of RMS, MAV and STD with higher input neurons and longer training time and failed to produce zero error for topographic compare to RMS and STD combination. Thus, it is proven that the right combination of sEMG signals features are crucially important in order to produce a good SOM clustering result and the inclusion too many features will not guarantee producing a better clustering result especially for selecting the right features for rehab devices.
5.
Acknowledgment
The authors would like to thanks Universiti Teknikal Malaysia Melaka (UTeM) and Ministry of Education Malaysia for the financial supports given through Research Grant.
References
[1] M. B. I. Reaz, "Techniques of EMG Signal Analysis: Detection, Processing, Classification and Applications," Cyberjaya, Selangor, www.biologicalprocedures.com, 2006, pp. 11-35.
[2] J. Muthuswamy, "Biomedical Signal Analysis," in Standard Handbook Of Biomedical Engineering And Design, Mc-Graw Hill, 2004, pp. 18.1 - 18.30. [3] M. Z. Jamal, "Signal Acquisition Using Surface EMG and Circuit Design
Considerations for Robotic Prosthesis," in Computational Intelligence in Electromyography Analysis –A Perspective on Current Applications and Future Challenges, InTech, 2012, pp. 427-448.
[4] J. R. Cram, "The Basics of Surface Electromyography," Jones and Bartlett Publishers, pp. 1-8.
[5] C. L. a. P. P. Angkoon Phinyomark, "A Novel Feature Extraction for Robust EMG Pattern Recognition," Journal of Computing, vol. 1, no. 1, pp. 71-80, 2009.
[6] M. R. Ahsan, "Electromygraphy (EMG) Signal based Hand Gesture Recognition using Artificial Neural Network (ANN)," International Conference on Mechatronics (ICOM), vol. 4, 2011.
[7] B. B, "Adult Hemiplegia: Evaluation and treatment.," Oxford, Butterworth-Heinemann., 1990.
[8] A. Chan, "An Assessment Platform For Upper Limb Myoelectric Prosthesis," Biomedical Engineering Program.
[10] M. John W. Krakauer, "Arm Function after Stroke: From Physiology to Recovery," Seminars In Neurology, vol. 25, no. 4, 2005.
[11] S. D. C. G. C. Louise Ada, "Strengthening Interventions Increase Strength and Improve Activity After Stroke: A Systematic Review," Australian Journal of Physiotherapy, vol. 52, pp. 241-248, 2006.
[12] M.Gauthaam, "EMG Controlled Bionic Arm," B.E. Biomedical Engineering,, pp. 111-114, 2011.
[13] S.-P. L. Sang-Hui Park, "EMG Pattern Recognition Based on Artificial Intelligence Techniques," IEEE Transactions On Rehabilitation Engineering, vol. 6, no. 4, 1998.
[14] K. Mahaphonchaikul, "EMG Signal Feature Extraction Based on Wavelet Transform".
[15] Z. H. Bohari, S. Ab Ghani, M.F. Baharom, Y.H. Md Thayoob, “ Feature Analysis of Numerical Calculated Data from Sweep Frequency Analysis (SFRA) Traces Using Self Organizing Maps,” Jurnal Teknologi Special Edition (Recent Research in Engineering) No. 67, Issue 3, March 2014. [16] M. H. Jali, M. F. Sulaima, T. A. Izzuddin, W. M. Bukhari, M. F. Baharom.:
Comparative Study of EMG based Joint Torque Estimation ANN Models for Arm Rehabilitation Device. International Journal of Applied Engineering Research (IJAER), vol. 9, Number 10 (2014) pp. 1289-1301.
[17] M.H.Jali, T.A.Izzuddin, Z.H.Bohari, H.Sarkawi, M.F.Sulaima, M.F.Baharom, W.M.Bukhari, "Joint Torque Estimation Model of sEMG Signal for Arm Rehabilitation Device Using Artificial Neural Network Techniques",International Conference on Communication and Computer Engineering (ICoCoe), 2014.
[18] M.H.Jali, T.A.Izzuddin, Z.H.Bohari, M.F.Sulaima, H.Sarkawi, "Predicting EMG Based Elbow Joint Torque Model Using Multiple Input ANN Neurons for Arm Rehabilitation ",UKSim-AMSS 16th International Conference on Modelling and Simulation, 2014
[19] M.H.Jali, Z.H.Bohari, M.F.Sulaima, M.N.M.Nasir and H.I.Jaafar, "Classification of EMG Signal Based on Human Percentile using SOM", Research Journal of Applied Sciences, Engineering and Technology (RJASET), 2014.
![Fig. 3: SOM Architecture [15]](https://thumb-ap.123doks.com/thumbv2/123dok/512716.58291/6.612.152.454.381.509/fig-som-architecture.webp)