7692 Biochemistry
zyxwvutsrqponmlkjihgfedcbaZYXWVUTSRQPONMLKJIHGFEDCBA
1992, 31, 7692-7699Effect of Lipid Hydroperoxide
on Lipoxygenase Kinetics?
Maria J. Schilstra, Gerrit A. Veldink,' Jan Verhagen, and Johannes F. G. Vliegenthart
Department of Bioorganic Chemistry, Bijvoet Center for Bio- Molecular Research, University
zyxwvutsrqponmlkjihgfedcbaZYXWVUTSRQPONMLKJIHGFEDCBA
of Utrecht,Padualaan 8, 3584 CH Utrecht, The Netherlands
Received October 29, 1991; Revised Manuscript Received May 22, 1992
ABSTRACT: In order to investigate the activation of lipoxygenase and to clarify the role of the oxygenation
product hydroperoxide in this process, the effect of 13-hydroperoxylinoleic acid (P, 0-35 pM) on linoleic acid (S, 1-80 pM) oxygenation catalysis by 12 nM lipoxygenase-1 from soybean was studied at pH 10,
25
zyxwvutsrqponmlkjihgfedcbaZYXWVUTSRQPONMLKJIHGFEDCBA
OC, and 240 p M0
2
with rapid kinetic techniques. The following observations were made: (1) Iron(I1)and iron(II1) lipoxygenases are kinetically different: reactions started with the Fe(I1) enzyme form show a lag phase, whereas iron(II1) lipoxygenase induces an initial burst. (2) Oxidation of the enzyme alone
is not sufficient to abolish the lag phase: at [SI
zyxwvutsrqponmlkjihgfedcbaZYXWVUTSRQPONMLKJIHGFEDCBA
>
50 pM, the initial burst in the iron(II1) lipoxygenasecurves is still followed by a lag. The lag phase disappears completely only in the presence of micromolar quantities of
P.
(3) The approximate dissociation constants for S and P are 15 and 24 pM, respectively, 1 order of magnitude smaller than the corresponding values in the absence of oxygen. The observed kinetics are predicted by numerical integration of the rate equations of a model based on the single lipid binding site mechanism for the anaerobic lipoxygenase reaction [Ludwig et al. (1987) Eur. J . Biochem. 168,325- 337; Verhagen et al. (1978) Biochim. Biophys. Acta 529, 369-3791, A quasi-steady-state approximation of the model suggests that at high [S]/[P] the fraction of active iron(II1) lipoxygenase is small and that, therefore, a lag phase is intrinsic to the mechanism.Lipoxygenases (EC 1.13.1 1.12) catalyze the conversion of lipids containing one or more 1 (2),4(Z)-pentadiene systems and molecular oxygen into hydroperoxides [for reviews see Veldink and Vliegenthart (1984), Schewe et al. (1986), and Kiihn et al. (1986a)I. In animal tissue the lipid hydroper- oxides function as precursors of specific tissue hormones, such as leukotrienes and lipoxins. These compounds play an important role in physiological reactions such as the immune response and inflammatory processes, so that lipoxygenases are of considerable medical interest (Samuelsson et al., 1987; Parker et al., 1987; Spector et al., 1988). The metabolic role of lipoxygenases in plants is still unknown. However, plant lipoxygenases are more suitable for extensive spectroscopic and kinetic investigations than lipoxygenases from animal sources, owing to their abundance in seeds and ease of purification. Over the last 40 years a vast body of data has been collected, particularly on lipoxygenase- 1 from soybean. The presence of one non-heme iron per enzyme molecule has been demonstrated in a number of plant lipoxygenases. Iron valence changes have been extensively studied by EPR measurements on soybean lipoxygenase (De Groot et al., 1975b; Slappendel et al., 1983). The oxidation state is either Fe(I1) or Fe(II1). Lipoxygenase is isolated as an EPR-silent Fe(I1) form, which, in the absence of the fatty acid substrate, is not oxidized by
02.
Lipoxygenases, both from plant and animal sources, share some marked kinetic features. These features include con- tinuing oxidation and reduction reactions after the oxygen has been depleted (the anaerobic reaction) and a lag period at the start of the oxygenation reaction. Addition of the hy- droperoxide product to the reaction mixture results in the disappearance of the lag period (Haining & Axelrod, 1958; Finazzi-Agrb et al., 1973; Veldink et al., 1977b), whereas
M.J.S. is supported by a fellowship under European Community Science Programme Twinning Grant SC1-0197 to G.A.V., J.F.G.V., A.
Finazzi-Agrb, and L. Avigliano.
*
To whom correspondence should be addressed.0006-2960/92/043 1-7692$03.00/0
enzymatic removal of the peroxide from the reaction mixture increases its duration (Smith & Lands, 1972). Furthermore, lipoxygenase has a constant requirement for the hydroper- oxide during turnover (Kiihn et al., 1986b). Therefore, it is assumed that the hydroperoxide product causes oxidation of inactive iron(I1) lipoxygenase into the active Fe(II1) form. However, the observation that the use of the Fe(II1) instead of the Fe(I1) enzyme form to start the reaction does not result in the disappearance of the lag phase (De Groot et al., 1975a) is in apparent contradiction with this assumption.
Kinetic studies on the anaerobic reaction provided strong evidence for a simple double displacement mechanism in which the fatty acid and the hydroperoxide compete for a single binding site on the enzyme (Verhagen et al., 1978a). Studies on the isotope effect in the anaerobic reaction (Verhagen, 1978) provided further evidence that the proposed mecha- nism and the kinetic constants calculated on the basis of this model are correct. The model for the anaerobic reaction has been elaborated by Ludwig et al. (1987) to include the aerobic reaction. Many parameter values reported for reticulocyte lipoxygenase in Ludwig et al. (1987) are, however, very different from the corresponding values in the anaerobic soybean lipoxygenase- 1 reaction.
We undertook a detailed rapid kinetic analysis of the effect of 13-hydroperoxylinoleic acid on linoleic acid oxygenation, catalyzed by soybean lipoxygenase- 1, in order to resolve the following questions: (1) Is there a kinetic difference between iron(I1) and iron(II1) lipoxygenase, and if there is, why was it not detected by De Groot et al. (1975a)? (2) What is the cause of the lag phase? (3) Is a simple reaction mechanism based upon a single lipid binding site sufficient to explain the oxygenation kinetics? (4) How do the kinetic constants estimated for the aerobic reaction of soybean lipoxygenase compare with the corresponding constants in the anaerobic reaction and with those found for reticulocyte lipoxygenase?
Lipoxygenase Kinetics
zyxwvutsrqponmlkjihgfedcbaZYXWVUTSRQPONMLKJIHGFEDCBA
MATERIALS AND METHODSMaterials. Lipoxygenase- 1 was purified from soybeans (Williams, American Quality B) according to Finazzi-Agrb et al. (1973). The preparation showed one band at 100 kDa on SDS-PAGE' with Coomassie Brilliant Blue staining. The enzyme was stored, at a concentration of approximately 1.5
mg/mL, at 4 OC in a 0.05 M sodium acetate buffer, pH
zyxwvutsrqponmlkjihgfedcbaZYXWVUTSRQPONMLKJIHGFEDCBA
5 . 5 ,containing 134 g/L ammonium sulfate.
Linoleic acid
zyxwvutsrqponmlkjihgfedcbaZYXWVUTSRQPONMLKJIHGFEDCBA
[9(2),12(Z)-octadecadienoic acid, 99% Jan-ssen Chimica] was stored at -20 OC as a 300 mM solution in methanol (Merck, gradient grade) under anaerobic conditions. The concentrations of linoleic acid oxidation products present in this solution were estimated to be less than 0.5% of the linoleic acid concentration on the basis of high-performance liquid chromatography.
The compound 13-HPOD [13-hydroperoxy-9(2),1 l(E)- octadecadienoic acid] was prepared by incubation of 200 pg of lipoxygenase- 1 and 50 pmol of linoleic acid for 15 min at 0 OC in 100 mL of 0.1 M sodium borate buffer, pH 10, under constant aeration. The solution was applied to a 6-mL disposable C18 extraction column (J. T. Baker Inc.) and the product eluted with methanol. Residual water was removed by azeotropic evaporation. High-performance liquid chro- matography showed that themain product (95%of the material absorbing at 234 nm) was 13-HPOD. The product was stored at -20 OC at a concentration of 100 mM in methanol (Merck, gradient grade).
Kinetic Measurements. Kinetic measurements were per- formed with a Hi-Tech SF-5 1 stopped-flow spectrophotom- eter at 25 OC. The oxygenation reaction was followed by measuring the concentration of 13-HPOD. The monochro- mator was set at 243 nm, and the path length was 10 mm (the
molar absorption coefficient of HPOD at 243 nm is 17.8
zyxwvutsrqponmlkjihgfedcbaZYXWVUTSRQPONMLKJIHGFEDCBA
Xlo3 Lsmol-l-cm-l). A UG-5 filter (transmission band 230- 400 nm, 45% transmission at 243 nm) was used in order to prevent light of longer wavelengths from entering the detector. In order to avoid effects due to acid soap formation (Ver- hagen et al., 1978b), all measurements were performed in a 0.1 M borate buffer, pH 10 (BB10). The critical micelle concentration is approximately 200 pM under these conditions. Stock linoleate and 13-HPOD solutions were prepared by diluting appropriate amounts of the concentrated methanol solutions into BB10. The stock solutions were prepared freshly before each experiment and kept at 0 OC, for a maximum of 2 h. Shortly before use, the enzyme and linoleate stock solutions were diluted into separate test tubes containing 5
mL of BB10, equilibrated at 25 OC. The final syringe concentrations were 2.4 pg/mL lipoxygenase and 5-170 pM linoleate, giving 1.2 pg/mL and 2.5-85 pM concentrations after stopped-flow mixing. The 13-HPOD was either pre- mixed with the enzyme solution in order to prepare the Fe- (111) enzyme form or added to the linoleate solution.
It was observed that the presence of relatively small amounts (>0.01%, v/v) of methanol or ethanol increases the duration of the lag phase. Complete avoidance of the use of alcohols in the preparation of stock solutions has practical disadvantages: in an aqueous medium lipid hydroperoxides are much less stable and oxidation of polyenoic acids is faster than in pure alcohol. Instead, we chose to keep the methanol in the working solutions at a fixed concentration. The final methanol
Biochemistry, Vol. 31, No. 33, 1992 7693 concentration in the stopped-flow measuring chamber was 0.03% (v/v, i.e., 7.5 mM) for each measurement. Although this methanol concentration has a slight effect on the duration of the lag phase, we have shown in control measurements in which the methanol percentage varied that the qualitative outcome of the experiments is unaffected.
Data Collection and Analysis. The initial stages of the reaction were recorded over 2.5, 5 , or 10 s at 500 points per trace, and three to five traces were averaged to produce the final curve. As a routine procedure the complete reaction was also recorded (over 50 or 100 s, 500 points per trace). Under the conditions used, practically all linoleate is converted into 13-hydroperoxylinoleate after completion of the reaction, so that the initial linoleate concentration may be estimated from the maximum absorbance in the complete curve. In order to calculate the rate from the reaction progress curves, smoothing was performed using the method of Savitzky and Golay (1964), over a span of 20 points (Le., 0.1 s in a 2.5s trace, etc.). This span gives a reasonable smoothing without losing much of the initial part of the curve. The rate of HPOD
formation u
zyxwvutsrqponmlkjihgfedcbaZYXWVUTSRQPONMLKJIHGFEDCBA
at time ti was then calculated using uzyxwvutsrqponmlkjihgfedcbaZYXWVUTSRQPONMLKJIHGFEDCBA
= ([HPODIi-
[HOPD]i-l)/(ti - t i - , ) , where the index i indicates the ithsample.
Numerical Integration. Numerical integration was carried out using the method of Gear (1971) for integration of the set of stiff equations (eqs 1-8) and the BulirschStoer method with Richardson extrapolation (Press et al., 1989) for the quasi-steady-state rate equations (eqs 4-8) combined with eqs 16-19. Fourth-order RungeKutta integrations (Press et al., 1989) gave identical results but were less efficient. RESULTS
Oxidation of Lipoxygenase by 13-HPOD. Oxidation of the native iron(I1) lipoxygenase was performed by addition at 25 OC of the appropriate amount of a concentrated 13- HPOD solution to 5 mL of BBlO containing 24 nM lipoxy- genase (the stopped-flow syringe concentration). The time between the preparation of this solution and the start of the oxygenation reaction was at least 1 min. Incubation of li- poxygenase and 13-HPOD for periods of more than 1 min at 25 OC did not affect the kinetics. Incubation of lipoxygenase and 13-HPOD at higher concentrations (15 pM) at 0 OC for 10 min also did not change the results. Therefore, we concluded that incubation at low concentrations for 1 min at 25 OC was sufficient to attain maximum oxidation.
Effect of the Iron Oxidation State. Figure 1 shows a comparison of curves that are obtained when the oxygenation reaction is started with iron(I1) lipoxygenase (curves 1) and with iron(II1) lipoxygenase (curves 2) at 23 (a) and 86 (b) pM linoleate. Iron(II1) lipoxygenase was obtained by pre- incubation of iron(I1) lipoxygenase with 200 nM 13-HPOD.
The iron(I1) lipoxygenase progress curves both show a lag phase. In the plots of the oxygenation rate vs time (bottom panels) the rates increase until they reach a plateau. The duration of the lag phase decreases gradually when 0.5-20 pM 13-HPOD is added to the reaction mixture: when [13- HPOD] 10 pM at the start of the reaction, the lag phase in the iron(I1) lipoxygenase curves has disappeared completely. The iron(II1) lipoxygenase curves start with a slight burst instead of a lag. The burst is seen more clearly in the rate plots (bottom panels): in the presence of 23 pM linoleate at the start of the reaction, the rate decreases and reaches a plateau after some 1.6 s. At 86 pM linoleate, the shape of the curve is more complicated: after a short but significant burst, in which the oxygenation rate decreases, the rate
I Abbreviations: 13-HPOD, 13-hydroperoxy-9(Z),ll (E)-octadeca-
7694
zyxwvutsrqponmlkjihgfedcbaZYXWVUTSRQPONMLKJIHGFEDCBA
Biochemistry, Vol. 31, No. 33, 19921 - 5 '
zyxwvutsrqponmlkjihgfedcbaZYXWVUTSRQPONMLKJIHGFEDCBA
0
Schilstra et al.
a
I I I I I I I I I
7 , I 7 ,
zyxwvutsrqponmlkjihgfedcbaZYXWVUTSRQPONMLKJIHGFEDCBA
i6
5 5
Y
s 4
9 3
$ 2
I
I 1
0
0 0.8 1.6 2.4
time (s)
- -
I
I
0 2 4 6 a
[image:3.622.340.539.41.327.2] [image:3.622.105.251.45.433.2] [image:3.622.83.265.456.663.2]time (s)
FIGURE 1: Effect of the oxidation state of soybean lipoxygenase-1 (12 nM) on the oxygenation of 23 (a) or 86 (b) pM linoleate at [02]
= 240 pM. Curves: 1, iron(I1) lipoxygenase; 2, iron(II1) lipoxy- genase obtained by preincubation of iron(I1) lipoxygenase with 200 nM 13-HPOD. Panels: top, oxygenation progress curves; bottom, oxygenation rate calculated from the smoothed progress curves (see Materials and Methods).
4
>
1
0
b
I
I I 1 I I I
0 5 10 15 20 25
[i3-HPOD] (nM)
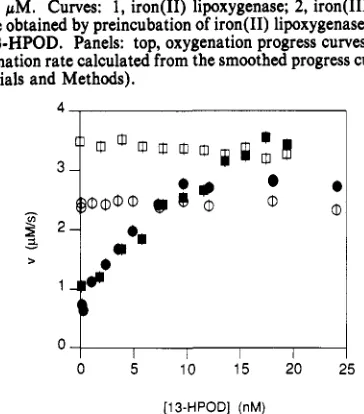
FIGURE 2: Initial rates (closed symbols) and steady-state rates (open symbols) for 23 (circles) and 86 (squares) pM linoleate as a function
of [ 13-HPOD] in the preincubation mixture. [Lipoxygenase] = 12
nM; IO,] = 240 pM. The values of [13-HPOD] were estimated
from the absorbance of concentrated stock solutions and may be subject to systematic errors as large as 20%.
increases again, until it reaches a plateau; the burst is superimposed on a lag phase. Consequently, the plot of rate vs time has a minimum at approximately 0.7 s and reaches
1 - l b I
0 1
I I I I I I I I
0 5 10
time (s)
FIGURE 3: Effect of the linoleate concentration on the oxygenation
rate. Reactions were started with 12 nM iron(I1) (a) or iron(II1)
lipoxygenase (b). [Linoleate]: (a) 1, 17; 2, 29; 3, 43; 4, 54; 5 , 76
pM; and (b) 1, 17; 2,27; 3,38; 4,60; $77 pM. Curves 1,2,3, and
4 have been offset by 4, 3, 2, and 1 pMls, respectively.
a maximum after 4 s. The burst is solely due to the prein- cubation of the enzyme with 13-HPOD: addition of 200 nM 13-HPOD at the same time as the linoleate has virtually no effect. The lag phase in the iron(II1) lipoxygenase curves (at
86 pM linoleate) only disappears when [ 13-HPOD]
>
10 pM at the start of the reaction, as does the lag phase of the iron- (11) lipoxygenase curves.Variation of the 13-HPOD concentration in the preincu- bation mixture from 0 to 20 nM (Figure 2) shows that the initial rate increases from 0.6 f 0.1 to 2.8 f 0.1 pM/s (23 pM linoleate) or 3.7 f 0.1 pM/s (86 pM linoleate). Pre- incubation with higher concentrations of 13-HPOD (20-500 nM) did not increase the initial rate any further. After pre- incubation with 20 nM 13-HPOD or more, the curves show a burst, and the initial rate is therefore higher than the steady- state rate. Steady-state rates were estimated from the point at which the rate became constant.
Effect of Linoleate Concentration. In order to investigate the effect of linoleate concentration on the initial stages of the oxygenation reaction, we recorded the reaction progress curves at various linoleate concentrations. Figure 3a shows the change in the oxygenation rate for iron(I1) lipoxygenase at linoleate concentrations from 17 to 76 pM. All curves have a similar appearance: the oxygenation rate starts at a low level, reaches a maximum within 2.5 s, and then decreases.
A plot of rate vs time for the Fe(II1) enzyme is presented in Figure 3b. The curves have much higher initial values than the corresponding curves in Figure 3a. At linoleate concen- trations smaller than 20 pM, the rates decrease monotonically to zero. At higher linoleate concentrations (20-40 pM), the curves begin to show an inflection point after an initial fast decrease. At linoleate concentrations higher than 50 pM, the curves have a clear minimum at approximately 0.7 s.
Lipoxygenase Kinetics Biochemistry, Vol. 31, No. 33,
zyxwvutsrqponmlkjihgfedcbaZYXWVUTSRQPONMLKJIHGFEDCBA
1992 7695 Scheme I: Lipoxygenase Reaction Mechanism"K'S
zyxwvutsrqponmlkjihgfedcbaZYXWVUTSRQPONMLKJIHGFEDCBA
~4 , 1
[image:4.616.92.260.43.191.2]0
zyxwvutsrqponmlkjihgfedcbaZYXWVUTSRQPONMLKJIHGFEDCBA
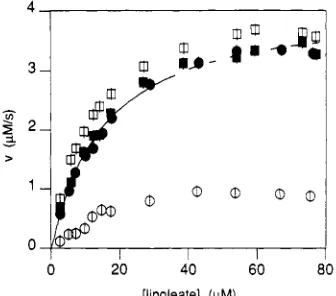
20 40 60 80 [image:4.616.326.538.43.197.2][linoleate] (pM)
FIGURE 4: Dependence of initial and steady-state rates on [linoleate] (no 13-HPOD added at the start of the reaction). [Lipoxygenase] = 12 nM. Initial (open symbols) and steady-state rates (closed symbols) were determined as described in the text. Symbols: circles, reaction started with iron(I1) lipoxygenase; squares, reaction started
with iron(II1) lipoxygenase.
30
,
I0 10 20 30 40
[I3-HPOD] (PM)
"'1
,
,
I b.0
0 10 20 30 40
[13-HPOD] (PM)
FIGURE 5: Effect of 13-HPOD on
zyxwvutsrqponmlkjihgfedcbaZYXWVUTSRQPONMLKJIHGFEDCBA
K, and VmX. Values of K m (a)and V,, (b) were calculated from initial rates in iron(II1) lipoxy- genase progress curves.
and iron(II1) lipoxygenase. Steady-state rates were estimated in the way described above. Curves obtained with the Fe(I1) enzyme show a lag phase at all linoleate concentrations used, and the initial rate is always significantly lower than the steady- state rate. For the Fe(II1) enzyme, the initial rate is higher than the steady-state rate. From a nonlinear least-squares fit (Marquardt, 1963) of the steady-state rates at 2.4-40 pM linoleate to u = Vmax[S]/(Km
+
[SI),
a Km value of 15 f 3 pM was calculated (both enzyme forms). The maximum rateVmX is 4.2 f 0.4 pM f
zyxwvutsrqponmlkjihgfedcbaZYXWVUTSRQPONMLKJIHGFEDCBA
s, corresponding to a turnover rate ofapproximately 350 s - l . Km and V,, estimated from the initial rates [iron(III) lipoxygenase] have the same values within experimental error: 11 f 2 pM and 4.3 f 0.5 pM/s.
We have also estimated the apparent values of Km and Vmax at 13-HPOD (P) concentrations varying from 0 to 35 pM [Fe(III) enzyme formonly]. Figure 5a shows Kmas a function of the 13-HPOD concentration. The value of the product inhibition constant Ki is 24 f 5 pM. Ki was estimated from a linear fit of the apparent values of the Michaelis constant to K m
=
Km,o(l+
[P]/Ki), where Km,0 is the value of K m inI
t
E-(02)-S E-(O2)-Pt
Ip L o 2 I
kl *
Abbreviations: E, iron(I1) lipoxygenase; E*, iron(II1) lipoxygenase; S, fatty acid substrate; P, (hydroperoxy fatty acid) product; S(ox) and
P(red), oxidized and reduced forms of S and P, respectively (radical compounds); K* and K, equilibrium dissociation constants for the Fe-
(111) and Fe(I1) enzyme forms, respectively; k, dissociation rate constants; k', dissociation constant whose value is dependent on [Oz] (see text).
the absence of 13-HPOD. The value of Vmax also appears to
increase slightly with increasing [ 13-HPOD] (Figure 5b).
Modeling the Data. In order to investigate whether the data can be modeled with a simple, single lipid binding site model, numerical integrations were carried out on the basis of the mechanism presented in Scheme I.
In this mechanism, oxygen ( 0 2 ) and linoleate
(S)
bind to iron(II1) lipoxygenase (E*) in random order. In the first redox step, hydrogen abstraction fromS
produces E-(02)- S(ox) at rate kl. E indicates iron(I1) lipoxygenase; S(ox) is a radical compound. The parantheses around 0 2 indicate anequilibrium distribution of the enzyme species and its oxygen complex.
In the second redox step, 0 2 is reduced and iron oxidized, the hydroperoxide P is formed, and the enzyme reequilibrates with 02. These events are combined in k'z: the prime indicates an oxygen dependence (see below). Egmond et al. (1976) demonstrated that hydrogen abstraction is the rate-limiting step at [02] = 240 pM; Le., k'2
>>
kl. S and P bind to the same site on E*.Alternatively, the radical S(ox) may dissociate from the enzyme before the second redox step has occurred, leaving the Fe(I1) enzyme. This species may then bind
S
orP
(competing for the same binding site), and E-(Oz)-P un- dergoes oxidation-reduction to E*-(Oz)-P(red) at rate k4. Because of the short lifetimes of the radical compounds S(ox) and P(red) in solution, dissociation of the enzyme-radical complexes is irreversible.
7696 Biochemistry, Vol.
zyxwvutsrqponmlkjihgfedcbaZYXWVUTSRQPONMLKJIHGFEDCBA
31, No.zyxwvutsrqponmlkjihgfedcbaZYXWVUTSRQPONMLKJIHGFEDCBA
33,zyxwvutsrqponmlkjihgfedcbaZYXWVUTSRQPONMLKJIHGFEDCBA
1992Scheme I then corresponds to the set of rate equations (eqs 1-8) that were derived as described in detail in Ludwig et al. (1987):
del/dt = f 2 1 e 2 + f 3 1 e 3
zyxwvutsrqponmlkjihgfedcbaZYXWVUTSRQPONMLKJIHGFEDCBA
- f13e1 (1)= f 3 2 e 3 - f 2 1 e 2 (2)
= f 1 3 e l
-
v 3 1 + f 3 2 l e 3 (3)d[S1/dt p-f13el (4)
d[P1/dt = f 3 1 e 3 -f21e2 ( 5 )
d[021/dt = -f31e3 (6)
d[S(ox)l/dt =f31e3 (7)
d[P(red)l l d t = f 2 F 2 ( 8 ) where
e, = [E*-(02)]
+
[E*-(02)S]+
[E*-(02)-Pl (9) e2 = [E-(02)1+
[E-(02)*1+ [E402)4'1
(10) e3 = [E-(0,)-S(ox)] (1 1)Schilstra et al.
and
(12) [SI /K*,
f13 = k l l
+
[S]/K*,+
[P]/K*,(13) [PI /Kp
f21 = k41
+
[S]/K,+
[Pl/Kp= k < (14)
f32 = k3 (15)
1 f31 = k2Ko/[02]
+
1The rate equations were integrated numerically with kl =
[image:5.621.332.542.44.334.2]350 s-1 (see the section Kinetic Constants), k4 = 150 s-l [from Verhagen et al. (1978a)], K*, = K*p = 20 pM (based on the values of Km for linoleate and Ki for 13-HPOD; see the section Kinetic Constants), and KO = 0.1 mM [from Egmond et al. (1976); see Discussion). The values for K, and Kp under aerobic conditions and for k2 and k3 had to be estimated. They appear to be strongly correlated.
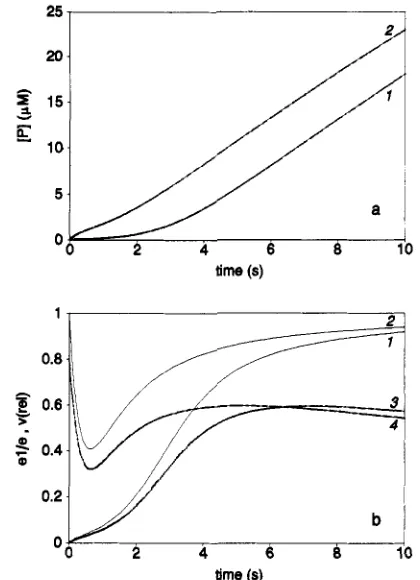
Figure 6a shows the results of the integrations with K, =
Kp = 20 pM, k2 = 1.5 X
zyxwvutsrqponmlkjihgfedcbaZYXWVUTSRQPONMLKJIHGFEDCBA
106, and k3 = 1.0 X lo4 for startingconcentrations [SI = 85 pM, [PI = 84 nM, and [02] = 240 pM. Curve 1, the result of a simulation started with Fe(I1) enzyme (e2) at 12 nM, has a lag phase. Curve 2, initiated with 12 nM Fe(II1) enzyme (el), shows a burst followed by a lag phase. Similar curves are obtained in simulations in which the ratio of K,/Kp to k2/k3 is kept constant; increasing K,/Kp or decreasing k2/k3 results in more pronounced burst and lag phases.
Figure 6b shows that the burst is associated with a rapid initial decrease in el/e, the fraction of iron(II1) lipoxygenase
(e is the total enzyme concentration). After some 0.5 s this fraction begins to increase again. The oxygenation rate, which is strongly dependent on the fraction of iron(II1) lipoxyge- nase, displays a similar pattern of behavior. Lowering the starting concentration of
S
results in el curves with a higher minimum, and the inflection point in the rate plots gradually disappears (cf. Figure 3). Increasing thestarting concentration of P causes the disappearance of the lag phase in both the Fe(I1) and Fe(II1) enzyme curves. The experimental results are reproduced very well: at [PI = 8 pM at the start of the simulation, the initial rate reaches its maximum. The results presented in Figure 2 can be reproduced by changing the25
,
8 I
O O K ' 4 6 10 time (s)
time (s)
FIGURE 6: Integrated rate equations corresponding to the mecha-
nism presented in Scheme I at initial concentrations: [SI = 85 pM;
[PI = 85 nM; [Oz] = 240 pM. Parameter values:
zyxwvutsrqponmlkjihgfedcbaZYXWVUTSRQPONMLKJIHGFEDCBA
P,
= KSp = K,= Kp = 20 mM; KO = 100 pM; k l = 350 s-I; k2/k3 = 150; k4 = 150
s-l. Curves: 1 and 3, integration started with Fe(I1) enzyme (e2 = 12 nM); 2 and 4, integration started with Fe(II1) enzyme (el = 12 nM). Panels: a, [PI as a function of time; b, fraction of Fe(II1) enzyme ( e l l e , curves 1 and 2) and oxygenation rate relative to kl [u(rel), curves 3 and 41 as a function of time.
starting concentrations of iron(I1) and iron(II1) lipoxygenase in the simulation.
Steady-State Approximation of the Model. By solving the simultaneous rate equations (eqs 1-3) for de,/dt = 0 (n
= 1-3), using the method of King and Altman (1956), the steady-state distribution of the enzyme species e, at given (constant) concentrations of
S,
P, and 0 2 can be calculated:el ef21v21 +f32)lD (16)
e2 = ef1J32ID (17)
e3 = ef2Lf13/D (18)
where
When k'z and k3 are both much larger than kl, thecomplex E-(O~)S(OX) (e3) comprises only a very small fraction of the total enzyme concentration and may be neglected. The following expression for the fraction of iron(II1) lipoxygen- ase, el/e, is obtained:
in which
Kp(l
+ [s]/K,)
+
[PI
K*,(l
+
[P]/K*,)+
[SIa =
[image:5.621.55.301.70.422.2]Lipoxygenase Kinetics Biochemistry, Vol. 31, No. 33, 1992 7697 1 and 2 [integrations started with iron(I1) and iron(II1) li-
poxygenase, respectively] coincide at [PI
>
zyxwvutsrqponmlkjihgfedcbaZYXWVUTSRQPONMLKJIHGFEDCBA
2.5 pM. In otherwords, from [PI = 2.5
zyxwvutsrqponmlkjihgfedcbaZYXWVUTSRQPONMLKJIHGFEDCBA
pM onward, the distribution of activeand inactive enzyme species is equal in both simulations. The maximum rate, however, is only reached at [PI = 10 pM. When the experimental data from Figure l b are replotted as a function of the 13-HPOD concentration (Figure 7b), the same relaxation of curve 2 [iron(III) lipoxygenase] toward curve 1 [iron(II) lipoxygenase] is seen. Concurrence of the curves occurs from [13-HPOD] = 2 pM onward.
Integration of the rate equations based upon the steady- state approach of the mechanism (eqs 16-19) yields curve 3, plotted in Figure 7a. The plot shows that the steady-state
treatment is slightly inaccurate below [PI = 5
zyxwvutsrqponmlkjihgfedcbaZYXWVUTSRQPONMLKJIHGFEDCBA
pM. However,when the integration of the basic rate equations is carried out at e = 1.2 nM, instead of 12 nM, and the results are plotted in the same way, the curve for the Fe(I1) enzyme form (curve 1) practically coincides with the steady-state curve (curve 3, unchanged). Moreover, the curve for the Fe(II1) enzyme (curve 2) form coincides with curve 1 and thus with curve 3 from [PI = 0.25 pM onward.
DISCUSSION
The effect of 13-HPOD on the oxygenation of linoleic acid at 25 OC, pH 10, and 240 pM 0 2 , catalyzed by 12 nM soybean
lipoxygenase- 1, has been investigated with rapid kinetic techniques.
In oxygenation reactions started with iron(I1) lipoxygen- ase, the progress curves show a lag period. Reactions started with iron(II1) lipoxygenase show a burst rather than a lag phase at low linoleate concentrations. These results clearly demonstrate that iron(I1) and iron(II1) lipoxygenase are
kinetically different. At higher linoleate concentrations (>50
zyxwvutsrqponmlkjihgfedcbaZYXWVUTSRQPONMLKJIHGFEDCBA
pM), the curves for the Fe(II1) enzyme form still start with a burst, but this burst appears to be superimposed on a lag phase. Thus “activation” of the enzyme by oxidation is not sufficient to abolish the lag. The lag period can only be reduced by micromolar amounts of 13-HPOD added at the start of the reaction, in the case of both iron(I1) and iron(II1) lipoxyge- nase.
Numerical simulations show that the observations are consistent with a simple, single lipid binding site mechanism. This model is based on the mechanism for the anaerobic li- poxygenase reaction (Verhagen et al., 1978a) and is very similar to the model proposed for reticulocyte lipoxygenase by Ludwig et al. (1987). In the model, formation of the hy- droperoxide occurs in two steps: hydrogen abstraction from the lipid substrate S [formation of S(ox), concomitant with Fe(II1) reduction] and oxygenation of S(ox) [formation of the hydroperoxide P and Fe(I1) oxidation]. Sometimes S(ox), a radical compound, dissociates before the second step has occurred and leaves iron(I1) lipoxygenase. Iron(I1) lipoxy- genase must be oxidized to the Fe(II1) form by P before it can again take part in the oxygenation cycle. When [PI is small, regeneration is slow, and therefore the fraction of inactive iron(I1) lipoxygenase is relatively high. Obviously, when the reaction starts with iron(I1) lipoxygenase, formation of P is very slow at the beginning of the reaction. But even when the oxygenation reaction starts with iron(II1) lipoxygenase, which produces P at a high rate, the amount of P formed in the initial stages of the reaction may not be sufficient to maintain the high fraction of active enzyme, and the reaction rate decreases. As P accumulates during the reaction, regeneration occurs more rapidly, and the fraction of active enzyme as well as the oxygenation rate increases. While the oxygenation is
T
Ib l
3 6 9 12
[image:6.617.75.279.39.329.2][13-HWDl (PM)
FIGURE 7: (a) Curves 1 and 2: integrated rate equations of Figure
8. Theoxygenationrateu wasplottedas afunctionof [P];integration was started with 12 nM Fe(I1) enzyme (curve 1) or 12 nM Fe(II1) enzyme (curve 2). Curve 3: integrated rate equations based on the steady-state approximation of the mechanism. (b) Experimental oxygenation rates at [linoleate] = 86 FM from Figure lb, replotted as a function of [13-HPOD]. Reactions were started with 12 nM iron(I1) lipoxygenase (curve 1) or 12 nM iron(II1) lipoxygenase (curve
2).
strongly dependent on the ratio of [S]/[P]. In the absence of hydroperoxide, e.g., after enzymatic removal [cf. Smith and Lands (1 972)], the fraction of active enzyme is zero. At high [S]/[P], e.g., under the conditions present at the start of the reaction, the steady-state fraction of active enzyme is low. When the concentrations of P and S are of the same order of magnitude, the fraction of active enzyme is higher and approaches 1 at low a[S]/[P]. The factor a is, within certain limits, also modulated by the ratio [SI/ [PI. When all lipid binding constants have equal values, as in the numerical simulations,a = (kl/k4)/(k’z/k3
+
1). Equation 21 indicates a strong correlation between the values of k‘z/k3 and K,/K,. This correlation was also observed in the numerical integration of the basic rate equations (see above).The steady-state oxygenation rate u equals
)
(22)[SI
K*,(l
+
[P]/K*,)+
[SI [PI+
a[SIU =
The expression for the oxygenation rate thus consists of a maximumrate factor [V,, = kle/(k3/k’z
+
l)], a “Michaelis- Menten” factor with competitive product inhibition, and a factor related to the distribution of active and inactive enzyme. Owing to this distribution factor the reaction proceeds slowly at high [S]/[P], but the rate increases when P accumulates. This means that, even in the steady-state approximation, the model predicts a lag period.7698
zyxwvutsrqponmlkjihgfedcbaZYXWVUTSRQPONMLKJIHGFEDCBA
Biochemistry, Vol. 31, No. 33,zyxwvutsrqponmlkjihgfedcbaZYXWVUTSRQPONMLKJIHGFEDCBA
1992 inhibited by P itself, regeneration of the active enzyme formis inhibited by
S,
zyxwvutsrqponmlkjihgfedcbaZYXWVUTSRQPONMLKJIHGFEDCBA
becauseS
and P compete for the same bindingsite on both enzyme forms. The lag period is thus due to a high [S]/[P] ratio, which results in a low concentration of active enzyme, rather than to a low concentration of iron(I1) lipoxygenase itself. Therefore, under certain conditions a lag phase is observed in reactions started with iron(II1) lipoxy- genase.
A steady-state treatment of the model yields an analytical expression for the distribution of active and inactive enzyme as a function of [SI and [PI. A comparison of the results of the numerical integrations of the basic rate equations with those of the steady-state rate equations shows that the steady-
state approximation is slightly inaccurate at [PI
zyxwvutsrqponmlkjihgfedcbaZYXWVUTSRQPONMLKJIHGFEDCBA
<
5 pM andan enzyme concentration of 12 nM. However, thecalculations predict that at lower enzyme concentrations the steady-state approximation will be accurate over a larger range of [PI: the burst phase in the Fe(II1) enzyme curves and the lag period in the Fe(I1) enzyme curves will both become shorter. When the enzyme concentration is of the order of 1 nM, the iron(I1) and iron(II1) lipoxygenase curves will be very similar, but both curves will still show the lag phase predicted by the steady- state rate equations. This was indeed observed in preliminary experiments. De Groot et al. (1975a), who did not detect a kinetic difference between iron(I1) and iron(II1) lipoxygen- ase, performed their experiments at an enzyme concentration of 2 nM and linoleate concentrations of 240 and 480 pM. Under these conditions the lag period is large for both enzyme forms, whereas the burst phase in the iron(II1) lipoxygenase curve is very short and can only be detected using rapid mixing techniques.
Comparison with Other Models. Early models of lipoxy- genase catalysis all include more than one lipid binding site on lipoxygenase to explain the nonlinear kinetics (Smith & Lands, 1972; Gibian & Galaway, 1976; Lagocki et al., 1976; Egmond et al., 1976, 1977). A weakness of each of these models is that they do not include an anaerobic reaction (Ver- hagen et al., 1978a) and cannot therefore account for all observations.
In contrast, the model proposed by Ludwig et al. (1 987) for reticulocyte lipoxygenase is based on the mechanism for the anaerobic reaction. The authors assume that linoleic acid and oxygen bind in compulsory order. This implies that S(ox) cannot dissociate once the complex E-O~-S(OX) is formed. On the basis of Ludwig’s and our data it is impossible to discriminate between a random- and a compulsory-order model (in a compulsory-order model “k3” is dependent on [02]). Because magnetic susceptibility measurements have not provided evidence that the iron center is involved in the binding of oxygen (Petersson et al., 1985; Feiters et al., 1985), and oxygen binding is thus not necessarily restricted to the Fe(I1) enzyme form, we have adopted the more general random- order model.
Kinetic Constants: Comparison to Earlier Values. The values of the hydrogen abstraction rate kl and the Michaelis constant for linoleate Km reported in this paper agree well with previous values found for soybean lipoxygenase- 1 under aerobic conditions: 290-350 for kl (Egmond et al., 1976; Verhagen et al., 1978a) and 15-25 for Km (Gibian & Gal- away, 1976; Lagocki et al., 1976; Egmond et al., 1976).
In reticulocyte lipoxygenase hydrogen abstraction is sig-
nificantly slower (1 2 s-l),
zyxwvutsrqponmlkjihgfedcbaZYXWVUTSRQPONMLKJIHGFEDCBA
but the values of Km and the productinhibition constant Ki (6 and 25 pM, respectively) are similar to those of soybean lipoxygenase- 1 (reticulocyte values are calculated from Figure 3 in Ludwig et al. (1987). As we have
Schilstra et al. shown above, the values for K,, Kp, k2lk3, and k4 (see Results) are highly correlated and cannot be estimated without a pri- ori knowledge of their approximate values. Therefore, the values of these parameters reported in Ludwig et al. (1987) have little significance.
The equilibrium dissociation constants for the iron(II1) li- poxygenase complexes with linoleate and 13-HPOD, K*, and K*,, reported for the anaerobic reaction of soybean lipoxy- genase-1 at 25 OC, pH 10 (Verhagen et al., 1978a), are 163 and 153 pM, respectively, i.e., 1 order of magnitude larger than the corresponding constants in the presence of 0 2 , Km,
and Ki. A possible explanation is that oxygen is an allosteric effector. Calculations based on the model presented above, combined with data on soybean lipoxygenase- 1 steady-state kinetics (Egmond et al., 1976), indicate that the substrate oxygen dissociation constant is ca. 100 pM (unpublished results). This means that at 5 and 240 pM 02, respectively, approximately 5% and 70% of the enzyme is complexed with substrate oxygen. On the other hand, the data only fit a model in which the dissociation constant for linoleate is constant for
5 pM
<
[02]<
240 pM, Le., is not a combination of a low dissociation constant for the enzymelinoleate-oxygen com- plex and a high one for the complex without oxygen. The implication is that i f 0 2 is an allosteric effector, lipoxygenasemust have a second oxygen binding site with a dissociation constant below 1 pM. Further investigations on the lipid binding constants under aerobic and anaerobic conditions are underway.
ACKNOWLEDGMENT
We thank Dr. S. R. Martin (National Institute for Medical Research, London) for critically reading the manuscript, Dr. N. C. Millar (King’s College, London) for providing the simulation program KSIM (Runge-Kutta and Gear methods for numerical integration), and Prof. Dr. A. Finazzi-Agrb (Universita “Tor Vergata”, Rome) for stimulating discus- sions.
REFERENCES
De Groot, J. J. M. C., Garssen, G. J., VeIdink, G. A,, Vliegent- hart, J. F. G., Boldingh, J., & Egmond, M. R. (1 975a) FEBS Lett. 56, 50-54.
De Groot, J. J. M. C., Veldink, G. A., Vliegenthart, J. F. G., Boldingh, J., Wever, R., & Van Gelder, B. F. (1975b) Bio- chim. Biophys. Acta 377, 71-79.
Egmond, M. R., Vliegenthart, J. F. G., & Boldingh, J. (1973) Biochem. Biophys. Res. Commun. 48, 1055-1060.
Egmond, M. R., Brunori, M., & Fasella, P. M. (1976) Eur. J.
zyxwvutsrqponmlkjihgfedcbaZYXWVUTSRQPONMLKJIHGFEDCBA
Biochem. 61, 93-100.
Egmond, M. R., Fasella, P. M., Veldink, G. A., Vliegenthart, J. F. G., & Boldingh, J. (1977) Eur. J. Biochem. 76, 469-479. Feiters, M. C., Aasa, R., Malmstrbm, B. G., Slappendel, S.,
Veldink, G. A., & Vliegenthart, J. F. G. (1985) Biochim. Bio- phys. Acta 831, 302-305.
Finazzi-Agrb, A., Avigliano, L., Veldink, G. A., Vliegenthart, J.
F. G., & Boldingh, J. (1973) Biochim. Biophys. Acta 326, 462470.
Gear, C. W. (1971) Commun. ACM 14, 176-190.
Gibian, M. J., & Galaway, R. A. (1976) Biochemistry 15,4209- 4214.
Haining, J. L., & Axelrod, B. (1958) J . Biol. Chem. 232, 193- 202.
King, E. L., & Altman, C. (1956) J. Phys. Chem. 60, 1375- 1378.
Kiihn, H., Schewe, T., & Rapport, S. M. (1986a) Adv. En-
zymol. Relat. Areas Mol. Biol.
zyxwvutsrqponmlkjihgfedcbaZYXWVUTSRQPONMLKJIHGFEDCBA
53, 273-3 11.Lipoxygenase Kinetics
Lagocki, J. W., Emken, E. A., Law, J. H.,
zyxwvutsrqponmlkjihgfedcbaZYXWVUTSRQPONMLKJIHGFEDCBA
& Kezdy, F.zyxwvutsrqponmlkjihgfedcbaZYXWVUTSRQPONMLKJIHGFEDCBA
(1976)J. Biol. Chem.
zyxwvutsrqponmlkjihgfedcbaZYXWVUTSRQPONMLKJIHGFEDCBA
254,6001-6006.Ludwig, P., Holzhiitter, H.-G., Colosimo, A,, Silvestrini, M. C., Schewe, T., & Rapoport, S. M. (1987) Eur. J. Biochem. 168, Marquardt,D. W. (1963) J.Soc. Ind. Appl.Math. 2,431-441. Parker, C. W. (1987) Annu. Rev. Immunol. 5, 65-84.
Petersson, L., Slappendel,
zyxwvutsrqponmlkjihgfedcbaZYXWVUTSRQPONMLKJIHGFEDCBA
S., & Vliegenthart, J. (1985) Bio-chim. Biophys. Acta 828, 81-85.
Press, W. H., Flannery, B. P., Teucholsky,
S.
A., & Vetterling, W. T. (1989) in Numerical Recipes, The Art of Scientific Computing, pp 55 1-568, Cambridge University Press, Cam- bridge, U.K.Samuelsson, B., Dahlen,
S.
E., Lindgren, S. E., Rouzer, C. A.,& Serhan, C. N. (1987) Science 237, 171-176.
Savitzky, A., & Golay, M. J. E. (1964) Anal. Chem. 36, 1627- 1639.
Schewe, T., Rapport,
S.
M., & Kiihn, H. (1986) Adu. Enzymol. Relat. Areas Mol. Biol. 58, 191-272.Slappendel, S., Veldink, G. A., Vliegenthart, J. F. G., Aasa, R.,
& Malmstr6m, B. G. (1983) Biochim. Biophys. Acta 747, 325-337.
32-36.
Biochemistry, Vol. 31, No. 33, 1992 7699 Smith, W. L., & Lands, W. E. M. (1972) J. Biol. Chem. 247, Spector, A. A., Gordon, J. A., & Moore,
S.
A. (1988) Prog. LipidRes. 27, 271-323.
Tappel, A. L., Boyer, P. D., & Lundberg, W. 0. (1952) J. Biol. Chem. 199,267-28 1.
Veldink, G. A., & Vliegenthart, J. F. G. (1984) in Advances in Inorganic Biochemistry (Eichhorn, G. L., & Marzili, L. G. Us.) Vol. VI, pp 139-161, Elsevier, Amsterdam.
Veldink, G. A., Garssen, G. J., Slappendel,
S.,
Vliegenthart, J. F. G., & Boldingh, J. (1977a) Biochem. Biophys. Res. Com- mun. 78, 424-428.Veldink, G. A., Vliegenthart, J. F. G., & Bolding, J. (1977b) Prog. Chem. Fats Other Lipids 15, 131-166.
Verhagen, J. (1 978) The Conversion of 9 - ~ - and 13-~-Hydro- peroxy-Linoleic Acid by Soybean Lipoxygenase- 1 , Ph.D. Thesis, State University of Utrecht, The Netherlands, pp 37-
40.
Verhagen, J., Veldink, G. A., Egmond, M. R., Vliegenthart, J. F. G., Boldingh, J., & Van der Star, J. (1978a) Biochim. Bio- Verhagen, J., Vliegenthart, J. F. G., & Boldingh, J. (1978b)
1038-1047.
![FIGURE (PM) oxygenation rates at [linoleate] iron(I1) lipoxygenase (curve was started with 12 as a function of [13-HPOD]](https://thumb-ap.123doks.com/thumbv2/123dok/614268.163854/6.617.75.279.39.329/figure-oxygenation-rates-linoleate-lipoxygenase-curve-started-function.webp)
