Optimisation of UV/H
2O
2Treatment of Monoethanolamine Using the Taguchi Method of
Experimental Design
Idzham F M Ariff
1*, Putri N F Megat Khamaruddin
2, Sabtanti Harimurti
2, Binay K
Dutta
21
Novel Process & Advanced Engineering, PETRONAS Research Sdn. Bhd., 43000 Kajang,
Selangor, Malaysia
2
Department of Chemical Engineering, Universiti Teknologi PETRONAS, 31750 Tronoh,
Perak, Malaysia
*
Corresponding author. Phone: +603 8928 1000, Fax: +603 8925 8875
Email: [email protected]
ABSTRACT
Monoethanolamine (MEA) is commonly used in gas treating applications for scrubbing of acid gases and occasionally generated as a waste material with a high organic content. In this paper, the degradation of MEA solution in a UV/H2O2 advanced oxidation process (AOP) was investigated using a completely-mixed batch
photo-reactor. The methodology of design of experiment using the Taguchi approach was applied to determine the optimum conditions and influence of various factors for efficient reduction of the chemical oxygen demand (COD) of the MEA solution under UV/H2O2 treatment for 60 minutes. Four factors at four levels were selected for the
experimental design. The factors that were identified are UV dose, initial H2O2 dose, initial solution pH and
temperature. The results indicated that UV dose and pH were the factors that had the strongest influence on the COD removal efficiency, although the effect of UV dose was much larger compared to other factors. COD reduction achieved in validation experiments conducted at the optimum conditions were compared with the results predicted by the Taguchi design of experiment methodology. The optimum process conditions for degradation of MEA were identified.
Keywords: Experimental design, monoethanolamine, optimization, Taguchi, UV, UV/H2O2.
1. INTRODUCTION
Acid gases, namely H2S and CO2 are commonly removed from the natural gas in a process called gas
sweetening by absorption with aqueous alkanolamines such as monoethanolamine (MEA). In the process, wastewater containing amine is routinely generated during periodic maintenance, cleaning and vessel safety inspections. Which are generally not amenable to conventional biological oxidation methods due to the extremely high organic content and general biological recalcitrance.
Advanced oxidation process (AOP) is a promising method to oxidize and degrade organic compounds in water. AOP is based on generation of highly reactive hydroxyl (•OH) radicals at ambient conditions. The oxidizing power of •OH radicals (E0 = 2.87 V) is second only to fluorine (Zhang et al, 2006)0. The hydroxyl radical second-order
rate constants for most organic pollutants is in the order of 108 – 109 L/mole•s, which are 3 – 4 orders of magnitude greater than other oxidants (Crittenden et al, 2005). A number of researchers have shown the effectiveness of AOP as a pretreatment step to biological oxidation (Chamarro et al, 2001; Fongsatitkul et al; 2004, Tekin et al, 2006). One commonly used AOP is the UV/H2O2 process, in which •OH radicals are formed according to equation (1) via
homolytic cleavage of H2O2 using UV radiation 0 et al, 1999).
H2O2 + hν→ 2 •OH (1)
Reaction (2) describes the global reaction for total mineralization of MEA in reaction with H2O2 which
indicates that 6.5 moles of H2O2 are required stoichiometrically to completely mineralize 1 mole of MEA.
2C2H7NO + 13H2O2→ 4CO2 + N2 +20H2O (2)
proposing a special set of orthogonal arrays that standardized fractional factorial designs. The Taguchi approach is now used extensively in industry and scientific research (Roy, 2001).
The objective of this work is to use the Taguchi approach to DOE to study the effects of factors on the MEA degradation using UV/H2O2 advanced oxidation process. Only one previous study has been found using the Taguchi
approach in advanced oxidation studies in which the degradation of tetrahydrofuran using UV/H2O2 was studied by
Chidambara Raj and Quen (2005)0.
2. MATERIALS AND METHODS 2.1 Statistical design
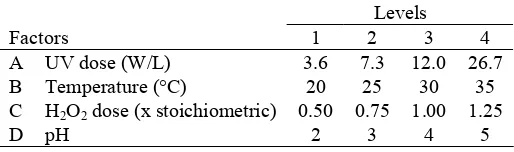
The L-16 (45) modified orthogonal array was used which can accommodate a maximum of five factors at four levels for with a total of 16 experimental runs. For this study, only four factors with were selected as shown in Table 1. One column of the orthogonal array was left unused to enable enough degrees of freedom for quantitative determination of the error term in analysis of variance (ANOVA) calculations. Since chemical oxygen demand (COD) gives a practical estimate of the presence of organics in wastewater, we used this parameter as a measure of the degree of degradation of the substrate (MEA). The response of the experiments was given by the fractional COD reduction calculated from the COD after 60 minutes of reaction compared to the initial COD. The quality characteristic for the response is determined to be bigger-the-better.
Table 1
Factors and levels used in the experimental study
Levels
Monoethanolamine (MEA) was obtained from Fisher Chemical. Aqueous solution of MEA was prepared by adding distilled water to a known quantity of pure MEA in a volumetric flask. H2O2 solution (30%) was also
obtained from Fisher Chemical. Based on the quantity of H2O2 solution required in the experiment, the MEA
solution was prepared so that the MEA concentration in the MEA/H2O2 solution mixture was 1000 mg/l.
2.3 Experimental setup
Two sizes of photoreactors were used in the experiments. The first reactor is a cylindrical, jacketed glass photoreactor, with a working volume of 1.1 L that can be fitted with up to 3 low-pressure, mercury vapor UV lamps with input power rating of 4 W each placed in quartz tubes. A mercury thermometer was inserted in the reactor to monitor solution temperature. The second reactor is similar but with a smaller working volume of 300 mL. This reactor can be fitted with 1 larger UV lamp with input power rating of 8 W. The UV dose was varied by using either the high-volume reactor with 1 (3.6 W/L based on input power), 2 (7.3 W/L) or 3 (12.0 W/L) UV lamps or by using the small-volume reactor (26.7 W/L). The initial solution pH was adjusted by adding sulfuric acid. H2O2 at 30 %
w/v was added in a specific amount depending based on equation (2). The solution temperature was maintained using a circulating water bath. Samples were taken periodically during the reaction to determine the COD concentration at various times during the course of the reaction.
2.4 Analysis
The chemical oxygen demand (COD) of the solution was measured using dichromate digestion method using a block reactor and spectrophotometer (HACH model DR 5000). Prior to COD analysis, the residual H2O2 were
3. RESULTS AND DISCUSSION
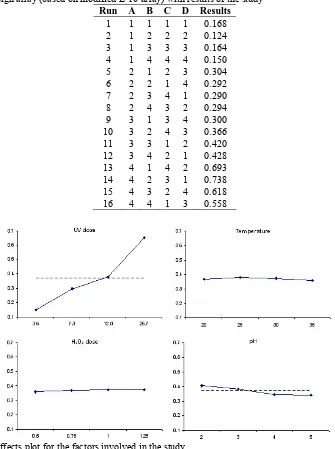
The design orthogonal array used in this study and the experimental results are tabulated in Table 2 below. Figure 2 shows the main effects plots for the results obtained in the study. The main effects plot provides a quick graphical representation of the average effect of each factor to the response. From the main effects plots, it is clear that the UV dose has the highest effect on the COD reduction compared to other factors studied, as indicated by the large slope of the plot for UV dose. As expected, the COD reduction increased significantly as the UV dose is increased. Surprisingly, temperature and H2O2 dose do not seem to have any appreciable effect on the COD
reduction as would have been expected. The main effects plots also indicate that on average, reducing the pH from 5 to 2 increases the COD reduction to a small extent.
Table 2
Experimental design array (based on modified L-16 array) with results of the study
Run A B C D Results
1 1 1 1 1 0.168 2 1 2 2 2 0.124 3 1 3 3 3 0.164 4 1 4 4 4 0.150 5 2 1 2 3 0.304 6 2 2 1 4 0.292 7 2 3 4 1 0.290 8 2 4 3 2 0.294 9 3 1 3 4 0.300 10 3 2 4 3 0.366 11 3 3 1 2 0.420 12 3 4 2 1 0.428 13 4 1 4 2 0.693 14 4 2 3 1 0.738 15 4 3 2 4 0.618 16 4 4 1 3 0.558
Figure 1 Main effects plot for the factors involved in the study.
average of the response. Based on this, the predicted COD reduction at the optimum condition is 0.705. The confidence interval for the predicted response can be calculated upon conducting the analysis of variance.
Table 3
Average response table showing optimum levels, factor contributions and rank.
Level UV dose Temperature H2O2 dose pH
Contribution 0.282 0.011 0.006 0.037
Rank 1 3 4 2
Analysis of variance results are shown in Table 4. The last column of the ANOVA table shows the relative percentage influence of each factor. The results clearly indicate that, at more than 91% relative percentage influence the UV dose has by far the greatest effect on the response compared to any other factors. The results also show that the effect of experimental errors, factors not included and uncontrollable factors, which comprise the error term, occupy the rest of the effect to the response at almost 9%. The relative influence of other factors including pH is negligible compared to UV dose and the error term.
The confidence interval (C.I.) at the optimum conditions can be calculated based on the required confidence level, the variance of the error term and the degree of freedom values (Roy, 2001)0. At 90% confidence level, the C.I. is computed to be ± 0.13. This means that the optimum response of fractional COD reduction is given by 0.705 ± 0.13 with 90% confidence level.
Table 4
Analysis of variance results for the study
Factor DOF Sum of Sqrs Variance F Ratio Pure Sum Percent
(f) (S) (V) (F) (S') P (%)
UV dose 3 0.5309 0.1770 29.886 0.513 91.36 Temperature 3 0.0011 0.0004 0.062 0.000 0.00 H2O2 dose 3 0.0006 0.0002 0.033 0.000 0.00
pH 3 0.0113 0.0038 0.637 0.000 0.00
Other/Error 3 0.0178 0.0059 8.64
Total 15 0.5617 100.00
A confirmation experiment was then conducted at the optimum conditions. At 60 minutes, the fractional COD reduction for the confirmation experiment is equal to 0.636, which is within the range of the predicted optimum response of 0.705 ± 0.13. This result confirms that the Taguchi analysis conducted in this study was sound and can provide a reasonably accurate prediction of the optimum response as well as a good measurement of the effects of the factors studied.
4. CONCLUSION
The effect of each factor and optimum conditions for degradation of MEA in UV/ H2O2 system has been
Because other factors such as H2O2 dose, pH and temperature seem to have very minimal impact, those factors
could be set at a more cost-effective level and still achieve appreciable COD reduction, especially if the process is scaled-up. For example, a scaled-up process could be run at lower H2O2 dosing, minimal pH adjustment and
minimal cooling to minimize the chemical and energy cost but still achieve good COD reduction.
5. ACKNOWLEDGEMENTS
The support of Universiti Teknologi PETRONAS and PETRONAS Research Sdn. Bhd. in the research project is gratefully acknowledged.
6. REFERENCES
Andreozzi, R., Caprio, V., Insola, A. & Marotta, R. (1999). Advanced oxidation processes (AOP) for water purification and recovery. Catalysis Today, 53: 51-59.
Chamarro, E., Marco, A. & Esplugas, S. (2001). Use of Fenton Reagent to Improve Organic Chemical Biodegradability. Water Research, 35 (4): 1047 – 1051.
Chidambara, Raj C. B. & Quen, H. L. (2005). Advanced oxidation processes for wastewater treatment: Optimization of UV/H2O2 process through a statistical technique. Chemical Engineering Science, 60: 5305 – 5311.
Crittenden J et al. (2005). Water Treatment Principles and Design, MWH, 2nd Ed., pg 583.
Fongsatitkul, P., Elefsiniotis, P., Yamasmit, A. & Yamasmit, N. (2004). Use of Sequencing Batch Reactors and Fenton’s Reagent to Treat a Wastewater from Textile Industry. Biochemical Engineering Journal, 21: 213 – 220.
Roy, R. K. (2001). Design of experiments using the Taguchi approach: 16 steps to product and process improvement, pg 98, 221. Wiley-Interscience: New York.
Tekin, H., Bilkay, O., Ataberk, S. S., Balta, T. H., Ceribasi, I. H., Sanin, F. D., Dilek, F. B. & Yetis U. (2006) Use of Fenton Oxidation to Improve the Biodegradability of Pharmaceutical Wastewater. Journal of Hazardous Materials, In Press