DOI: 10.12928/TELKOMNIKA.v15i1.3146 283
Hybrids Otsu Method, Feature region and Mathematical
Morphology for Calculating Volume Hemorrhage Brain
on CT-Scan Image and 3D Reconstruction
Sumijan1, Sarifuddin Madenda2, Johan Harlan3, Eri Prasetyo Wibowo4 1,2,3,4
Information Technology, Gunadarma University Jakarta, Indonesia 1Staff of UPI-YPTK, Indonesia
Corresponding author, e-mail: [email protected], [email protected], [email protected]
Abstract
Hemorrhage in the brain is a process of pathological culture from the tissues of the brain with the strength of the external mechanical, which cause physical disorders, cognitive function, and psychosocial support. Brain bleeding can cause was bruised, network torn, bleeding and brain damage or death.Segmentation techniques can be done with the Scanner computed tomography images (CT-scan) to detect the abnormalities or bleeding of the brain which occurs in the brain. This research describes the taking of an area of the brain bleeding on each image slice CT-scan and reconstruction 3D, to visualize the image of the 3D and calculate the volume of the brain bleeding. Extraction of bleeding area of the brain is based on a hybrids of Otsu algorithm, morphological features algorithm algorithm and an area of bleeding. For the reconstruction of 3D area on the area of bleeding from a slice 2D is done by using a linear interpolation approach.
Keywords: CT-scan, featured region, Otsu, morphology, volume area, incision brain injury
Copyright © 2017 Universitas Ahmad Dahlan. All rights reserved.
1. Introduction
With the increasing number of transportation vehicles with an affordable cost for the community especially motor vehicles accessible two, resulted in an increase in the number of traffic accident in Indonesia. Similarly, increasing the number of labor, industry contribute to the increasing number of occupational accidents. An accident can occur because of the activities of the sport, distribution hobby hunting and so on. The accident on the cause many victims suffered broken bones brain injury, bleeding of the brain and other diseases. The brain injury is one of the most causes that cause the death of the man [1]. From all cases of brain injury according to data traffic Police of West Sumatra in Indonesia in 2014 around 49% caused by motorcycle accidents. The brain injury most often found at the age of 15 to 24 years, and two times greater in men than women [2].
According to TBI Recovery Center (2006), Tbi traumatic injury (TBI) is bleeding brain caused by the trauma on the head. If there is a trauma on the brain, but the skull is not damaged, TBI is known as a closed head injury. This can happen, for example, if a person in a car accident or motor and head stuck on the steering wheel and not broken the bones of the skull. Traumatic brain bleeding including the fourth stage of the leading causes of death in developed countries [3]. Most patients can survive on TBI lightweight, TBI and TBI weight suffer persistent neuropsikologis problems.
the station observers [19]. CT Scan work in image acquisition system there is in the frame of the tube from the engine and is part of the system that directly deal with patients. The Scanner consists of a light source of x, collimator, detector systems and the data acquisition [1, 3].
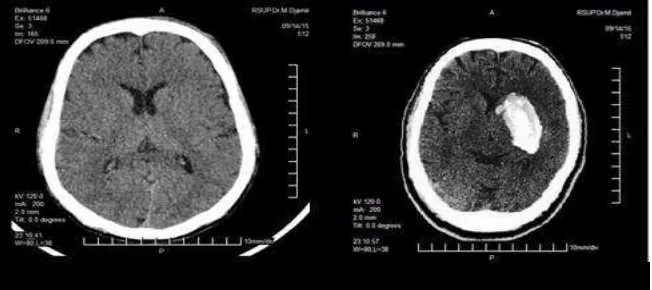
The acquisition of the image of the CT Scan of the brain usually done in the form of 2 dimensions (2D) recorded in the form of slice (sliced) with a certain distance between a layout similar to the one against the other slice. On each image slice to represent the state of the brain on the slice position. Visual inforasi representation is a variation of the intensity of the color or the level of keabuan from slices of the brain and other objects (when), as shown by the Figure 1(a) shows one slice image of normal brain and Figure 1(b) is a slice of the brain is not a normal image and the white area in the brain is an area of bleeding [4].
Figure 1. (a) The Image of the Brain Normal, (b) The Image of the Brain there is Bleeding
According to Basavaprasad B, Ravi M [5] In the subsidy debate explain the understanding of the image in the input is an image of the output and is the standard description of an image. Some important applications from the processing of the image in the field of science and technology, remote sensing, features extraction, face detection, expected, optical character recognition, finger print detection, sorting optical drive, argument reality, microscope imaging, lane route,, medical image processing, and though the morphological image. Kou Z, Wu Z, Tong KA, Holshouser B, Benson R, Hu J, Haacke EM [6], In the subsidy debate said MRI and applications in identifying the bleeding brain have shown the potential for the detection of the bleeding of the brain and can improve the detection of the bleeding of the brain and the results of the optimal prediction [5, 6].
According to Gajdhane AV, Deshpande LM [7]a detection system bleeding brain using image processing used for classifying on the bleeding brain on CT Scan. With the MATLAB implementation by making the procedure. In the image processing procedure, such as the process of pre-processing, segmentation and feature extraction done in detail. Produce a more accurate image of the processed using various techniques of segmentation and enhancements. Joseph RP, Singh CS, Manikandan M [8] in the subsidy debate explain the segmentation of the image of the brain with MRI using this method the algorithm K-mean with clustering with the morphological filtering to avoid misclustered areas of which will eventually formed after segmentation of the image of the brain with an MRI to detect tumor area [7, 8].
Vijaya G, Suhasini A, Priya R [9] explained in the paper The scientific rigor cancer detection Scheme consists of four stages. They, preprocessing segmentation feature extraction and classification,. Four levels is used in image processing to improve the tumor precise identification [9]. The end result of this paper is to find a cancerous tumor as are benign (or) malignant. According to Akanji OA, Akinola RA, Balogun BO, Akano AO, Atalabi OM, Akinkunmi MAN, Awosanya GOG [10], confirm the robustness CT scan in detecting both intracranial skull cavity and additional skull lesions in patients with head injury, which is the most common cause, while the lesion is most often cerebral contusion.
between the part of the brain through the dye with the help of histogram algorithm. This research has not been oriented toward the detection of brain injury [11]. Further research to identify and extract the image of the brain from the image of CT Scan for classifying brain bleeding and not bleeding brain with classification method the algorithm k-means that examined by Sharma [13].
The next research (Wenan Wenan C, Smith R, Ji SY, Esponsible KR, Najarian K [15]), in this research suggested that the ICM and MASP algorithm to compare both the algorithm to analyze traumatic brain bleeding. The results focus on the automatic processing the image of the brain CT Scan for the segmentation and identify the bleeding arrhythmia brain. The latest research about brain bleeding is done by the Sela [14] proposed algorithm Neuro Fuzzy and extraction ROI for medeteksi and identify and measure the area of the brain abnormal bleeding with different locations vary in the form of the image of a CT scan of the brain 2D [12, 14]. This research suggests the topic of resource extraction in the area of the brain bleeding in each image slice CT scan, reconstruction form of 3D area bleeding and counting their volume.
2. Research Method
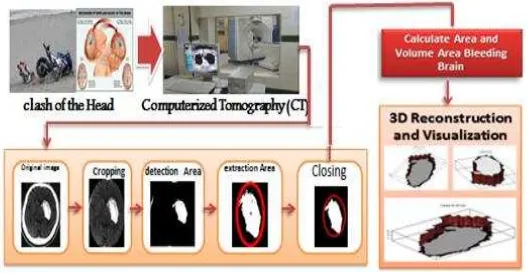
Diagram block from the whole process of the system can be described as in the Figure 3. The Image of the brain that is used in this program is the image of the brain results from CT- Scans brain bleeding. The process on the diagram of the most important system consists of the selection of the pieces of heavy bleeding, enter the area border bleeding, bleeding detection and counting the volume. The method or sequence of research done in this research is described in the Figure 3. This research consists of 6 stages namely:
Figure 2. The Method Developed
2.1. Otsu and Feature Region Method
Otsu method published by Nobuyuki Otsu. This method of determining the value of the threshold with how to distinguish the two groups, namely the object and the background that has the part that rests on each other, based on histogram (see Figure 3) [16].
(a) (b) Figure 3. The Determination of the
Value of the Threshold to Obtain Optimal Results
Figure 4. (a) Representation of the Region with the Approach of Ellipse Shape, (b) Representation of the
The principle of Otsu method described below. First of all, probability value of the intensity of the histogram is calculated through the formula as follows:
(1)
The method feature region of an object is represented as a region with Ellipse shape approach. Figure 4. shows a region from the white pixels that direpsentasikan with Ellipse shape approach. In the Figure 4. visible blue line indicates the firebrand presidents of major and minor firebrand presidents and white point as the foci of the Ellipse shape [17].
2.2. Mathematics Marfologi Method
The morphology method mathematics is a branch of image processing which is very useful to analyze the form in the image. Matlab has many tools for morphology binary form in the box image processing equipment; most of which can be used to grayscale or monochrome documents at morphology also. The Theory of morphology of mathematics can be developed in many different problems. We will adopt one of the standard method that uses the operation on the set of points [15, 18].
Two underlying operations namely dilasi morphology and erosion. Two other operations that are very useful in the processing of the image is the opening and closing formed through two basic operations.
(a) Opening: Smooth lines and the form of the object, eliminating the parts that narrow, and eliminating.
(b) Closing: Tend to smooth lines form but the reversal of the opening, rejected the pieces of narrow and long bay and thin, removes small hole and fill the gap on the lines of the form (contour).
3. Results and Analysis
3.1. The First Phase Input Cropping Area
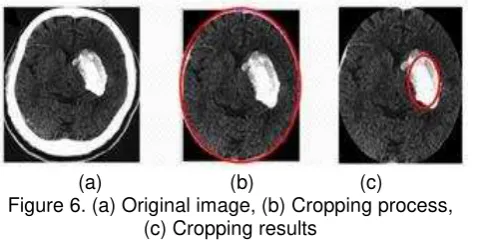
Cropping process aims to eliminate unnecessary noise outside of the object of research, determine the image of the object of research to be analyzed and processed, and minimize original brain image size that can be easily processed and analyzed.
The algorithm used to cropping process is ellipse shape as:
1. Start
2. Read the input image 3. Show the input image
4. Calculate sum the size and intensity 5. Determine the midpoint of
6. Determine the radius of the midpoint 7. According coordinates and position of
Figure 6. (a) Original image, (b) Cropping process, (c) Cropping results
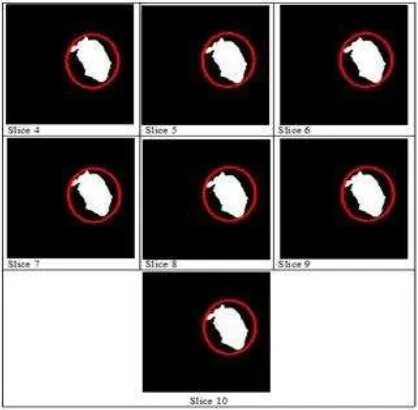
In The Figure 6(c) cropping process results from patients consists of ten slices in the brain shows no white color bleeding brain in all slices, for that done the process of detection and extraction.
3.2. The Second Phase of the Detection Areas of the Brain
object to be studied and objects that are not investigated because both are white by Otsu method.
Figure 7. The results of the Detection Area of the Brain Hemorrhage
The results of the detection of the brain bleeding using Otsu algorithm is still bleeding, the image is still mixed with noise such as seen in the position of the bottom left and top (appointed the arrow with the yellow color). For that we need to do the process of separation between the image of the brain bleeding cool and not the image of the brain bleeding, the process can be done by removing the area not search using the feature extraction algorithm region.
3.3. The Third Stage of the Extraction Area of the Brain
The results of the detection of the brain bleeding using Morphological algorithm, the extraction area the bleeding area detection based methods Morphological (closing process).
3.4. The Fourth Stage of Calculating the Area of each Slice Brain
The purpose of this stage is to calculate the area of a brain hemorrhage per incision that has been extracted for calculating the area of a brain hemorrhage and regionprops Bwareaopen method is used. To further carry out extensive conversion of the object in pixels into a square centimeter. Calculation of area and volume of brain hemorrhage are algorithm can be seen below.
1. Start
2. Input image cropping results
3. Change the gray scale image into a binary 4. Eliminate noise area <of 8 pixels
5. Determine the area of each object and list the address and index constituent pixels, (s1 = regionprops (BW, 'Area', 'PixelList', 'PixelIdxList');
6. Check the position of each object to k, if located on the outskirts of the image, delete the area (not the searched area) If not, do step 7.
7. Check the next area (k = k + 1), if still exists, repeat lanhkah 6 If not, do to 8
8. Show the end result (searched area)
9. Determine the number of the searched area
string; filename = strcat (int2str (n), '. jpg'); 5. Read the corresponding input image file
incision is found; I = imread (filename); 6. Eliminate noise area <of 8 pixels; BW =
bwareaopen (I, 8);
7. Determine the magnitude of each area of each incision (object) and the mailing address and index constituent pixels, s1 = regionprops (BW, 'Area', 'PixelList', 'PixelIdxList');
8. Calculate the total area of the whole incision, sum = sum + s1.Area;
9. If still there, repeat step 3
10. View the results of its total land area, disp (['Total Total Area:', num2str (sum)]);
11. Finish
Next step Calculating Total Area Bleeding entire Slice. The its algorithm can be seen below.
3.5. The Fifth Stage of Calculating the Volume of Brain Area
The purpose of this stage to calculate the volume of the bleeding area of the brain that has been successfully calculated the area of a brain hemorrhage. To further converting the volume of objects in the bleeding area of pixels into a cubic centimeter. To calculate the area of a brain hemorrhage that has successfully segmented object is to convert the area into a pixel in a square centimeter. The image of the inputs used in this application is 512 x 512 pixels. Based on an application for DICOM Viewer, the image size of 512 pixels obtained has a length of 36.12 cm from the descriptions, the authors found that 1 cm = 14.1750 pixels and 1 pixel = 0.0706 cm2. Representation of 1 square pixels would be worth 0.0050 mm2. These values will be used to calculate the volume of a brain haemorrhage image area.
Algorithm of haemorrhage Entire Area Volume Slice can be seen below. 1. Start
2. The sum = 0 and volcedera = 0
3. Check each file incision brain; for n = 1: n
4. Change the file name of the integer i to string; filename = strcat (int2str (n), '. jpg'); 5. Read the corresponding input image file incision is found; I = imread (filename); 6. Eliminate noise area <of 8 pixels; BW = bwareaopen (I, 8);
7. Determine the magnitude of each area of each incision (object) and the mailing address and index constituent pixels, s1 = regionprops (BW, 'Area', 'PixelList', 'PixelIdxList'); 8. Calculate the total area of the whole incision, sum = sum + s1.Area;
9. If it still exists, repeat lanhkah 3
10. View the results of its total land area, disp (['Total Area:', num2str (sum)]); 11. Calculate the volume of the injured area with the formula:
V = total pixels entire distance between incision incision * * (number of incisions - 1) in units of cm3, v = ((sum * 0.5) * (n-1)) * 0.00497686157265625;
12. View the results of the calculation to find the volume area, disp (['Volume Area Injury:' num2str (volcedera)]);
3.6. The Final Stage of the 3D Reconstruction and Visualization:
3-dimensional image reconstruction is formed from two-dimensional image of a brain hemorrhage that has terdekteksi perfectly resulting from the extraction process with the morphology method.
Algorithm of 3D reconstruction process as shown below.
1. Start
2. Determine the input image file
3. Determine the number of incisions were reconstructed in 3D
4. Determine the coordinates Xt, Yt, Zt 5. Set Volume = 0
6. sets the input image beginning with 1 7. sets the input image file name and extension 8. Read the input image
9. Determine the size of the input image 10. Check the image of each slice to i, Specify the file name input image
Read input image conversion to fractional Perform re-size the image input
Calculate the volume of each incision area bleeding
11. If there is still next incisions, repeat steps 9 12. Calculate the total volume of the entire incision
13. Show the total volume of the entire incision 14. Perform 3D reconstruction
15. View the results of reconstruction and 3D visualization
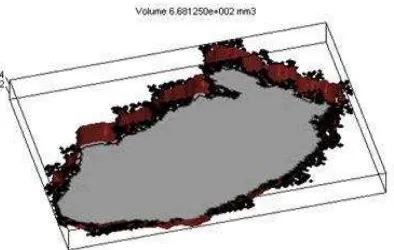
Figure 9. Reconstruction of the 3D Volume Slice Area 3 Brain Hemorrhage
Table 2 Measurement Result Shows volume area of brain hemorrhage.
Table 2. Volume area of brain hemorrage
No. Slice Total
Results 3D reconstruction of images 14 images 15 and 16. The images can be seen that consists of 7 incision bleeding of the brain which has an area of 37,355 pixel2 bleeding and had bleeding volume 0.933875 9.33875 mm3 or cm3.
Figure 11. 3D reconstruction Hemorrhage Brain Area Volume 7 Slice
Figure 12. Diagram Overall Detection, Extraction and 3D Reconstruction
Results of calculating the volume of a brain haemorrhage image area with the formula: total pixels entire distance between Slice Slice * (number of Slice - 1), total pixels: 37,355.00 pixels 2, the distance between Slice: 0.05 cm, the amount Slice: 7, volume: 0,933 875 cm3, the execution time: 5 seconds. Overall detection, extraction and reconstruction can be illustrated in Figure 12, the results of this study can help the physicians and radiologists to analyze images from the CT scan results, so that a doctor and radiologist is not one of interpretation in detecting and diagnosing brain hemorrhage CT-results scan. In the end, different decision-making between physicians or radiologists can be overcome.
4. Conclusion
This research provides a method for segmentation, extraction and 3D reconstruction image of the incision. Merger Otsu method, feature region and Morphological can generate several things including:
1. Algorithm cropping elliptical proposed models can accurately separate area of the skull and the brain from other areas in the image of a CT scan. These results greatly facilitate and accelerate the process of extraction of hemorrhage in the brain area.
area. Mathematical morphology algorithm used to cover parts of the bleeding area lost by previous processes.
3. The area and volume calculation algorithm can calculate the area of a cerebral hemorrhage per slice and the volume of the entire slice through 3D reconstruction bleeding area. 3D reconstruction algorithm used brain hemorrhage area is referring to the algorithm linear interpolation between two adjacent slices. For example in the case of test images that result for obtained an area of bleeding between 3.227 to 5.598 square pixel and total area = 37,355.00 pixel 2 of the total slice. Volume area after a brain hemorrhage in get to convert from cubic centimeter to square pixels, so that the volume of the hemorrhage area = 5.5773 cm3.
References
[1] FCA, Shepard. Fact sheet: Traumatic Brain Injury (TBI): selected statistics. 1998.
[2] Polda Sumatera Barat. Buku Catatan Kriminal Polda Sumbar. Kantor Polda Sumatera Barat. 2014. [3] Zasler ND, Douglas I Katz, Ross D Zafonte, David B Arciniegas. Brain injury medicine: principles and
practice. 2nd Edition. Demos Medical Publishing. 2012.
[4] Rumah Sakit Umum Pusat Dr. M. Djamil. Buku Radiologi. Sumatera Barat. 2015.
[5] Basavaprasad B, Ravi M. A Study on the Importance of Image Processing And Its Apllications. IJRET: International Journal of Research in Engineering and Technology. 2014.
[6] Kou Z, Wu Z, Tong KA, Holshouser B, Benson R, Hu J, Haacke EM. The Role of Advanced MR Imaging Findings as Biomarkers of Traumatic Brain Injury. JCIT. 2010; 25(4): 267-282.
[7] Gajdhane AV, Deshpande LM. Detection of Lung Cancer Stages on CT scans Images by Using Various Image Processing Techniques. IOSR Journal of Computer Engineering (IOSR-JCE). 2014; 16(5): 28-35.
[8] Joseph RP, Singh CS, Manikandan M. Brain Tumor Mri Image Segmentation And Detection In Image Processing. IJRET: International Journal of Research in Engineering and Technology. 2014.
[9] Vijaya G, Suhasini A, Priya R. Automatic Detection of Lung Cancer in Ct Images. IJRET: International Journal of Research in Engineering and Technology. 2014.
[10] Akanji OA, Akinola RA, Balogun BO, Akano AO, Atalabi OM, Akinkunmi MAN, Awosanya GOG. Computerized tomography Scan and head injury: The experience in a tertiary hospital in Negeria. Across Sectional Study. 2015; 6(1): 1-15.
[11] Tan TL, KS Sim, CK Tan, AK Chong. CT Image Enhancement by Colorization for Brain Infarct Detection. Faculty of Engineering and Technology, Multimedia University, Jalan Ayer Keroh Lama. Melaka, Malaysia. 2008.
[12] Xuguang Qi, Ashwin Belle, Sharad Shandilya, Wenan Chen, Charles Cockrell, Yang Tang, Kevin R. Ward, Rosalyn H Hargraves, Kayvan Najarian. Ideal Midline Detection. Journal of Medical Imaging. 2013; 3: 51-59.
[13] Sharma B, Venugopalan K. Automatic Segmentation of Brain CT Scans Image to Identify Hemorrhages. International Journal of Computer Applications. 2012; 40(10).
[14] Sela EI, Harjoko A. Deteksi Dan Identifikasi Ukuran Obyek Abnormal (Studi Kasus: Citra Otak Manusia). Seminar Nasional Informatika 2011. Yogyakarta. 2011.
[15] Wenan Chen, Rebecca Smith, Soo-Yeon Ji, Kevin R Ward, Kayvan Najarian. Automated ventricular systems segmentation in brain CT images by combining low-level segmentation and high-level template matching. BMC Medical Informatics and Decision Making. 2009.
[16] Otsu Nobuyuki. An automatic threshold selection method based on discriminate and least squares criteria. Denshi Tsushin Gakkai Ronbunshi. 1979; 63: 349-356.
[17] Duin RPW, Juszczak P, Paclik P, Pekalska E, de Ridder D. Tax DMJ, Verzakov S. PRTools4.1, A Matlab Toolbox for Pattern Recognition. Delf University of Technology. 2007.
[18] Gonzalez Rafael C, Richard E. Digital Image Processing. 3rd edition. Woods: Prentice Hall. 2007. [19] Haralick Robert M, Shapiro Linda G. Computer and Robot Vision. Boston, MA, USA: Addison-Wesley