DOI: 10.12928/TELKOMNIKA.v13i1.1318 146
An Improved AP-Wishart Classifier for Polarimetric
SAR Images by Incorporating a Textural Feature
Chen Jun1*, Du Peijun2, Tan Kun1
1
Jiangsu Key Laboratory of Resources and Environmental Information Engineering, China University of Mining and Technology, Xuzhou City, Jiangsu Province, 221116, China
2
Jiangsu Provincial Key Laboratory of Geographic Information Science and Technology, Nanjing University, Nanjing city, Jiangsu Province, 210093, China
Corresponding author, e-mail: [email protected]
Abstract
An improved classifier is presented by imposing a textural feature to solve the problems of vague initial clustering results, low classification accuracy and unchangeable class number in the iterative classifier, based on H/Alpha decomposition and the complex Wishart distribution for fully polarimetric SAR (Synthetic Aperture Radar) images. First, wavelet transformation is used to extract texture from polarimetric SAR images. Second, an AP (Affinity Propagation) algorithm is applied to create the initial clustering result. This result is then applied to the iterative classifier based on the complex Wishart distribution to obtain the final result. Two PALSAR (Phased Array type L-band Synthetic Aperture Radar) images from ALOS (Advanced Land Observing Satellite) are used for the experiments carried out on experimental plots in Binhai Prefecture, Yancheng City, Jiangsu Province. The results show that the improved classifier has some merits, including clear initial clustering results, flexible class number and high classification accuracy. The improved classifier has better overall performance than the original, and can be effectively applied to the classification of polarimetric SAR images.
Kata kunci: POLSAR, H/Alpha-wishart classifier, AP cluster, texture, wavelet transform
1. Introduction
There are two main types of machine learning algorithm in classification of PolSAR (Polarimetric Synthetic Aperture Radar) images, namely supervised and unsupervised learning. The former requires a certain number of training samples; the latter does not need training samples. Classification accuracy of supervised learning depends substantially on the quality of training samples. However, a PolSAR image is different to an optical image. It belongs to active microwave remote sensing and is greatly affected by the interference of different waves. It therefore has shortcomings such as serious speckle noise, low contrast between objects and background, edge blurring and other uncertain factors. Although some measures can be taken to eliminate such noise, image quality is significantly degraded at the same time. So, after being contrasted with the optical image, the PolSAR image is harder to interpret. There may be some difficulty in using a supervised learning algorithm directly on a PolSAR image.
The polarimetric features of a PolSAR image are expressed by a coherent scattering matrix, which has a complex Wishart probability density distribution. Therefore, a classifier developed under these circumstances may achieve higher classification accuracy. Lee [1]-[4] proposed an unsupervised classifier after combining H/A/Alpha decomposition [5]-[7] with a complex Wishart distribution, called an H/A/Alpha-Wishart classifier.
Cloude & Pottier [6] developed H/Alpha decomposition to extract polarimetric characters from scattering information. They defined Entropy (H) as the dominant scattering mechanism in each pixel. Its function is as follows [6]:
31
3
log
i
i
i
P
P
H
(1)Here
P
i is computed as follows:
31
j j i i
P
(2)
and define:
3 3 2 2 1
1
P
P
P
(3)
(Alpha) here stands for the scattering angle; it expresses the mean scattering degree of the object. Anisotropy [19,20] (A) is defined as follows:3 2
3 2
A
(4)Anisotropy denotes a different scattering mechanism other than the mean scattering one. So Entropy (H),
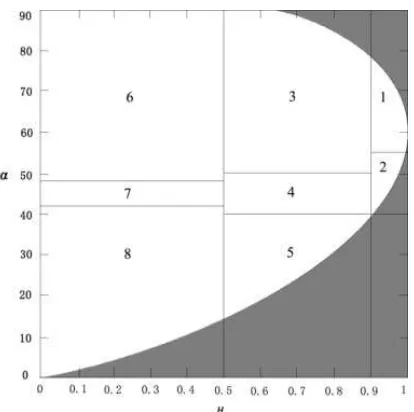
(Alpha) and Anisotropy (A) can be used to replace scattering characters of ground objects.Figure 1. H/Alpha plane
In Figure 1,‘Zone 1’ stands for high entropy even scattering, ‘Zone 2’ stands for high entropy multiple scattering, ‘Zone 3’ stands for medium entropy multiple scattering, ‘Zone 4’ stands for medium entropy vegetation scattering, ‘Zone 5’ stands for medium entropy surface scattering, ‘Zone 6’ stands for low entropy multiple scattering, ‘Zone 7’ stands for low entropy dipole scattering, and ‘Zone 8’ stands for low entropy surface scatter [6]. If a proper threshold, namely Anisotropy (A), is chosen, ground objects can be divided into sixteen further types.
With the classification result of the H/Alpha initial classifier, cluster centers can be gathered by averaging the features within each class. After this, these cluster centers can be imported to the Wishart iterative classifier to obtain the final classification result.
The H/Alpha-Wishart unsupervised classifier can fulfill the classification automatically. It is used in some areas of PolSAR image classification, but it has the following disadvantages:
The class number is unchangeable. If the H/Alpha is used, 8 classes can be obtained, or, if the H/A/Alpha is used, 16 classes can be attained. However, in reality, the class number can change at any time.
The H/Alpha classification is based on the H/Alpha plane, but real ground objects are not strictly reflected in the H/Alpha plane, particularly when H is too high (H >0.7) to use the H/Alpha plane.
The classification accuracy of the H/Alpha-Wishart classifier is directly affected by the result of the H/Alpha initial classifier, so it is necessary to improve the classification accuracy of the H/Alpha classifier.
3. Improved AP-Wishart Classifier
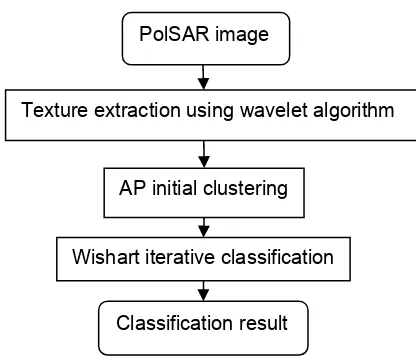
Figure 2. Flowchart of improved AP-Wishart classifier
The process of the improved classification scheme is as follows:
A wavelet extraction algorithm is used to extract texture from the PolSAR image. The wavelet as a kind of information extraction method is widely used in signal processing and image analysis [21],[22]. After Daubechies’ wavelet basis function is chosen, a pyramid algorithm from Mallat is used to extract texture from a polarimetric span image. Vertical, horizontal and diagonal information are extracted as the texture character of the PolSAR image.
The texture information above is used to fulfill the AP initial cluster. The AP algorithm was proposed by Frey and Dueck in 2007 [23],[24]. It is one of the best clustering algorithms at present. Most of the current clustering algorithms are based on initial cluster centers, which are commonly related to classification accuracy. However, the AP algorithm is different. It considers each piece of data as a potential cluster center, which is called the ‘exemplar’. Consequently, the result of the AP algorithm is not affected by initial cluster centers. The AP algorithm calculates similarity between different data points by a defined distance measure, and then changes data values into N*N (N is the size of the data) similarity matrix S. By iterative updating of, Responsibility (R) and Availability (A), an exact exemplar can be found and considered as the final cluster center. The process of the AP algorithm is as follows:
Algorithm initialization: Calculating the similarity matrix using a Euclidean distance measure, S(i,j), 0<i<N,0<j<N, the formula is as follows:
2 2 2 2
1 1
(
i
j)
(
i2
j2)
(
i3
j3)
(
in
jn)
d =
T
T
T
T
T
T
T
T
(5)Ti stands for ‘texture of sample i; Tj stands for ‘texture of sample j, n represents the
dimensions of texture.
Iterative update of R and A, R(i,k) shows that data point k is suitable for the candidate exemplar of point i —it reflects the accumulated evidence about how well-suited point k is to serve as the exemplar for point i [23].The formula is :
( , ) ( , )max ( , ) ( , )
R i k S i k A i j S i j (6)
subject to j
{1,2,……, N, but j≠k}.A(i,k) stands for the degree that point i will select point k as its candidate exemplar, and reflects the accumulated evidence on how appropriate it would be for point i to choose point k as its exemplar A [23],[24]. The formula is:
( , )min 0, ( , ) max(0, ( , ))
j A i k R k k R j k (7)
subject to j
{1, 2, ……N, but j≠i and j≠k}.Maximize R(i,k)+A(i,k), if k=i then consider i as an exemplar, else consider k as the exemplar of point i. In this way the cluster centers can be obtained.
Using the cluster centers shown above and Euclidean distance, every data point can be clustered to its own centers.
Above is the principle and process of the AP clustering algorithm. The AP algorithm can be used on the texture feature extracted from the wavelet extraction algorithm to find each cluster center.
Wishart iterative classification: Using cluster centers created by the AP algorithm, a Wishart iterative classification based on the Wishart distance can be used to obtain the final classification result. The formula is as follows:
1
dist([ ] | [
T
i])
ln | [
i] | Tr([
i] [ ])
T
(8)]
[
i stands for the average polarimetric coherency matrix of the cluster center i,
[
T
]
stands for the polarimetric coherency matrix of an unknown sample.According to the maximum-likelihood criterion, when the following condition is met:
])
[
|
]
([
])
[
|
]
([
T
i
dist
T
jdist
(9)The unknown sample is considered to belong to cluster center j. An iterative process can be used in this way until all unknown samples have their cluster centers.
4. Experiment and analysis 4.1. Research area and data
Two scenes of the PALSAR image from ALOS were used as data source for this research. The image time was April 9, 2009. Research areas are located on the Binhai wetland in Yancheng city. These are two blocks of square area with the size of 800*800 pixels. There are five types of land cover in each of these research areas: ‘field’, ‘building’, ‘road’, ‘water’ and ‘suaeda’, which are disorderly and unsystematically located on the research areas. They are thus suitable for comparing the diversity between the original H/Alpha-Wishart and the improved AP-Wishart algorithm. Images of span and pauli decomposition (polarimetric calibration) with a false color composite are shown in Figure 3.
[image:5.595.124.478.526.636.2](a) (b) (c) (d)
Figure 3. Pauli decomposition and span image of two experimental plots
((a) and (b) are thePauli decomposition and span image of Research Area 1;(c) and (d) are the Pauli decomposition and span image of Research Area 2)
4.2. Texture extraction with wavelet decomposition
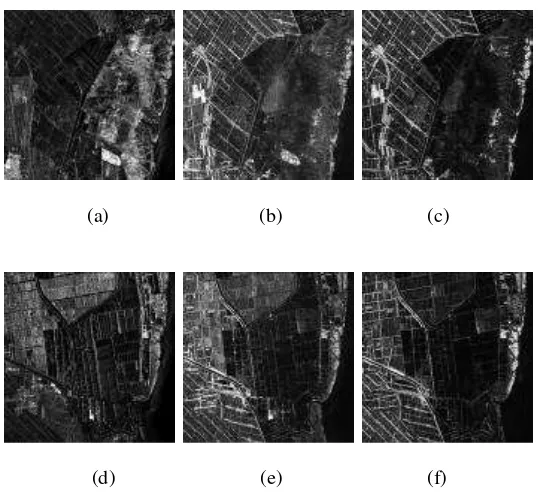
(d) (e) (f)
Figure 4. Main diagonal elements of polarimetric coherence matrix of two experimental plots ((a)-(c) are T11, T22, T33 images on experimental one; (d)-(f) are T11, T22, T33 images on
experimental two)
Span image is extracted from T11, T22, T33, and wavelet decomposition is conducted with it.
4.3. The AP-Wishart classification
AP clustering was performed using texture extracted by the wavelet extraction algorithm, the class number was set manually. After the AP clustering, cluster centers were acquired. Next, a refined Lee [25] filter was conducted to eliminate speckle noise with a window size of 7.Following this, Wishart iterative clustering was implemented to obtain the final result. For a comparison of different algorithms, SVM was used on texture and polarimetric information to fulfill the supervised classification. For convenience, when evaluating classification accuracy, similar classes of unsupervised classification were merged and the following classification result images were obtained:
4.4. Classification result and analysis
From Figure 5 it can be observed that the H/Alpha-Wishart cannot distinguish ‘field’ from ‘water’ in (b) and (c), and this raises important questions about the misclassification of ‘field’ into ‘water’. By contrast, the AP-Wishart is able to avoid this situation and perform better on the classification of ‘field’ and ‘water’. From Figure 5 (f) and (g) raise further issues about the H/Alpha-Wishart classifier, such as the fact that it can extract less ‘road’ and ‘building’ than the AP-Wishart.
(a) (b) (c) (d)
[image:7.595.102.496.76.343.2](e) (f) (g) (h)
Figure 5. Comparison of H/Alpha classifier, H/Alpha-Wishart classifier, SVM classified and improved AP-Wishart classifier result in two experimental plots
(a, b, c, d are respectively result of H/Alpha, H/Alpha-Wishart, SVM, AP-Wishart classifier in experimental plot one; e, f, g, h are corresponding result in experimental plot two)
Table 1. Comparision results from different classifier on two experimental plots
Classifier Experimental plots Total accuracy (%) Kappa coefficient
H/Alpha-Wishart one 73.73 0.52
two 79.87 0.68
AP-Wishart one 85.95 0.77
two 90.38 0.85
SVM one 86.56 0.78
two 88.53 0.82
Compared with the H/Alpha-Wishart classifier, the AP-Wishart classifier can be considered to greatly enhance classification accuracy from Table1. Its accuracy even exceeds that of the popular supervised SVM classifier. The AP-Wishart is an unsupervised classification scheme; it is more convenient and efficient than the SVM.
5. Conclusion
In this paper a brand new AP-Wishart classification scheme was proposed. By synthesizing polarimetric and textual information, which was extracted by the wavelet decomposition algorithm, a high performance AP clustering algorithm was combined with the classic Wishart iterative clustering algorithm to form a powerful unsupervised AP-Wishart clustering algorithm. Experiments were conducted on two research areas and the results demonstrated that the AP-Wishart achieved a higher classification accuracy and Kappa coefficient than the H/Alpha-Wishart and the supervised SVM. Therefore, it can be concluded that:
Texture extracted by a wavelet decomposition algorithm can assist polarimetric information to improve classification performance;
[image:7.595.130.466.432.500.2][1] Lee JS, Grunes MR, Kwok R. Classification of Multi-look Polarimetric SAR Imagery Based on Complex Wishart Distribution. International Journal of Remote Sensing. 1994; 1(15): 2299-2311. [2] Lee JS, Grunes MR, Ainsworth TL. Unsupervised Classification Using Polarimetric Decomposition
and the Complex Wishart Classifier. IEEE Transactions on Geoscience and Remote Sensing. 1999; 37(5): 2249-2258.
[3] Lee JS, Grunes MR, Pottier E, et al. Unsupervised Terrain Classification Preserving Polarimetric Scattering Characteristics. IEEE Transactions on Geoscience and Remote Sensing. 2004; 42(4): 722-731.
[4] Pottier E, Lee JS. Application of the H/A/alpha Polarimetric Decomposition Theorem for Unsupervised Classification of Fully Polarimetric SAR Data Based on the Wishart Distribution. Proceeding of Committee on Earth Observing Satellites SAR Workshop. Toulouse. 1999.
[5] Cloude SR, Pottier E. A Review of Target Decomposition Theorems in Radar Polarimetry. IEEE Transactions on Geoscience and Remote Sensing. 1996; 34(2): 498-518.
[6] Cloude SR, Pottier E. An Entropy Based Classification Scheme for Land Applications of Polarimetric SAR. IEEE Transactions on Geoscience and Remote Sensing. 1997; 35(1): 68-78.
[7] Pottier E. The H/A/α Polarimetric Decomposition Approach Applied to PolSAR Data Processing. In Proceedings PIERS Workshop Advances in Radar Methods. Baveno. 1998; (7):120-122.
[8] Laurent FF, Pottier E, Lee JS. Unsupervised Classification of Multifrequency and Fully Polarimetric SAR Images Based on the H/A/Alpha–Wishart Classifier. IEEE Transactions on Geoscience and Remote Sensing. 2001; 39(11): 2332-2342.
[9] Kimura K, Yamaguchi Y, Yamada H. PISAR Image Analysis Using Polarimetric Scattering Parameters and Total Power. 2003 International Geoscience And Remote Sensing Symposium. Toulouse. 2003; 1: 425-427.
[10] Cao F, Hong W, Wu Y. An Improved Cloude-Pottier Decomposition Using H SPAN and Complex Wishart Classifier for Polarimetric SAR Classification. Radar, 2006. CIE '06. International Conference on Topic(s): Aerospace, Communication, Networking & Broadcasting, Engineered Materials, Dielectrics & Plasmas, Fields, Waves & Electro- magnetics. 2006: 1-4.
[11] Wu ZC, Ouyang QD, Sun XA, et al. Improved Iterative Wishart Classification Algorithm Based on Polarimetric Scattering Characteristics Preservation. Science of Surveying and Mapping. 2011; 11(36):161-163.
[12] Yang J, Shi L, Li P X. Wishart-H/Alpha Classification Based on SPAN and Best Polarimetric Coherency. Geomatics and Information Science of Wuhan University. 2012; 1(37): 22-25.
[13] Zhang B, Yang R, Xie X, et al. Polarimetric SAR Image Classification Based on Polarimetric Target Decomposition and WMRF. Geomatics and Information Science of Wuhan University. 2011; 3(36): 297-300.
[14] Yang J, Lang FK, Li DR. A Polarimetric SAR Image Classification Utilizing Cloude-Pottier Decomposition and Polarimetric Whitening Filte. Geomatics and Information Science of Wuhan University. 2011; 1(36): 104-107.
[15] Yang L, Liu W, Wang ZG. Weighted-based Unsupervised Wishart Classification of Fully Polarimetric SAR Image. Journal of Electronics and Information Technology. 2008; 12(30): 2827-2830.
[16] Zhao LL, YANG J, Li PX. Statistical Classification of Weak Backscattering Scatterers of PolSAR Image. Journal of Remote Sensing. 2013; 17(2): 307-318.
[17] Lang FK, Yang J, Zhao LL. Research on Classification of SAR Image Based on Freeman Scatter Entropy and Anisotropy. Acta Geodaetica et Cartographica Sinica. 2012; 41(4): 556-562.
[18] Liu M, Zhang H, Wang C. Applying the Log-Cumulants of Texture Parameter to Fully Polarimetric SAR Classification Using Support Vector Machines Classifier. 2011 IEEE CIE International Conference on Radar. 2011; 11:728-731.
[20] Pottier E, Lee JS. Application of the H/A/α Polarimetric Decomposition Theorem for Unsupervised Classification of Fully Polarimetric SAR Data Based on the Wishart Distribution. In Proceeding Committee on Earth observing Satellites SAR workshop. Toulouse. 1999.
[21] Choy SK, Tong CS. Statistical Wavelet Subband Characterization Based on Generalized Gamma Density and Its Application in Texture Retrieval. IEEE Transactions. on Image Processing. 2010; 19(2): 281-289.
[22] Zhou SR, Yin JP. Lbp Texture Feature Based on Haar Characteristics. Journal of Software. 2013; 8: 1909-1926.
[23] Frey BJ, Dueck D. Clustering by Passing Messages Between Data Points. Science. 2007; 315(5814): 972-976.
[24] Xiao Y, Yu J. Semi-Supervised Clustering Based on Affinity Propagation Algorithm. Journal of Software. 2008; 19(11): 2803-2813.