Formosat-2 Satellite Imagery Assessment for Coastal Ecosystem Mapping in
Western Coast of Banten, Indonesia
Syamsul B. Agus1 and Indra Pratama2
1 Department of Marine Science and Technology, Bogor Agricultural University 2 Agency for Marine and Fishery Research, Ministry of Marine Affairs and Fisheries
ABSTRACT
Coastal ecosystems in West Banten are valuable, providing products and services for the livelihood of its community, and highly threatened. Threats facing coastal ecosystems in West Banten are rapid growth of coastal populations, increasing exploitation of coastal resources, alteration and loss of habitats, also high runoff carrying sediment and other terrestrial-based pollutants from coastal rivers. Mapping of coastal ecosystems will provide significant baseline data for future monitoring and sustainable management of coastal ecosystems in West Banten. Using FORMOSAT-2 data obtained on August 9, 2007, we assess current condition of coastal ecosystems in West Banten area on August 9-11, 2007. Using both data from FORMOSAT-2 satellite imagery and from field assessment, with this paper we exposed map featuring six class of coastal cover-area in West Banten. This study also measured spectral reflectance from 24 objects in West Coast of Banten.
Keywords: FORMOSAT-2, coastal, map, Banten
1. INTRODUCTION
Most of border area in Banten Province, located in 5° 7' 50" - 7° 1' 11" S and 105° 1' 11" - 106° 7' 12" E, represent coastal environment with complex use of its resources (DEPKIMPRASWIL 2003). West Coast of Banten bordering with the Sunda Strait is subject to marine tourism, transportation, industry, fisheries, and conservation. Up to this day a great variety of human activities happen there simultaneously. The main environmental impacts consist of alteration and loss of coastal habitats due to resource exploitation and development, organic and inorganic pollution, volcanic eruption from the Krakatau, and tsunami. Scientific data on coastal ecosystems, land use, landforms, and shoreline and water quality are required periodically to ensure an environmentally effective coastal zone management practices. Maps on various coastal themes form basic input to the coastal zone management models. Conventional maps are quite useful; however, they do not provide up-to-date information. Since coastal zone is very dynamic, periodic mapping is vital for planning effective strategies.
The interpretation of remotely sensed data is the best tool currently available for providing synoptic spatial information on various scales and with reasonable classification and control accuracy. The availability of FORMOSAT-2, which
produced hyperspectral data with spatial resolution of 8 m for multispectral and 2 m for panchromatic images, is expected to provide spatially comprehensive coverage at a higher resolution for effective and accurate analyses of different coastal ecosystems exist within one area. There are five spectral bands in FORMOSAT-2, i.e. P: 0,45– 0,90µm (panchromatic), B1: 0,45–0,52µm (blue), B2: 0,52–0,60µm (green), B3: 0,63–0,69µm (red), and B4: 0,76–0,90µm (near-infrared). The objective of this research is to test the ability of FORMOSAT-2 data in producing coastal geospatial data, particularly for mapping of coastal ecosystems, i.e. mangrove forests, seagrass beds, and coral reefs, in West Banten area.
2. METHODS
2.1 Study sites
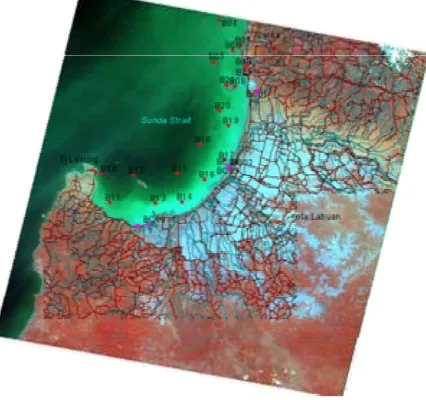
Karang Gosong Island. There were 22 study sites, particularly to obtain seawater samples, including 3 sites for coral assessment and 1 site for mangroves and seagrass assessment (Figure 1).
Figure 1. Study sites
2.2 In-situ sampling
In general, in-situ sampling conducted comprises of coastal ecosystem assessment and spectroradiometric measurements of sediment types and species. Assessed coastal ecosystems were mangroves, seagrass beds, and coral reefs, which techniques were based on English et al (1997). Reflectance measurements were made to create a spectral library of 24 reflectance spectra encompassing mangroves, other coastal vegetation, fishponds, several types of coastal-substrates and different colors of seawater.
2.3 Satellite image analysis
Morphologies of the beaches, lagoons, mangrove forests, seagrass beds, and coral reefs were classified on the basis of the spectral signatures of their various habitats using images produced from FORMOSAT-2 satellite image obtained on August 9, 2007. Geometric correction was trained with existing ground-truth data and reference map from BAKOSURTANAL were performed using ER Mapper and Arc View (Green et al. 2000).
3. RESULTS AND DISCUSSION
3.1FORMOSAT imagery
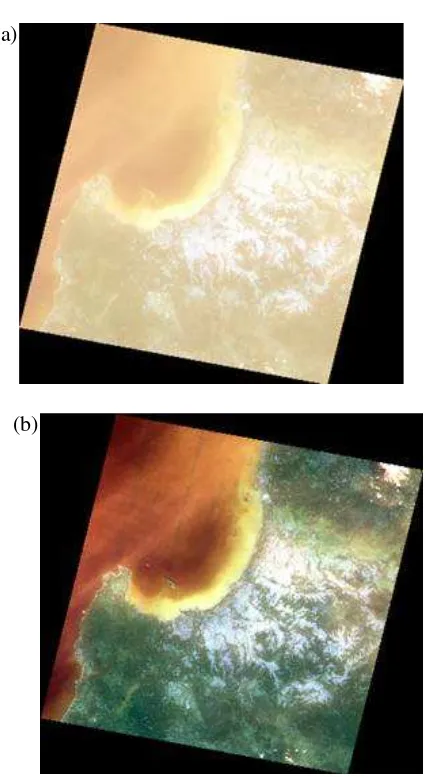
The main remote sensing mission for FORMOSAT-2, which was launched in 2004, was to capture satellite images of the Taiwan Island and the surrounding islands and ocean to monitor the environment and its resources. Later on, under international collaborative agreement, FORMOSAT-2 was also used to capture images of other regions in the Asia Pacific. Within the frame of APEC SAKE on Satellite Application on Fishery and Coastal Ecosystem (SAFE), FORMOSAT-2 acquires capture satellite images of Indonesian coastal and archipelagic waters (Figure 2).
Figure 2. Satellite images of West Banten producedby FORMOSAT-2, = acquisition date July 7, 2006 and
= acquisition date August 9, 2007.
On July 7, 2006, FORMOSAT-2 captured the first satellite image of West Banten. Due to stripping error, the images were incapable for further processing. One year later, FORMOSAT-2 acquires another image of West Banten on August 9, 2007. Panchromatic FORMOSAT-2 images of West Banten are presented in Figure 3, while multispectral FORMOSAT-2 images of West Banten are presented in Figure 4.
(b)
Figure 3. Panchromatic FORMOSAT-2 image of West Banten, (a) prior to geometric correction and (b) after geometric correction.
(a)
(b)
Figure 4. Multispectral FORMOSAT-2 image of West Banten, (a) prior to geometric correction and (b) after geometric
3.2 Coastal ecosystems of West Banten
Coral communities in West Banten are influenced by volcanism and extreme sedimentation due to lots of river discharges, thus resulting in patchy distribution and no significant carbonate accretion to form fringing reefs as if before 1883 Krakatau eruption (Tomascik 1997). From three observed sites, i.e. Popoleh Island, Karang Gundul, and Karang Gosong, the highest cover of hard corals were available in Karang Gundul (43.0%). Benthic communities in Popoleh Island were dominated by soft corals of Lobophytum, while calcareous macroalgae of Halimeda were common in Karang Gosong (Figure 5). Common Scleractinian corals observed were Acropora, Pocillopora, Stylophora, Porites, Favia, and Montipora.
Figure 5. Results of coral reef assessment in West Banten
There was only one species of seagrass observed in the study sites, Enhalus acoroides, which is the largest species of seagrass. In relation to general feature of study sites, existing silty to muddy sediments support Enhalus to form monospecific meadows. Mangrove vegetation in study sites comprised mainly of Rhizopora and Bruguiera. Other mangrove species observed in the surroundings were Avicennia, Sonneratia, Xylocarpus, Ceriops, and Exoecaria.
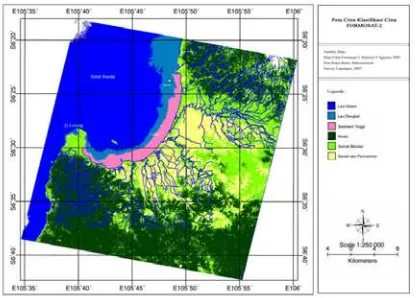
other coastal land-vegetation, also rice fields and housings. This map, in a geographic information system (GIS) format, can be used for fieldwork, as base maps for other scientific studies and for management of coral reef ecosystem.
Figure 6. Classified map of coastal environment in West Banten, using multispectral FORMOSAT-2 image with spatial resolution of 8 m.
High resolution (8 m) classification map was generated for coastal environment of West Banten, Indonesia, from a mosaic of FORMOSAT-2 multispectral images to produce six classes (Figure 6). Contrast-stretched, multi-spectral image maps provided a qualitative method to distinguish different types of seawater (deep, shallow, and high turbid waters), mangrove forests, bushes and other coastal land-vegetation, also rice fields and housings. This map, in a geographic information system (GIS) format, can be used for fieldwork, as base maps for other scientific studies and for management of coral reef ecosystem.
3.3 Spectroradiometric measurements
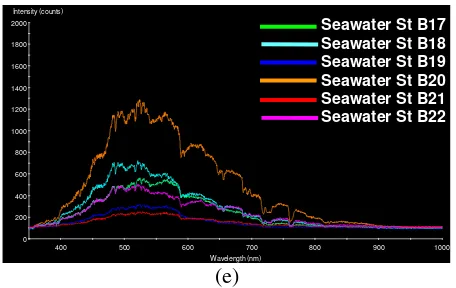
In-situ spectroradiometric measurements play an important role in the development of remote sensing applications, bridging the gap between laboratory optical measurements and measurements from satellite platforms (Dekker et al. 1992). Therefore, this study also measure reflectance properties of various objects. Averaged reflectance spectra for the coastal vegetation, including two species of mangroves, different types of coastal substrates, fishponds, and different types of seawater are shown in Figure 7.
(a)
400 500 600 700 800 900 1000
Intensity (counts)
400 500 600 700 800 900 1000
Intensity (counts)
400 500 600 700 800 900 1000
Intensity (counts)
400 500 600 700 800 900 1000
Intensity (counts)
(e)
Figure 7. Observed spectral reflectance of coastal vegetation (a), coastal substrate (b), fishponds (c), and different types of seawater (d, e).
There were two types of fishponds for reflectance measurement, i.e. concrete-based and sand-based. The concrete fishponds spectra had the highest reflectance values (Figure 7c). The coastal vegetation had lower reflectance compared to different coastal land-substrate (Figure 7a and 7b). This indicated that bare sediment around the coasts could be easily separated from other bottom types on the basis of brightness alone.
All coastal vegetation showed a reflectance maximum at around 750 nm, and mangrove reflectance spectra showed the most variation in shape and magnitude within species in comparison with the other groups (Figure 7a). Within them Rhizopora had the lowest reflectance values and the least variation in spectral shape (Figure 7a). Figure 7d and 7e illustrate that turbid seawaters have higher reflectance in comparison to clear seawaters. All turbid seawaters exhibit a reflectance maximum at around 500 nm.
4. CONCLUSION
FORMOSAT-2 is able to provide high-quality satellite images for coastal environment mapping. Results from spectroradiometric measurements indicate that:
(1) for the purpose of medium (community) and fine (species) vegetation mapping, it is best to use spectral band B2 and B4 of FORMOSAT-2.
(2) for the purpose of coastal seawater and sediment mapping, it is best to use spectral band B1 and B2 of FORMOSAT-2
(3) for the purpose of fish ponds mapping, it is best to use spectral band B2 and B3 of
ACKNOWLEDGMENTS
This research was supported by the Agency for Marine and Fishery Research of the Indonesian Ministry of Marine Affairs and Fisheries, Department of Marine Science and Technology of Bogor Agricultural University, Agency for the Assessment and Application of Technology, and counterparts in Chinese Taipei especially in providing valuable FORMOSAT-2 data. The assistance of several colleagues during fieldwork is gratefully acknowledged. Special thanks to Adriani whose comments were greatly appreciated in contributing to the final form of this paper.
REFERENCES
Dekker AG, Malthus TJ, Wijnen MM, Seyhan E (1992) The effect of spectral bandwidth and positioning on the spectral signature analysis of inland waters. Remote Sens. Environ. 41: 211–225
DEPKIMPRASWIL. 2003. Buku Profil Penataan Ruang Provinsi Banten. Direktorat Jenderal Penataan Ruang. Departemen Pemukiman dan Prasarana Wilayah.
English, C. Wilkinson and V. Baker (Eds.). 1997. Survey Manual for Tropical Marine Resources 2nd Edition. Australian Institute of Marine Science.
Green EP, Mumby PJ, Edwards AJ, Clark CD (2000) Remote sensing handbook for tropical coastal management. UNESCO, Paris
Tomascik, T, AJ Mah, A Nontji, and MK Moosa. 1997. The ecology of the Indonesian seas, part 2. Periplus editions.
400 500 600 700 800 900 1000
Intensity (counts)
Wavelength (nm)