TO IMPROVE THE STUDENTS’ READING
COMPREHENSION
(A Study of the Eighth Grade Student
of SMP Negeri 1 Pati in the Academic Year of 2011/2012)
a final project
submitted in partial fulfillment of the requirements
for the degree of Sarjana Pendidikan
in English
by
Widi Astani
2201407177
ENGLISH DEPARTMENT
FACULTY OF LANGUAGES AND ARTS
SEMARANG STATE UNIVERSITY
ii
PERNYATAAN
Dengan ini saya,
Nama : Widi Astani
NIM : 2201407177
Prodi/Jurusan : Pendidikan Bahasa Inggris/Bahasa dan Sastra Inggris
Fakultas : Bahasa dan Seni Universitas Negeri Semarang
menyatakan dengan sesungguhnya bahwa skripsi/final project yang berjudul:
THE USE OF VISUALIZATION IN DESUGGESTOPEDIA TEACHING
METHOD TO IMPROVE THE STUDENTS’ READING
COMPREHENSION (A Study of the Eighth Grade Student of SMP Negeri 1
Pati in the Academic Year of 2011/2012)
yang saya tulis dalam rangka memenuhi salah satu syarat guna memperoleh gelar
sarjana ini benar-benar merupakan karya saya sendiri yang saya hasilkan melalui
penelitian, pembimbingan, diskusi, pemaparan atau ujian. Semua kutipan baik
yang langsung maupun tidak langsung, baik yang diperoleh dari sumber
kepustakaan, wahana elektronik, wawancara langsung maupun sumber yang
lainnya telah disertai keterangan mengenai identitas sumbernya dengan cara
sebagaimana yang lazim dalam penulisan karya ilmiah. Dengan demikian
walaupun tim penguji membubuhkan tanda tangan sebagai tanda keabsahan
skripsi saya, seluruh skripsi ini tetap menjadi tanggung jawab saya sendiri. Jika
kemudian hari ditemukan pelanggaran terhadap konvensi tata tulis ilmiah yang
berlaku, saya bersedia menerima akibatnya.
Demikian, harap pernyataan ini digunakan seperlunya.
Semarang,
Yang membuat pernyataan,
WIDI ASTANI
iv
“Life is a dream, realize it. Life is life, fight for it."
-Mother Teresa
To
My beloved parents
(Mr. Punk and Almh.Mak Nyai) My dearest sisters
(Mbul and Ntuz)
Someone special in my life (Petruk)
My best friends
v ABSTRACT
Astani, Widi. 2011. The Use of Visualization in Desuggestopedia Teaching Method to Improve the Students’ Reading Comprehension (A Study of the Eighth Grade Student of SMP Negeri 1 Pati in the Academic Year of 2011/2012). Final Project. English Department, Arts and Languages Faculty of Semarang State University. S1 Degree of Education. First Advisor: Prof. Dr. Mursid Saleh. Second Advisor: Drs. La Ode M.
Keywords: visualization, desuggestopedia teaching method, reading comprehension
This final project is about the use of visualization in Desuggestopedia
teaching method in improving students‟ ability in reading comprehension. In
order to focus the discussion on the topic, the problems that I want to discuss in
this final project are whether there is any difference between students‟ reading
comprehension before and after treatment and also whether there is any significant
difference in students‟ reading comprehension between students taught using visualization in Desuggestopedia and those taught without visualization in conventional teaching method. The purpose of this study was to know whether the
use of visualization in Desuggestopedia could improve students‟ achievement in
reading comprehension and was there any significant difference between students who taught by using this method and conventional method. Visualization is a technique involving focusing on positive mental images in order to achieve a particular goal. It includes visualizing story or text in order to make the reading activity more fun and comprehend the content of the text easily.
This study conducted to the eighth grade students of SMP Negeri 1 Pati in the academic year of 2011/2012. This study used quantitative method by using pre-test and post –test. Try-out was used to know the reliability and validity of item test. Class VIII-A was an experimental group and VIII-B was a control group. There were four times treatments before post-test conducted. The students were given recount text for the treatment.
To check the significant effect of the treatment, I analyzed the result by using t-test formula. With α = 0.05 and df = 53, the critical value of t is 1.67. The Ho accepted area was the value between -1.67 and 1.67. In the pre-test, the obtained t value from t-test was -0.0017 and it was located in the Ho accepted area, so it could be concluded that there was no significant difference of final condition between experimental and control group on the pre-test. But in the post-test, the obtained t value from t-test was 4.805 and it was located in the Ha refused area, so it could be concluded that there was significant difference of final condition between experimental and control group on the pre-test.
The experimental group was higher or better than the control group. It could be drawn that the use of visualization in Desuggestopedia teaching method
to improve students‟ reading comprehension was effective. Furthermore, the
vi
ACKNOWLEDGEMENT
First and foremost, Alhamdulillahirobbilalamin, I would like to express
my greatest gratitude to Allah SWT, the great creator of beings, for the life,
blessing, and guidance He gives to me in making and finishing this final project.
My grateful to all lecturers who have given their advices to make my
final project better. First, I would like to say my gratitude to Prof. Dr. Mursid
Saleh as my first advisor. Second, I would like to say thank you to Drs. La Ode
Musyaridun as my second advisor.
My greatest appreciation is expressed to all the lecturers in English
Department of Semarang state University who had a lot of patience during they
shared their knowledge. Thanks also to all the staff of English Department who
helped us during we did our study.
I would like to say mu special gratitude, appreciation, and thankful to my
beloved parents who give all their best to me since I was born until now. Then,
thanks to my sisters and friends for the supports they gave to me.
Moreover, I would like to say thankful to Mr. Mulyadi Slamet Widodo,
M. Pd. as the headmaster of SMP Negeri 1 Pati. Also to Mrs. Eny Rismawati, S.
Pd. as English teacher of eighth grade in the school and the eighth students of
SMP Negeri 1 Pati as my subject in my research.
Last, for all people that I can not mention it one by one. Thank you so
much for all the helps you are given to me.
vii
TABLE OF CONTENTS
Abstract ………...…v
Acknowledgement ……….. vi
Table of Contents ……… vii
List of Tables ……….. x
List of Appendices ………. xi
CHAPTER I INTRODUCTION ……….. 1
1.1 Background of the Study ……….. 1
1.2 Reasons for Choosing the Topic ………... 3
1.3 Statements of the Problem ……… 4
1.4 Objectives of the Study ………. 5
1.5 Hypothesis of the Study ……… 5
1.6 Significance of the Study ……….. 5
1.7 Definition of Terms ……….. 6
1.8 Outline of the Report ……… 8
II REVIEW OF RELATED LITERATURE ………. 9
2.1 Definition of Visualization ……… 9
viii
2.3 Definition of Reading ……… 12
2.4 Definition of Reading Comprehension ………. 12
2.5 Application of Visualization in Desuggestopedia Teaching Method in A Classroom ……… 15
III METHOD OF INVESTIGATION ……….. 17
3.1 Research Design ………... 17
3.2 Population ……… 17
3.3 Sample and Sampling Technique ……… 18
3.4 Research Variables ……….. 19
3.5 Experimental Design ……… 20
3.6 Instruments for Collecting Data ………...… 21
3.6.1 Try Out ………. 22
3.6.2 Validity of the Test ………..… 22
3.6.3 Reliability of the Test ………..… 23
3.6.4 Item Difficulty ………...….. 24
3.6.5 Item Discrimination ………...….. 25
3.6.6 t-test ………...…….. 27
3.7 Procedure of Collecting Data ………..…… 28
3.7.1 The Activities of The Experimental Class ………..………… 28
3.7.2 The Activities of The Control Class ……….……….. 32
ix
4.1 The Result of Try-Out Analysis ……… 34
4.1.1 Validity ………..……… 35
4.2.1 Reliability ……….. 36
4.3.1 Item Difficulty ………... 37
4.4.1 Item Discrimination ………...…… 40
4.2 The Significant Difference of Pre-Test Result ……….. 43
4.3 The Significant Difference of Post-Test Result ………... 45
4.4 Discussion of the Research Findings ………... 48
V CONCLUSIONS AND SUGGESTIONS ………...…….. 50
5.1 Conclusions ………..………. 50
5.2 Suggestions ……….…….. 51
Bibliography ……….…… 53
x
LIST OF TABLES
Table Page
1.1 Item Difficulty Criteria ……….…… 25
1.2 Item Discrimination Criteria ………. 26
1.3 t-test Analysis Steps ………..……… 27
1.4 List of Experimental Class Activities ………...……… 29
1.5 List of Control Class Activities ………...………. 32
1.6 Item Difficulty Computation ……….………38
1.7 Item Discrimination Computation ……… 41
1.8 Pre-Test Result ……….………. 43
xi
LIST OF APPENDICES
Appendix Page
1. List of Students in Experimental Group ……….. 56
2. List of Students in Control Group ……… 57
3. Computation of Validity, Reliability, Item Difficulty, and Item Discrimination of the Try Out Result ……….. 58
4. Score of Pre-Test between Experimental Group and Control Group and the t-test Result ………. 65
5. Score of Post-Test between Experimental Group and Control Group and the t-test Result ……… 70
6. Lesson Plan (for Experimental Class) ……… 75
7. Lesson Plan (for Control Class) ………. 91
8. Reading Comprehension Test ……… 105
9. Answer Key ……… 111
10. Answer Sheet ……….. 112
11. Surat Keputusan Penetapan Dosen Pembimbing ……….. 113
12. Surat Permohonan Izin Penelitian ……….. 114
CHAPTER I
INTRODUCTION
In the first chapter presents introduction, consists of background of the
study, reason for choosing the topic, statement of the problem, objectives of the
study, hypothesis of the study, significance of the study, definition of terms, and
outline of the report.
1.1
Background of the Study
Language as an important tool for communication is in continuous development
in the world. Language as a means of communication is used among human
beings in order to establish social relationship. There are many languages in the
world, one of them is English. English as international language has big role in
language development. Many countries in the world use English as native
language even there are many countries also use English as the second language.
Nowadays English in Indonesia become a foreign language, but it is not
impossible if someday English become a second language like in our neighbor
countries such as Malaysia and Singapore.
In learning English, we should master four important skills, those are
listening, speaking, reading, and writting. One skill that has to be mastered is
reading. At the beginning, we learn to read something and then we read to learn
something. We know much information by reading. The more reading we do, the
more knowledge and information we will get. Reading is a language skill that
requires both structure and vocabulary study. Reading comprehension as a
communication skill has an important role in the foreign language curriculum.
Students themselves realize that it is useful to be able to read. In reading
unfamiliar text for comprehension, students have to be able to recognize words
and structures in context. But the each students‟ intellegence is different.
Ramelan shows the fact:
To students, reading is also something crucial and indispensable since the success his study depends for the greater part on his ability to read. If his reading skill is poor, he is likely to fail in his study or at least he will have difficulty making progress. On the other hand, if he has a good reading ability, he will have a better chance to succeed in his study at school (Ramelan, 1990: 1)
For effective teaching to take place, a good method must be adopted by a
teacher. A teacher has many options when choosing a style by which to teach. The
teacher may write lesson plans of their own, borrow plans from other teachers, or
search online or within books for lesson plans. When deciding what teaching
method to use, a teacher needs to consider students' background knowledge,
environment, and learning goals. Teachers are aware that students learn in
different ways, but almost all children will respond well to praise. Students have
different ways of absorbing information and of demonstrating their knowledge.
Teachers often use techniques which provide multiple learning styles to help
students retain information and strengthen understanding. A variety of strategies
and methods are used to ensure that all students have equal opportunities to learn.
There are many different language teaching method that have different
to harness the nonrational and or nonconscious influences and redirect them so as
to optimize learning. The method has a somewhat mystical air about it, partially
because it has few direct links with established learning or educational theory in
the West, and partially because of its arcane terminology and neologisms, which
one critic has unkindly called a “package of pseudo-scientific gobbledygook”
(Scovel 1979: 258).
1.2
Reasons for Choosing the Topic
Reading is one of the language skills which should be developed for students in
learning English. By reading, they are expected to get knowledge and information
from books, article, journals, magazines, newspaper and other types of writing.
Students sometimes get difficulties to read foreign language text. They have to
face some new words and structures which are completely different from their
native language. They sometimes have to face long and complicated text and
passages. In addition, it spends a long time, too.
One of the methods in developing the students‟ reading skill ability of
English is by using visualization in the teaching-learning process. Students are
encouraged to visualize and cooperate one another. The visualization is related to
the text that students read. All activities follow a cycle that involves teacher
modeling, visualization in additional practice, and testing.
The reasons for choosing the topic are first I want to know that
visualization which is used in Desuggestopedia teaching method can improve the
Desuggestopedia teaching method will be effective or not will be defined by the
result of this study.
Then, I also want to know the advantages of using visualization in
Desuggestopedia teaching method if it is applied to the class. Each teaching
method has advantages and disadvantages in their application. To know the
advantages and disadvantages of using visualization in Desuggestopedia teaching
method, I have to do a research relates to the topic.
Additionally, I choose junior high school level since the students of junior
high school is prepared to continue to senior high school and they have to get the
basic knowledge in reading especially before they face text or article that more
complicated in senior high school. So that is why I choose this topic in my study.
1.3
Statements of the Problem
In order to focus the discussion on the topic, the problems that I want to discuss in
this final project are:
(1) Is there any difference between students‟ reading comprehension before
and after treatment by using visualization in Desuggestopedia teaching
method?
(2) Is there any significant difference in students‟ reading comprehension
between students taught using visualization in Desuggestopedia teaching
method and those taught without visualization in conventional teaching
1.4
Objectives of the Study
The objectives of this study are:
(1) To explain whether there is any difference or not between students‟
reading comprehension before and after treatment by using visualization in
Desuggestopedia teaching method.
(2) To analyze any significant difference in students‟ reading comprehension
between students taught using visualization in Desuggestopedia teaching
method and those taught without visualization in conventional teaching
method.
1.5
Hypothesis of the Study
The hypothesis of this study is:
(1) Ha : there is any significant difference using visualization in
Desuggestopedia teaching method and using conventional method
to improve students‟ reading comprehension.
(2) Ho : there is no any significant difference using visualization in
Desuggestopedia teaching method and using conventional method
to improve students‟ reading comprehension.
1.6
Significance of the study
The result of this study will hopefully provide some advantages as follows:
The result of this study will give contribution for teachers to improve their
teaching method in order to make an interesting, interactive, and effective
classroom during teaching and learning process. Beside that, teacher will
realize that the need of using visualization in Desuggestopedia teaching
method as a part of teacher‟s talks can help them to make more interactive
and comfortable. Conducive classroom environment will help students for
achieving the good result of English learning.
(2) For the readers
The result of this study will give the description about how to use the
visualization, especially in Desuggestopedia teaching method during class
in order to get the good result in English learning. Then it will give
contribution to the readers who have correlation with it.
(3) For me
It will give much advantage to me as the students of English Education
Department to learn how to be a good English teacher and use a new
technique to improve the students‟ ability in four components also manage
an enjoyable and comfortable classroom for the students and teacher itself.
1.7
Definition of Terms
To help me in observing the reference and guiding the research, there are some
terms which are related to the study, they are:
Visualization is the act or an instance of visualizing. In psychology, it is a
technique involving focusing on positive mental images in order to
achieve a particular goal. It is also a kind of activity to form a mental
image of something or to make it visible.
(2) Desuggestopedia Teaching Method
Desuggestopedia is a teaching method developed by the Bulgarian
psychotherapist Georgi Lozanov. It is used in different fields, but mostly
in the field of foreign language learning. Lozanov has claimed that by
using this method a teacher's students can learn a language approximately
three to five times as quickly as through conventional teaching methods.
The theory applied positive suggestion in teaching when it was developed
in the 1970s. However, as the method improved, it has focused more on
“desuggestive learning” and now is often called “desuggestopedia.”
(3) Reading Comprehension
Reading comprehension is techniques for improving students' success in
extracting useful knowledge from text. Reading comprehension is
understanding a text that is read, or the process of "constructing meaning"
from a text. Comprehension is a "construction process" because it involves
all of the elements of the reading process working together as a text is read
1.8
Outline of the Report
The thesis consists of five chapters. The first chapter is Introduction. It consists of
Background of the Study, Reasons for Choosing the Topic, Statements of the
Problem, Objectives of the study, Hypothesis of the Study, Significance of the
Study, Definition of Terms, and Outline of the Report.
The second chapter is Review of Related Literature, consists of Review of
Theoretical Background: The Definition of Visualization, The Definition of
Desuggestopedia Teaching Method, The Definition of Reading and The
Definition of Reading Comprehension.
The third chapter is Method of Investigation, consists of Research Design,
Population, Sample and Sampling Technique, Research Variable, Experimental
Design, Instrument for Collecting Data and Procedure for Collecting Data.
Chapter four is Data Analysis and Interpretation, which consists of the
Result of Try-Out Analysis, the Significant Difference of the Pre-Test Result, the
Significant Difference of the Post-Test Result, and Discussion of the Research
Findings.
And the last is chapter five. This chapter gives Conclusions and
CHAPTER II
REVIEW OF RELATED LITERATURE
In this chapter presents review of theoretical background which contains
of definition of visualization, definition of desuggestopedia teaching method,
definition of reading, and definition of reading comprehension.
2.6
Definition of Visualization
According to Albert Foong (2007:69) as he wrote in his work “The Very Best of
Litemind”, everything we do begin as a thought. Every action, every word, every
human creation exists first in our imagination. The ability to see things before
they actually happen is what enables us to pursue our dreams and ultimately
achieve them. In fact, the better we visualize the future we want, the better our
chances to make it happen. Realism is the most important consideration in
visualization. Soldiers train in almost exactly the same gear they are going to wear
in combat. None of them got really good just by playing shooting games on the
computer or by playing paintball. Visualization is a very powerful tool for helping
achieving many goals.
Students will have much more chance of success at learning if they learn
to harness the possibilities of visualization in a positive way. Practice seeing
themselves in their mind as a successful student. Practice imagining that they find
their subjects very interesting, and that they already understand subjects really
well
(http://www.positivearticles.com/Article/Students---Use-Visualization-to-Improve-Your-Learning/2022).
It can be concluded that visualization is about exploring ways to use our
minds efficiently. This translates to being more creative, thinking more clearly,
boosting your brainpower, developing yourself and more.
2.7
Definition of Desuggestopedia Teaching Method
Diane Larsen and Freeman stated in their book entitled “Technique and Principles
in Language Teaching” (2001:73) that the desuggestopedia teaching method
which is illustrated by Celce-Murcia (1991:136) calls as an affectivehumanistic
approach, that is an approach in which there is respect for students‟ feeeling . The
originator of this method, Georgi Lazanov (1988:25) asserts, is that we set up
psychological barries to learning. According to Lazanov (1988:27), we may be
using only five to ten percent of our mental capacity. In order to make better use
of our reserved capacity, the limitations we think we have need to be
“desuggested”. „Desuggestopedia‟ the application of the study of suggestion to
pedagogy, has been developed to help students eliminate the feeling that they
cannot be successful or the negative association they may have toward studying
and to help them overcome the barriers to learning.
Tim Bowen (2000:47) said that the original form of suggestopedia
presented by Lozanov consisted of the use of extended dialogues, often several
pages in length, accompanied by vocabulary lists and observations on
to the accompaniment of music. The most formal of these readings, known as the
"concert reading", would typically employ a memorable piece of classical music
such as a Beethoven symphony. This would not be in the form of background
music but would be the main focus of the reading, with the teacher‟s voice acting
as a counterpoint to the music. Thus the "concert reading" could be seen as a kind
of pleasurable event, with the learners free to focus on the music, the text or a
combination of the two. The rhythm and intonation of the reading would be
exaggerated in order to fit in with the rhythm of the music.
Less formal reading would employ a lighter, less striking piece of music,
such as a piece of Baroque music, and this would take a less prominent role.
During both types of reading, the learners would sit in comfortable seats,
armchairs rather than classroom chairs, in a suitably stimulating environment in
terms of décor and lighting. After the readings of these long dialogues to the
accompaniment of music, the teacher would then make use of the dialogues for
more conventional language work. In theory at least, large chunks of the dialogues
would be internalized by the learners during the readings due both to the relaxed
and receptive state of the learners and to the positive suggestion created by the
music.
It can be said that the point of Desuggestopedia teaching method is a
nurturing, supportive atmosphere in which the student feels free to try out the new
information, be inventive with it, make mistakes without being put down, and, in
2.8
Definition of Reading
Reading is the process of constructing meaning from written texts. It is a complex
skill requiring the coordination of a number of interrelated sources of information
(Anderson et al., 1985:175). Learning to read means learning to bring meaning to
a text in order to get meaning from it.
According to Bowman (1991:265), reading is an appropriate means to
promote a lifelong learning. By teaching the children how to read means giving
these children a future which provides a technique to explore how “the world”
wherever he chose and provide the opportunity to get a goal in life. Reading is not
an easy learning activities. Many factors can affect student success in reading. In
general, these factors can be identified, such as teachers, students, environmental
conditions, subject matter, and techniques to learn the lesson material.
So it can be concluded that from reading we could get many advantages.
We could be able to practice our tongue and our pronunciation. Reading can also
bring us to see the content of world that we didn‟t know before. Besides that,
reading is also useful hobby. There are many techniques of reading such as
scanning, skimming, extensive reading, reading loudly, reading comprehension
and etc.
2.9
Definition of Reading Comprehension
According to Burn, Roe and Rose, ( 1984: 109), there are seven major types
of questioned based on comprehension skill, which can be useful in guiding
central theme of the selection, main idea helps them to be aware of details and
relationship among them. Then in detail, the point is to ask for bits of information
conveyed by the material. For vocabulary, the point is to ask for the meaning of
words used in selection. It can be used to check the students‟ understanding of
word meaning. There is sequence which requires knowledge of events in their
order of occurrences. The point of inference is to ask information that is implied
but not directly stated the material. To ask for judgment about material, we use
evaluation. In order to ask the children to go beyond the material and create new
ideas based on the ideas they read, creative response is required.
There are several strategies for teaching comprehension according to Burn,
Roe and Rose, ( 1984: 109). First, readers make connections between books they
read to their own lives. Children can make these connections with what they read
to their lives. Teachers can help their students connect on a larger scale. They can
connect things from books to real world happenings. By doing this, it enhances
the students' understanding.
Teachers can develop their instruction around certain components that help
readers find the connections and help them comprehend. The genre can range
from fiction, nonfiction, poetry, etc. When the reader experiences these and
become more familiar with each type of genre, they learn the special
characteristics and conventions of the genre. The reader also can learn about how
authors write about certain themes, topics, or issues. Readers can usually find a
topic they can enjoy from an author. Also the style the author writes in can
Questions are the key to understanding. They take us into understanding.
Students need to feel that their questions are important. We as teachers need to
model by asking and answering questions. When students ask questions they have
a desire to learn for understanding. This leads to comprehension.
Visualizing is creating pictures in our minds. When students visualize,
they create their 'own movie' in their minds. Teachers can use picture books that
do not have words to help the students make their mental movies.
When we read we create an image in our mind. We create an amalgam -
the conclusion we draw, the interpretation we create (Keene, p 126). We read and
create this image with what we know or have experienced. Things come alive
when we use sensory images. Teachers can help give these images through
lessons that evoke the thought processes.
Inferring is being able to read body languages and expressions while
reading the text. To help the students find inferences in picture books is to focus
on the illustrations. The pictures give clues to help gain meaning. Inferring is the
process of taking that which is stated in text and extrapolating it to one's life to
create a wholly original interpretation that, in turn, becomes part of one's beliefs
or knowledge (Keene, 1990:153). It is also using one's imagination or the use of
prediction. Teachers need to have their students try to make conclusions about the
reading and make reasonable predictions.
Reading comprehension is defined as the level of understanding of a writing text
and the content of the text. Proficient reading depends on the ability to recognize
much of their processing capacity to read individual words, which interferes with
their ability to comprehend what is read. It‟s clear that reading comprehension is a
complex cognitive process that depends upon a number of ingredients all working
together in a synchronous, even automatic way. Vocabulary clearly plays a critical
role in understanding what has been read. The reader must also be intentional and
thoughtful while reading, monitoring the words and their meaning as reading
progresses. And the reader must apply reading comprehension strategies as ways
to be sure that what is being read matches their expectations and builds on their
growing body of knowledge that is being stored for immediate or future reference
(Pressley, 2006:114).
It can be said that in reading comprehension, the reader not only read word
by word the text but the reader should also know the content of the text, what the
text tells about. The reader should also understand about the vocabulary difficult
words so it can enrich vocabulary building.
2.10
Application of Visualization in Desuggestopedia Teaching
Method in A Classroom
The application of Desuggestopedia teaching method in a classroom needs some
preparation (Lazanov, 1988:57). First, the teacher has to set up the armchair, then
make sure that the light is comfortable. Everything which is used in the classroom
must be bright and colorful. In reading the text, teacher speaks confidently and
and visualization. Teacher should integrate indirect positive suggestion (there is
no limit to what you can do) into the learning situation.
One of the ways the students‟ mental reserves are stimulated is through
integration of the fine arts-music and drama. To enhance students‟ feeling of
security and allow them to become more open, choosing a new identity is
required. Teacher introduces a story and begins a slow, dramatic reading, and
synchronized in intonation with the classical music. Students silply listen as the
teacher reads the text. After that, they playfully reread the text and they are asked
to visualize it in particular manner: sadly, angrily, and cheerfully. Those activities
designed to help them learn a new material and use it spontaneously in order to
comprehend the text which is given by the teacher.
It can be concluded that the goal of Desuggestopedia is building a good
learning atmosphere which is easy and with on pressure by various way and
properties including music and drama. Fostering the sense of trust between
teacher and students in order to bring up students‟ confidence of learning, and
face learning languages positively and not afraid of making mistakes and
CHAPTER III
METHOD OF INVESTIGATION
In chapter III provides the description of methodology used in conducting
the research. This chapter consists of some sub-sections, there are research design,
population, sample and sampling technique, research variables, experimental
design, instruments for collecting data, and procedure of collecting data.
3.8
Research Design
There are some designs in conducting a research. In this research, I used
quantitative method. Quantitative method is a numerical method of describing
observation of material characteristics. Here, statistical analysis is used to
calculate numeral data and to analyze the data by the use of correlation analysis.
The method of this research is experimental. According to Brown (1988:3)
“experimental studies is a whole range of different possible studies that
investigate the language behavior of groups under controlled conditions.” The
other definition is stated by Key (1997) which is “an experimental research is an
attempt by researcher to maintain control over all factors that may affect to
determine or predict what may occur” (http://www.okstate.edu/).
3.9
Population
Tuckman (1978:227) states that “population is the establishment of boundary
conditions that specify who shall be included in or excluded from the population.
The population (or target group) used in a questionnaire or interview study is that
group about which the researcher is interested in gaining information and drawing
conclusion.”
The population of this study was the eight grade students of SMP Negeri 1
Pati in the academic year 2011/2012. There were two classes of it. On the average,
each class consisted of 28 students, so all students of the eight grade students were
56.
The reason for choosing the eight grade students as population in this
study were based on these considerations, first the students met requirement to be
used as the population of the study. Then it was assumed that they have the
reading skill which was given in the seven grade students. And the last, I tried to
apply the visualization in Desuggestopedia teaching method to improve the
students‟ reading comprehension.
3.10
Sample and Sampling Technique
Tuckman (1978:231) states that “the primary issue in choosing a sample size is
that it is sufficient to assure the researcher that the sample will be representative
of the population from which it is done. While the researcher can never be certain
of this representativeness unless the entire population is tested, he or she can
establish that the sample is representative of the population on critical parameters
at an acceptable level of probability.”
I took VIII-A and VIII-B as the samples of the study. The technique of
of SMP Negeri 1 Pati had the same chance become the samples of the study. Then
I took three classes randomly, namely class VIII-A, VIII-B, and VIII-G. I took
class VIII-A as the experimental class, class VIII-B as the control class and class
VIII-G as the try-out class.
3.11
Research Variables
A great deal of research is carried out in order to explore the strength of
relationships between variables. To get the goal of the study, I tried to identify the
variable. Brown J. D. (1988:7) states that “in simplest terms, a variable is
something that may vary or differ”. There are two kinds of variables, namely
independent variable and dependent variable (Johnson, 1987:165). This
experiment that used visualization in Desuggestopedia teaching method to
improve the students‟ reading comprehension has two variables. The variables in
this study are:
(1) The independent variable (X)
Tuckman (1978:58) states that “the independent variable, which is a
stimulus variable or input, operates either within a person or within his or
her environment to effect behavior.”
In this study, the independent variable was the method of teaching reading
recount text of the both groups, that was the use of visualization in
Desuggestopedia teaching method to improve the students‟ reading
Desuggestopedia teaching method for the experimental group and using
conventional method for the control group.
(2) The dependent variable (Y)
Tuckman (1978:59) states that “the dependent variable is that factor which
is observed and measured to determine the effect of the independent
variable, that is, that factor that appears, disappears, or varies as the
experimenter introduces, removes, or varies the independent variable.” It
is a response variable or output, and an observed aspect of the behavior of
an organism that has been stimulated.
The dependent variable was the students‟ achievement in reading
comprehension of recount text. This study was meant to study the effect of
supporting material, in this case, the use of visualization in
Desuggestopedia teaching method to the students of eight grade students
of SMP Negeri 1 Pati.
Those two variables became the focus of this study. Basically, this study
was conducted in order to find out the relationship between two variables or the
influence a variable has on another variable.
3.5
Experimental Design
I administrated pre-test and post-test to both of the classes, namely experimental
class and control class. I did the treatment to the experimental class.
The design of the experimentation can be described as follows:
R O1 X O2
(Tuckman, 1978:131)
In which:
R : Experimental Group
O1 : Pre-test for the experimental group
X : Treatment for the experimental group
O2 : Post-test for the experimental group
R‟ : Control group
O3 : Pre-test for the control group
O4 : Post-test for the control group
3.6
Instruments for Collecting Data
Instrument is the most important thing in an experiment in which the reliability of
the instrument will automatically affect the reliability of the data obtained. The
instrument that I used in this research was reading test in multiple choice form. I
chose this type for some reasons:
(1) It will be easy to score multiple choice form than essay form.
(2) There is no subjectivity in scoring process.
(3) Multiple choice items represent the essence of material.
Each number in reading test consisted of four answers based on junior
high school grade and the students had to choose one from four answer were
3.6.1 Try Out
Before conducted the research, all the equipment should be prepared well,
includes the instrument for it. A good instrument must fulfill two requirements.
Two requirements are valid and reliable. Before I gave pre-test, treatment, and
post-test, the reading test had to be tried out first to the other class. I chose VIII-G
as the class to do the try out and the respondent is 34 students. the activities of
try-out had been held on August 15th 2011.
After conducting try out, the data compiled was analyzed to determine the
items are valid and reliable or not. The items which were not valid and reliable are
not used.
3.6.2 Validity of the Test
According to Gronlund (1998:226), “validity is the extent to which inferences
made from assessment result are appropriate, meaningful, and useful in terms of
the purpose of the assessment.”
Brown (1988:101) added that “test validity is defined as the degree to
which a test measures what it claims to be measuring”. It means that researchers
must use test that tap the variables of interest clearly as they operationalized.
While according to Tuckman, “the validity of a test represents the extent to which
Here, I used the moment product formula to calculate the validity of each
item. The formula is:
(Best, 1981:158)
Where:
N = number of paired scores
= the sum of the X scores (item score)
= the sum of the Y scores (the total item score)
= the sum of the squared X scores
= the sum of the squared Y scores
= the sum of the products of paired X and Y scores
3.6.3 Reliability of the Test
Reliability is one of the necessary requirements for test. The test could be said
properly to be used when they are reliable. According to Brown (2004:20),
“reliability is consistent and dependable”. It means that if the tests are given to the
same students or matched students on two different occasions, the test should
yield similar result.
The other opinion from Brown (1988:98), he states that “the reliability of a
test is defined as the extent to which the results can be considered consistent or
In which:
r
K
–
R20
= Kuder Richardson Reliability
n = the number of items in the test
pi and qi = the proportion of students responding correctly and incorrectly, respectively, to item I
s2 = test variance
(Tuckman, 1978:163)
In addition, in order to get the variance, the formula used is:
3.6.4 Item Difficulty
The item difficulty of test shows how easy or difficult the test items proved in the
test. In order to compute item difficulty, the formula used is:
(Gronlund, 1982:102)
Where:
ID = index of difficulty of item
RU = the number of students in the upper group who answer the item
correctly
r
K
–
R20
=
=
RL = the number of students in the lower group who answer the item
correctly
T = the total number of students in both the upper and the lower
group
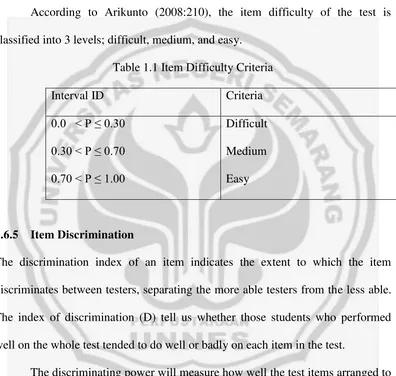
According to Arikunto (2008:210), the item difficulty of the test is
[image:36.595.119.515.219.595.2]classified into 3 levels; difficult, medium, and easy.
Table 1.1 Item Difficulty Criteria
Interval ID Criteria
0.0 < P ≤ 0.30
0.30 < P ≤ 0.70
0.70 < P ≤ 1.00
Difficult
Medium
Easy
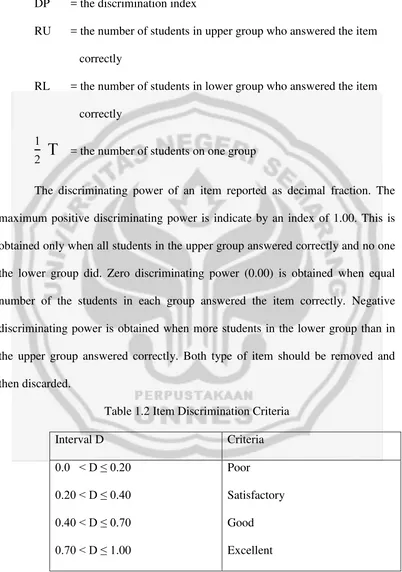
3.6.5 Item Discrimination
The discrimination index of an item indicates the extent to which the item
discriminates between testers, separating the more able testers from the less able.
The index of discrimination (D) tell us whether those students who performed
well on the whole test tended to do well or badly on each item in the test.
The discriminating power will measure how well the test items arranged to
identify the differences in the students‟ competence. The formula used in this
study is:
(Gronlund, 1982:103)
-Where:
DP = the discrimination index
RU = the number of students in upper group who answered the item
correctly
RL = the number of students in lower group who answered the item
correctly
= the number of students on one group
The discriminating power of an item reported as decimal fraction. The
maximum positive discriminating power is indicate by an index of 1.00. This is
obtained only when all students in the upper group answered correctly and no one
the lower group did. Zero discriminating power (0.00) is obtained when equal
number of the students in each group answered the item correctly. Negative
discriminating power is obtained when more students in the lower group than in
the upper group answered correctly. Both type of item should be removed and
[image:37.595.115.517.145.717.2]then discarded.
Table 1.2 Item Discrimination Criteria
Interval D Criteria
0.0 < D ≤ 0.20
0.20 < D ≤ 0.40
0.40 < D ≤ 0.70
0.70 < D ≤ 1.00
Poor
Satisfactory
Good
3.6.6 t-test
After collecting the data, I processed them statistically. The statistically
computation was used to analyze the data from two groups, namely experimental
group and control group.
t-test is used to know whether the difference of students‟ reading
comprehension between those taught using visualization in Desuggestopedia
teaching method and those taught without visualization in Desuggestopedia
teaching method or using conventional method only is significant or not.
The data analysis made use of the t-test as suggested by Tuckman
(1978:257) with the following steps (Table 1.3):
t = t-test
= mean of the experimental group
= mean of the control group
n1 = number of sample (experimental group)
n2 = number of sample (control group)
Group Experiment (1) Control (2)
N
Variants (s2)
Standard deviation (s)
s = standard deviation
3.7
Procedure of Collecting Data
The experimentation was conducted as follows:
(1) Choosing the eighth grade students of SMP Negeri 1 Pati as the population
of the study.
(2) Taking 2 classes randomly as the samples, one class is experimental class
and the other class is control class. I took class VIII-A as the experimental
class and class VIII-B as the control class.
(3) Conducting try out test to know the validity and reliability of the
instruments. I took class VIII-G as the Try-Out class.
(4) Doing the real experimentation.
3.7.1 The Activities of The Experimental Class
(a) Pre-test
Pre-test was given firstly before doing the treatment. The pre-test is aimed
at finding out the basic knowledge or the prior knowledge and the
students‟ ability in reading a recount text. Firstly, I came to the chosen
class. Then I explained to the students about what they were going to do.
Then I distributed the instruments and asked them to do the pre-test.
(b) Activities in the Treatment
In an experimental study, treatment is usually done to find out the
techniques. The experimental class was treated by using the visualization
in desuggestopedia teaching method to do reading a recount text. Then, the
students applid them in recount text. The materials of the treatment, which
I gave, are as follows: what recount text is; what the rhetorical steps of
recount are; what visualization in desuggestopedia teaching method is;
how the the visualization in recount text is carrried out.
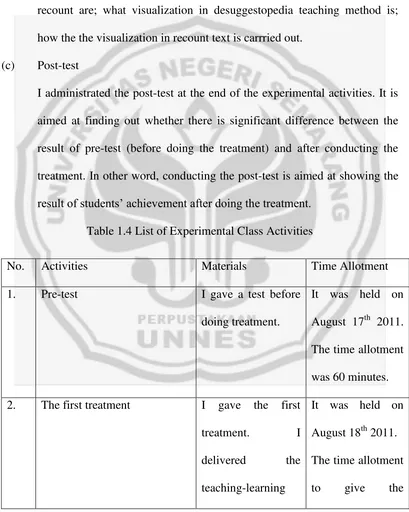
(c) Post-test
I administrated the post-test at the end of the experimental activities. It is
aimed at finding out whether there is significant difference between the
result of pre-test (before doing the treatment) and after conducting the
treatment. In other word, conducting the post-test is aimed at showing the
[image:40.595.112.521.221.733.2]result of students‟ achievement after doing the treatment.
Table 1.4 List of Experimental Class Activities
No. Activities Materials Time Allotment
1. Pre-test I gave a test before
doing treatment.
It was held on
August 17th 2011.
The time allotment
was 60 minutes.
2. The first treatment I gave the first
treatment. I
delivered the
teaching-learning
It was held on
August 18th 2011.
The time allotment
process based on the
desuggestopedia
teaching method
and visualized the
recount text which
is entitled
“Unforgettable
Holiday”
treatment was
1x40 minutes.
3. The second treatment I gave the second
treatment. I
delivered the
teaching-learning
process based on the
desuggestopedia
teaching method
and students
visualized the
recount text “Last
week, Mr. Sarwan‟s
wife…..”.
It was held on
August 18th 2011.
The time allotment
to give the
treatment was
1x40 minutes.
4. The third treatment I gave the third
treatment. I
delivered the
It was held on
August 22th 2011.
teaching-learning
process based on the
desuggestopedia
teaching method
and students
visualized the
recount text “Last
month, my family
and I…. “.
to give the
treatment was
1x40 minutes.
5. The fourth treatment I gave the fourth
treatment. I
delivered the
teaching-learning
process based on the
desuggestopedia
teaching method
and students
visualized the
recount text they
had composed.
It was held on
August 22th 2011.
The time allotment
to give the
treatment was
1x40 minutes.
6. Post-test I gave the last test
after doing all the
treatments.
It was held on
August 23th 2011.
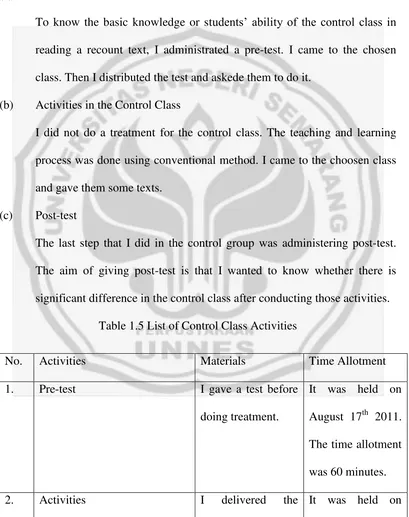
3.7.2 The Activities of the Control Class
(a) Pre-test
To know the basic knowledge or students‟ ability of the control class in
reading a recount text, I administrated a pre-test. I came to the chosen
class. Then I distributed the test and askede them to do it.
(b) Activities in the Control Class
I did not do a treatment for the control class. The teaching and learning
process was done using conventional method. I came to the choosen class
and gave them some texts.
(c) Post-test
The last step that I did in the control group was administering post-test.
The aim of giving post-test is that I wanted to know whether there is
[image:43.595.114.523.210.727.2]significant difference in the control class after conducting those activities.
Table 1.5 List of Control Class Activities
was 60 minutes.
No. Activities Materials Time Allotment
1. Pre-test I gave a test before
doing treatment.
It was held on
August 17th 2011.
The time allotment
was 60 minutes.
teaching-learning
process based on
the
grammar-translation teaching
method and gave
some recount texts
to be read by the
students. Those
were
“Unforgettable
Holiday”, recount
text “Last week,
Mr. Sarwan‟s
wife…..”, recount
text “Last month,
my family and I….
“.
August 18th 2011.
The time allotment
to give the
treatment was
2x40 minutes.
3. Post-test I gave the second
test which is called
post-test to the
students.
It was held on
August 23th 2011.
The time allotment
CHAPTER IV
DATA ANALYSIS AND INTERPRETATION
The fourth chapter discusses the analysis of data and interpretations. In
this chapter, there are the result of try-out analysis, the significant difference of
the pre-test result, the significant difference of the post-test result, and discussion
of the research findings.
4.5
The Result of Try-Out Analysis
Before the instrument was used to collect the data, I, firstly, had tried it out on 15th
August 2011 in VIII-G class of SMP Negeri 1 Pati. I chose this class because the
standard is similar and in the same school.
There were 34 students as the respondents of the try-out test group. They
had to complete the test consisting 35 items in 60 minutes. The test was in the
form of multiple choices. The test had 7 passages about recount text and four
distracters: A, B, C, and D, where one of the options was the answer. The students
would get a score of 100 if all the answers were correct.
After scoring the result of the try-out test, the next step was analyzing to
know the validity, reliability, item difficulty, and item discrimination of each item
in which to decide whether the items were properly used in the next test.
4.1.1 Validity
To get the validity of each item, I analyzed statistically. I used the moment
product formula as follows:
(Best, 1981:158)
Where:
N = number of paired scores
= the sum of the X scores (item score)
= the sum of the Y scores (the total item score)
= the sum of the squared X scores
= the sum of the squared Y scores
= the sum of the products of paired X and Y scores
Criteria: the item is valid if > r table
The following is the example of validity computation of item number 1
and for the other items will use the same formula.
From the computation above, the validity of item number 1 was 0.467. For
α = 5%, N = 34, and the rtable = 0.339. since the result of the instrument is higher
From the 35 items, it was obtained, 25 items were valid and the 10 items
were invalid. The invalid items were numbers 3, 5, 12, 13, 15, 16, 25, 30, 32, and
34. And the valid items were numbers 1, 2, 4, 6, 7, 8, 9, 10, 11, 14, 17, 18, 19, 20,
21, 22, 23, 24, 26, 27, 28, 29, 31, 33, and 35.
4.1.2 Reliability
In this research, I decided to use rK-R20 in measuring reliability of the test. This
formula used the number of items in the test, the proportion of students
responding correctly and incorrectly, respectively, to item 1, and test variance.
Consulting the rK-R20, the computation of the reliability of the test used
the following formula:
(Tuckman, 1978:163)
In which:
r
K
–
R20
= Kuder Richardson Reliability
n = the number of items in the test
pi and qi = the proportion of students responding correctly and incorrectly, respectively, to item I
s2 = test variance
In addition, in order to get the variance, the formula used is:
=
r
K
–
R20
=-Criteria: the instrument is reliable if r11 > rtable
From the computation above, I got some results. First, I computed S2 (Test
Variance), the result was 34.301. Then I took it into the rK-R20 formula and the
result was
0.825.
The result of computation showed that the estimated r11 was 0.825. then,
based on the table of critical rtable with significant level 5% for N = 34 is 0.339.
Due to the fact that the result of the computation was higher than the critical rtable,
it could be considered that the instrument was reliable.
4.1.3 Item Difficulty
The item of difficulty level is generally expressed as the percentage of the
students who answered the item correctly. I used this formula of item difficulty:
(Gronlund, 1982:102)
=
= 34.301
r
K
–
R20
=
= 0.825
Where:
ID = index of difficulty of item
RU = the number of students in the upper group who answer the item
correctly
RL = the number of students in the lower group who answer the item
correctly
T = the total number of students in both the upper and the lower
group
Criteria:
Interval ID Criteria
0.0 < P ≤ 0.30
0.30 < P ≤ 0.70
0.70 < P ≤ 1.00
Difficult
Medium
Easy
The following is the example of difficulty item computation of item
number 1 and for the other items will use the same formula (Table 1.6).
Upper Group Lower Group
No Code Score No Code Score
1 T-29 1 1 T-08 1
2 T-32 1 2 T-26 0
3 T-02 1 3 T-30 1
4 T-34 1 4 T-03 1
6 T-04 1 6 T-21 0
7 T-07 1 7 T-25 0
8 T-11 0 8 T-16 0
9 T-24 1 9 T-17 0
10 T-09 1 10 T-33 0
11 T-15 1 11 T-10 1
12 T-28 1 12 T-18 1
13 T-05 0 13 T-20 1
14 T-12 0 14 T-14 0
15 T-27 0 15 T-23 0
16 T-31 1 16 T-22 0
17 T-06 0 17 T-13 0
Sum 12 Sum 7
From the computation of item difficulty, I divided students in two groups.
They were upper group was 12 and lower group was 7. Then I took it into ID
formula with counted up upper group and lower group and divided with number
of students, so the result was 0.56. According to the criterions, the item difficulty
of number 1 is medium. ID
=
From overall computation of the item difficulty, it was found that 9 items
were categorized to be easy, 16 items were categorized to be medium, and 10
items were categorized to be difficult.
4.1.4 Item Discrimination
The item discrimination told us whether those students who performed well on the
whole test tended to do well or unwell on each item in the test. Item
discrimination or discriminating power can be obtained by using this following
formula:
(Gronlund, 1982:103)
Where:
DP = the discrimination index
RU = the number of students in upper group who answered the item
correctly
RL = the number of students in lower group who answered the item
correctly
= the number of students on one group
-Criteria
Interval D Criteria
0.0 < D ≤ 0.20
0.20 < D ≤ 0.40
0.40 < D ≤ 0.70
0.70 < D ≤ 1.00
Poor
Satisfactory
Good
Excellent
The following is the example of discrimination item computation of item
number 1 and for the other items will use the same formula (Table 1.7).
Upper Group Lower Group
No Code Score No Code Score
1 T-29 1 1 T-08 1
2 T-32 1 2 T-26 0
3 T-02 1 3 T-30 1
4 T-34 1 4 T-03 1
5 T-01 1 5 T-19 1
6 T-04 1 6 T-21 0
7 T-07 1 7 T-25 0
8 T-11 0 8 T-16 0
9 T-24 1 9 T-17 0
10 T-09 1 10 T-33 0
12 T-28 1 12 T-18 1
13 T-05 0 13 T-20 1
14 T-12 0 14 T-14 0
15 T-27 0 15 T-23 0
16 T-31 1 16 T-22 0
17 T-06 0 17 T-13 0
Sum 12 Sum 7
From the computation above, I divided students in two groups. They were
upper group was 12 and lower group was 7. Then I took it into DP formula with
subtract 7 from 12 and divided with number of students in upper group, so the
result was 0.29. According to the criterions, the item number 1 is satisfactory.
From the overall computation of item discrimination, it was found that 8
items were said to be poor, 21 items were said to be satisfactory, and 6 items were
said to be good.
According to the analysis of validity, reliability, difficulty level, and
discriminating power, it could be considered that 25 items were applicable for this DP
=
study. They were numbers 1, 2, 4, 6, 7, 8, 9, 10, 11, 14, 17, 18, 19, 20, 21, 22, 23,
24, 26, 27, 28, 29, 31, 33, and 35.
4.6
The Significant Difference of Pre-Test Result
After getting scores of pre-test from experimental group and control group, the
computation was made. Firstly, we got the results from two groups, like this
(Table 1.8):
To make the analysis more reliable, I analyzed it by using t-test formula as
stated in the chapter III. The significant difference between the two groups could
be seen by using this formula:
t = t-test
= mean of the experimental group
= mean of the control group
n1 = number of sample (experimental group)
n2 = number of sample (control group)
Group Experiment (e) Control (c)
N 28 27
2020 1948
72.14 72.15
Variance (s2) 133.3122 124.9003
Standard deviation (s) 11.546 11.176
s = standard deviation
Before applying the t-test formula, s had to be found out first. The step to
get s is:
After getting s, we could find out value by t-test:
From the computation above, I found out s first, the result was 11.366.
Then I put it into t-test formula with (mean of the experimental group), the
result was 72.14, (mean of the control group), the result was 72.15, n1 (number
of the sample in experimental group), it got from subtraction 1 from number of
students (28), so the result was 27, n2 (number of the sample in control group), it
t =
–=
–= -0.002
2
n
n
1
n
1
n
s
2 1 2 2 2 2 11
s
s
11.366
2
27
28
90
.
124
1
27
31
.
133
1
28
2
n
n
1
n
1
n
s
2 1 2 2 2 2 1got from subtraction 1 from number of students (27), so the result was 26. Then
applied it into t-test formula, the result was -0.002.
In α = 5% with df = 28 + 27 - 2 = 53, t(0.95)(53) = 1.67
-0.0017 1.67
With α = 0.05 and df = 53, the critical value of t is 1.67. Therefore, the Ho
accepted area was the value between -1.67 and 1.67. The obtained t value from
t-test is -0.0017 or -0.002 and it was located in the Ho accepted area. Because t was
located in the Ho accepted area, so it could be concluded that there was no
significant difference of final condition between experimental and control group
on the pre-test.
4.7
The Significant Difference of Post-Test Result
After getting scores of post-test from experimental group and control group, the
computation was made. Firstly, we got the results from two groups, like this
(Table 1.9):
Group Experiment (e) Control (c)
N 28 27
2392 2016
85.43 74.67
Variance (s2) 82.0317 55.3846
To make the analysis more reliable, I analyzed it by using t-test formula as
stated in the chapter III. The significant difference between the two groups could
be seen by using this formula:
t = t-test
= mean of the experimental group
= mean of the control group
n1 = number of sample (experimental group)
n2 = number of sample (control group)
s = standard deviation
Before applying the t-test formula, s had to be found out first. The step to
get s is:
Standard deviation (s) 9.06 7.44
t =
–2
n
n
1
n
1
n
s
2 1 2 2 2 2 11
s
s
8.30419
2
27
28
38
.
55
1
27
03
.
82
1
28
2
n
n
1
n
1
n
s
2 1 2 2 2 2 1After getting s, we could find out value by t-test:
From the computation above, I found out s first, the result was 8.30419.
Then I put it into t-test formula with (mean of the experimental group), the
result was 85.43, (mean of the control group), the result was 74.67, n1 (number
of the sample in experimental group), it got from subtraction 1 from number of
students (28), so the result was 27, n2 (number of the sample in control group), it
got from subtraction 1 from number of students (27), so the result was 26. Then
applied it into t-test formula, the result was 4.805.
In α = 5% with df = 28 + 27 - 2 = 53, t(0.95)(53) = 1.67
1.67 4.805
With α = 0.05 and df = 53, the critical value of t is 1.67. Therefore, the Ho
accepted area was the value between -1.67 and 1.67. The obtained t value from
t-test was 4.805 and it was located in the Ha refused area. Because t was located in
the Ha refused area