Optimal Kernel Parameters of Smooth-Windowed
Wigner-Ville Distribution for Power Quality Analysis
A.R. Abdullah
*1, N.H.T.H.Ahmad
2, A.Z.Shameri
3, N.A Abidullah
4, M.H. Jopri
5, E.F.Shair
6 1, 2, 4, 6Faculty of Electrical Engineering, Universiti Teknikal Malaysia Melaka, 76100 Durian Tunggal, Malaysia 3
Faculty of Electrical Engineering Universiti Teknologi Malaysia, 81310 Skudai, Malaysia 5
Faculty of Engineering Technology, Universiti Teknikal Malaysia Melaka, 75450 Ayer Keroh, Malaysia *1
[email protected]; 2 [email protected]; [email protected]; 4athira_abidullah@yahoocom; [email protected]; 6
Abstract- Bilinear time-frequency distributions (TFDs) are developed to represent time-varying signal jointly in time frequency representation (TFR). The TFDs offer a good time and frequency resolution, are appropriate to analyze power quality signals that consist of magnitude variation and multiple frequencies. However, the TFD suffers from cross-terms interferences because of their bilinear structures. In this paper, smooth-windowed Wigner-Ville distribution (SWWVD) is used to analyze power quality signals. The power quality signals are swell, sag, interruption, harmonic, interharmonic and transient. To get an accurate TFR, the parameters of the separable kernel are estimated from the signal. A set of performance measures are defined and used to compare the TFR for various kernel parameters. The comparison shows the signals with different parameters require different kernel settings in order to get the optimal TFR.
Keywords- Time-frequency Analysis; Power Quality; Bilinear Transformation
I. INTRODUCTION
The power quality issue has become major concern for electric utilities and user .It„s due to the growth of the electronic equipment used in industrial, commercial and domestic sector for example increasing used of solid state switching devices, nonlinear and power electronic switched, lighting control, computer and data processing [1-4].The main problem in industries is facing the distortion in electric supply. The low power quality can affect the lifetimes of loads, damaged, malfunction, instability, interruption and also affect the performance and economy. Thus, an automated monitoring system which is capable to estimate the presence of disturbance, accurately classify and also, characterize the disturbances is needed in order to improve the quality of signal and rectify the failure [3-5].
Time-frequency distributions (TFDs) are widely used to analyze power quality signal which represents the signal in jointly time-frequency representation (TFR) [3]. Previously, a popular method of linear TFD is short time Fourier transform (STFT). It uses a fixed analysis window [4] but has a major disadvantage that there is a compromise between time and frequency resolution. Alternatively, Wigner-Ville distribution, a bilinear TFD is a possible solution. It offers good time and frequency resolution but suffers from the presence of cross-terms interferences [4].This inhibits interpretation of its TFR, especially when the signal has multiple frequency components.
This paper focuses on application of the smooth-windowed Wigner-Ville distribution (SWWVD) to analyze power quality signals. The power quality signals are swell, sag, interruption, harmonic, interharmonic and transient. This TFD consists of a separable kernel whose parameters are estimated from the time-lag signal characteristics. From the appropriate choice of the kernel parameters, the auto-terms are preserved and the cross-terms removed. A set of performance measures are defined based on the main-lobe width (MLW), peak-to-side lobe ratio (PSLR), signal-to-cross-terms ratio (SCR) and absolute percentage error (APE) to quantify the accuracy of the resulting TFR.
II. SIGNAL MODEL
Power quality signals are divided into three classes: voltage variation for swell, sag and interruption signal, waveform distortion for harmonic and interharmonic signal, and transient signal. Signal models of the voltage variation, waveform distortion and transient signal are formed based on IEEE Std. 1159-1995 [5] and can be defined as
31
1 2
)
(
)
(
1k
k k
k t
f j
vv
t
e
A
t
t
z
(1)t f j t
f j
wd
t
e
Ae
z
(
)
21
22)
(
)
(
)
(
1 2 ) ( 2 / ) ( 25 . 1 3 1 1 2 1 2 1 1t
t
e
Ae
t
t
e
t
z
t t f j t t t k k k t f j transd
(3)elsewhere
0
0
for
1
)
(
1
kt
t
t
kt
k(4) where k is the signal component sequence, Ak is the signal component amplitude, f1 and f2 are the signal frequency, t is the time and (t) is a box function of the signal.
In this analysis, f1, t0, t1 and t3 are set at 50 Hz, 0 ms, 100 ms and 200 ms and other parameters are defined as below: 1. Swell: A1 = A3= 1, A2 = 1.2, t2 = 140 ms
2. Sag: A1 = A3 = 1, A2 = 0.8, t2 = 140 ms 3. Interruption: A1 = A3 = 1, A2 = 0, t2 =140 ms 4. Harmonic: A = 0.25, f2 = 250 Hz
5. Interharmonic: A = 0.25, f2 = 275 Hz
6. Transient: A = 0.5, f2 = 1000 Hz, td =15 ms, t2 =115 ms
III. SMOOTH-WINDOWED WIGNER-VILLE DISTRIBUTION The smooth-windowed Wigner-Ville distribution (SWWVD) [6] can be expressed as
d
e
w
t
K
t
H
f
t
z j ft swwvd z 2 ) ( ,
(
,
)
(
)
(
,
)
(
)
(5)where H(t) is the time-smooth (TS) function , w() is the lag-window function. Kz(t,) is the bilinear product of the signal of interest, z(t), and is further defined as
)
2
/
(
)
2
/
(
)
,
(
t
z
t
z
*t
K
z (6)In this paper, Hamming window is used as the lag-window and raised-cosine pulse as the TS function [6]. It defined as
g g
T
T
w
(
)
0
.
54
0
.
64
cos
,
(7)elsewhere 0 0 ) / cos( 1 ) (
t Tsm t Tsm
t
H
(8) The Doppler representation of this TS function obtained from the Fourier transform with respect to time is
) 2 / 1 ( )) 2 / 1 ( sin( 2 1 ) 2 / 1 ( )) 2 / 1 ( sin( 2 1 ) sin( ) ( sm sm sm sm sm sm T v T v T v T v vT vT v h
(9)It is a low-pass filter in the Doppler domain where the cutoff Doppler frequency is sm
c
3
/
2
T
(10)IV. TIME-LAG SIGNAL CHARACTERISTIC
The bilinear product in (6) is represented in time-lag representation which is used to determine the separable kernel parameters of the SWWVD. Generally, the time-lag representation can be defined in terms of auto-terms and cross-terms as
)
,
(
)
,
(
)
,
(
t
K
,t
K
,t
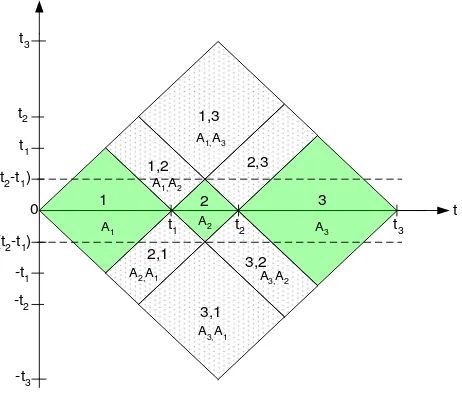
Voltage variation signal has a variation in the root mean square (RMS) value from nominal voltage [5]. The auto-terms and cross-terms for the signal in (1) are expressed as
)
,
(
)
,
(
, 1 2 3
1 2
,
t
K
e
A
t
K
k k k
f j
k vv
auto
(12)
3
1
2 3
1
,
(
,
)
,(
,
)
1
l k k
f j
l l k vv
cross
t
A
A
e
K
t
K
l
k
(13)
where k and l represent the signal component, Ak and Al are the signal components amplitude and the bilinear product of the box function, (t), is defined as
)
2
/
(
)
2
/
(
)
,
(
,
t
kt
t
k lt
t
lK
l
k
(14)Equations (12) and (13) show that the auto-terms lie along the time axis and are centered at = 0, while the cross-terms are elsewhere. Fig. 1 shows the time-lag signal representation and the auto-terms are highlighted in green while the cross-terms are densely dotted. Thus, to preserve the terms and suppress the cross-terms, the lag-window in (7) should cover all the auto-terms while removing the cross-auto-terms as much as possible. The lag-window width can be set as
1 2
t
t
T
g
(15)Since the cross-terms do not have Doppler-frequency terms as shown in (13), the TS function used in (8) is an impulse function. Therefore, only a lag-window is required and the resulting is known as the windowed Wigner-Ville distribution (WWVD).
t1 t2 t3
t1 t2 t3
0
-t1 -(t2-t1) (t2-t1)
-t2
-t3
t 2
1 3
1,2 1,3
2,3
2,1
3,1 3,2
A1 A3
A3,A2 A1,A2
A1,A3
A2
A2,A1
A3,A1
Fig. 1 Bilinear product of the voltage variation
Waveform distortion signal is a steady state signal which consists of multiple frequency components [7]. The auto-terms and cross-terms of the signal in (2) are defined as
2 1 2 2 2,
(
,
)
f j f
j zwd
auto
t
e
A
e
K
(16))
)
(
2
cos(
2
)
,
(
2 2 12
,
1 2
t
f
f
Ae
t
K
f f j zwd
cross
(17)As shown in (17), the cross-terms have a Doppler-frequency component at = (f2 - f1). To remove the cross-terms, the TS function is used with the Doppler cutoff frequency set as c ≤ |f2 - f1|. Thus, the TS function parameter, Tsm,can be set as
1 2
2 3
f f Tsm
In addition, the window is also used to obtain desirable frequency resolution in the TFR. By choosing the lag-frequency resolution less or equal to f1/2, the resulting TFR is able to differentiate harmonic and interharmonic frequency components. Higher lag-frequency resolution can be obtained with higher Tgbut it results in increased computation complexity and memory size to calculate the TFR.
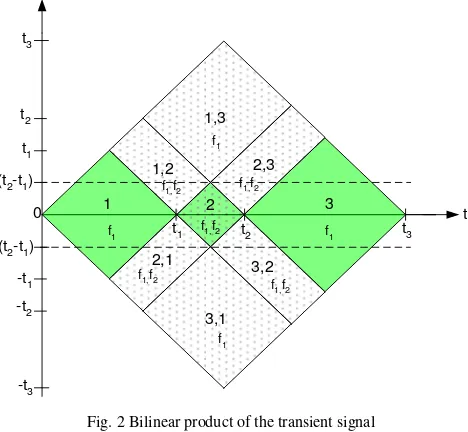
Transient signal is a sudden signal which changes in steady state condition at non-fundamental frequency [5]. From the signal model in (3), the auto-terms and cross-terms are expressed as
)
,
(
)
,
(
)
,
(
1 2 2,2,
1 2 2.5( ) 2
3 1 2 ,
t
K
e
e
A
t
K
e
t
K
t t j fk f j trans
auto kk
(19)
3 1 2 / ) ( 2 ) ( 2 2 / ) ( 2 3 1 ) ( 2 ) 2 / ( 25 . 1 3 1 3 1 2 ,)
,
(
)
,
(
)
,
(
)
,
(
2 , 1 2 1 2 1 2 , 2 1 2 1 2 1 2 1 , 1 k f f j t f t f f j f f j l t f t f f j t t l k k l f j cross transt
K
e
e
t
K
e
e
Ae
t
K
e
t
K
k l l k
(20)The locations of the auto-terms in (19) and the cross-terms in (20) are shown in Fig. 2. Similar to the voltage variation signal, the lag-window width is set at |Tg| ≤ (t2 - t1) to remove the cross-terms located away from the time axis and to preserve the auto-terms lying along the time axis. For this signal, the TS function is needed to remove the remaining cross-terms that have Doppler-frequency component. The cutoff Doppler-frequency of the TS function is set at c ≤ |f2 - f1| by setting Tsm as in (18).
t1 t2 t3
t1
t2 t3
0
-t1 -(t2-t1) (t2-t1)
-t2 -t3 t 2 1 3 1,2 1,3 2,3 2,1 3,1 3,2
f1 f1
f1,f2
f1 f1,f2
f1,f2 f1,f2
f1
f1,f2
Fig. 2 Bilinear product of the transient signal
V. PERFORMANCE MEASUREMENT
In this paper, the power quality signals are analyzed using SWWVD with various kernel parameters. The performance of TFR is compared in terms of main-lobe width (MLW), peak-to-side lobe ratio (PSLR), signal-to-cross-terms ratio (SCR) and absolute percentage error (APE). These measurements are adopted to evaluate the performance of the TFD in terms of its concentration, accuracy, resolution, and interference minimization [6].
Fig. 3 Performance measures used in the analysis
SCR is a ratio of signal to cross-terms power in dB. High SCR indicates high cross-terms suppression in the TFR. It can be calculated by
power) terms s power/cros signal
log( 10
SCR (21)
Besides the MLW, PSLR and SCR, APE is also applied to quantify the accuracy of the signal measurement. Details on this performance measure are discussed in [8] and can be expressed as
% 100
APE x
x x x
i m i
(22)
where xi is actual value and xm is measured value. Low APE shows high accuracy of the TFR. In general, an optimal kernel of TFD should have low MLW and APE while high PSLR and SCR.
VI. RESULTS
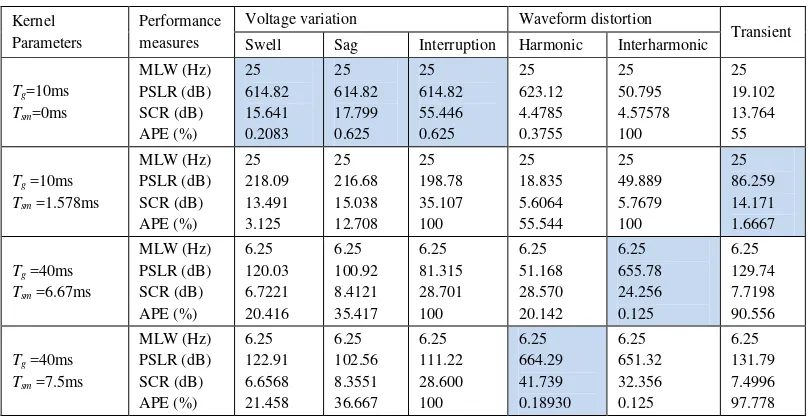
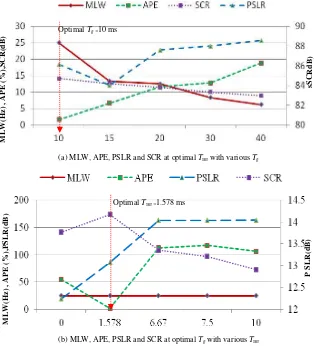
The best kernel parameters for the voltage variation signal are at Tg= 10 msand Tsm = 0ms. A bigger Tg will results in more cross-terms while higher Tsm is not necessary because the signal has no Doppler-frequency component. For the waveform distortion signal, the optimal Tg is 40ms,sufficient to differentiate between harmonic and interharmonic signals. The Tsm for harmonic and interharmonic depends on frequency difference in the signal components. From the signal model described in Section II, the optimal Tsm for harmonic and interharmonic signals are 7.5 and 6.67ms. The best parameters for transient signal are Tg= 10 ms and Tsm = 1.578ms because the transient duration is 15 ms and Doppler-frequency estimated from the time-lag representation is 525 Hz. The performance of SWWVD for various kernel parameters is shown in Table I.
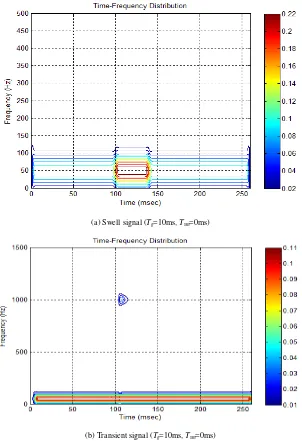
Fig. 4 shows the example of TFRs for the swell, transient and harmonic signals.
TABLE 1 PERFORMANCE COMPARISON OF SWWVD WITH VARIOUS KERNEL PARAMETER
Kernel Parameters
Performance measures
Voltage variation Waveform distortion
Transient Swell Sag Interruption Harmonic Interharmonic
Tg=10ms
Tsm=0ms
MLW (Hz) PSLR (dB) SCR (dB) APE (%)
25 614.82 15.641 0.2083
25 614.82 17.799 0.625
25 614.82 55.446 0.625
25 623.12 4.4785 0.3755
25 50.795 4.57578 100
25 19.102 13.764 55
Tg =10ms
Tsm =1.578ms
MLW (Hz) PSLR (dB) SCR (dB) APE (%)
25 218.09 13.491 3.125
25 216.68 15.038 12.708
25 198.78 35.107 100
25 18.835 5.6064 55.544
25 49.889 5.7679 100
25 86.259 14.171 1.6667
Tg =40ms
Tsm =6.67ms
MLW (Hz) PSLR (dB) SCR (dB) APE (%)
6.25 120.03 6.7221 20.416
6.25 100.92 8.4121 35.417
6.25 81.315 28.701 100
6.25 51.168 28.570 20.142
6.25 655.78 24.256 0.125
6.25 129.74 7.7198 90.556
Tg =40ms
Tsm =7.5ms
MLW (Hz) PSLR (dB) SCR (dB) APE (%)
6.25 122.91 6.6568 21.458
6.25 102.56 8.3551 36.667
6.25 111.22 28.600 100
6.25 664.29 41.739 0.18930
6.25 651.32 32.356 0.125
6.25 131.79 7.4996 97.778
0 500 1000 1500 2000 -100
-80 -60 -40 -20 0 20
frequency (Hz)
P
o
w
e
r
in
d
B
-3dB
MLW
(a) Swell signal (Tg=10ms, Tsm=0ms)
(b) Transient signal (Tg=10ms, Tsm=0ms)
(c) Harmonic signal (Tg=10ms, Tsm=0ms)
(a) MLW, APE, PSLR and SCR at optimal Tsm with various Tg
(b) MLW, APE, PSLR and SCR at optimal Tg with various Tsm
Fig. 5 Performance of TFR using SWWVD with various kernel parameter for transient signal.
In the contour plots, the red color represents the highest power while the blue color represents the lowest power.
Fig. 4a shows that the swell signal occurs between 100 and 140 ms while its frequency is 50 Hz. For the transient signal, its duration is between 100 and 115 ms and its frequency is 1000 Hz as shown in Fig. 4b.Meanwhile for the harmonic signal in Fig. 4c it consists three frequency component which is 50Hz, 350 Hz and 1000 Hz.Thus, the true characteristics of the signal is represent in TFR.
Fig. 5 shows the performance measure for transient signal at. optimal Tsm with various Tg and optimal Tgwith various Tsm.. The optimal kernel parameter for transient signal is obtained from Table 1 which is Tg =10 ms and Tsm = 1.578ms. Fig. 5a shows that at optimal Tsmand when Tgis set higher, the MLW is smaller indicating a higher frequency resolution of the TFR However, it suffers from the reduction of the cross-terms suppression which results in smaller. This because higher Tg covers more adjacent cross-terms in lag-axis in the bilinear product. As a result, the APE is higher which presents lower accuracy of the signal characteristic measurement.
Fig. 5b shows the optimal Tg and when Tsm is set higher than its optimal value, the SCR increases while the MLW remains constant. It indicates that higher Tsmimproves the cross-terms suppression and does not give any effect to the frequency resolution. However, the APE is also higher, which shows that the time resolution of the TFR is lower. This is because the application of TS function with higher Tsm increases the smearing of the auto-terms in time domain. Thus, there is a compromise between cross-terms suppression and time resolution to obtain optimal TFR.
VII. CONCLUSIONS
The TFR for power quality signals can be obtained using the SWWVD. For optimal TFR, the kernel parameters can be determined mathematically from the signal characteristics in time-lag representation with the objective to remove cross-terms and preserve auto-terms in the bilinear product. A set of performance measures were defined to compare the TFRs.
For voltage variation signal, only the Tg is adjusted to obtain accurate TFR while the waveform distortion and transient signals require the adjustment of both Tg and Tsm. From the TFR, the estimated signal parameters can be used to classify the power quality events signals.
Optimal Tsm =1.578 ms
M
L
W(
Hz)
,
A
P
E
(
%)
,PSL
R
(d
B
)
P
S
L
R
(d
B
)
Optimal Tg =10ms
M
L
W(
Hz)
,
A
P
E
(
%)
,S
C
R
(d
B
)
sS
C
R
d
B
ACKNOWLEDGMENT
The authors would like to thank Universiti Teknikal Malaysia Melaka (UTeM) for its financial support from PJP grant (PJP/2011/FKE(34C)/S00976) for sponsoring the resources for this research.
REFERENCES
[1] A R Rahim Abdullah, A.Z. Sha‟meri, N.A. Mohd Said, N. Mohd Saad, A. Jidin, “Bilinear Time-Frequency Analysis techniques for Power Quality Signals”, Proceedings of the International MultiConference of Engineers and Computer Scientists 2012, IMECS 2012. [2] Likhitha. R, A. Mnajunath, E.Pratibha, “Development of Mathematical model for Various PQ Signals and Its Validation for Power
Quality Analysis”, International Journal of Engineering Research and Development, Volume 1, Issue 3 (June 2012), pp. 37-44. [3] A. R. Abdullah, A. Z. Sha‟ameri and A. Jidin, “Classification of Power Quality Signals using Smooth-Windowed Wigner-Ville
Distribution”, Proceedings of IEEE International Conference on Electrical Machines and System (ICEMS 2010), pp. 1981-1985, Incheon, Korea, Oct. 2010.
[4] A. R. Abdullah and A. Z. Sha‟ameri, “Power Quality Analysis using Smooth-Windowed Wigner-Ville Distribution”, International Conference on Information Science, Signal Processing and their Applications (ISSPA 2010), pp. 798-801, 2010.
[5] T. J. Lynn and A. Z. Sha‟ameri, “Adaptive Optimal Kernel Smooth-Windowed Wigner-Ville Distribution for Digital Communication
Signal”, EURASIP Journal on Advances in Signal Processing, 2008.
[6] S. Mishra, C. N. Bhende and B. K. Panigrahi, “Detection and Classification of Power Quality Disturbances Using S-Transform and Probabilistic Neural Network”, IEEE Trans. on Power Delivery, Vol. 23, No. 1, pp. 280-287, Jan. 2008.
[7] A. R. Abdullah and A. Z. Sha‟ameri, “Power Quality Analysis using Linear Time-Frequency Distribution”, IEEE Int. Conf. on Power and Energy, Dec. 2008.
[8] B. R. Godoy, O. P. J. Pinto and L. Galotto, “Multiple Signal Processing Techniques Based Power Quality Disturbance Detection,
Classification, and Diagnostic Software”, Int. Conf. on Electrical Power Quality and Utilisation, pp. 1-6, Oct. 2007.
[9] R. Tomas, M. Vaclav, M. J. Fernando, R. Pedro and A. C. Serra, “On-line Detection and Classification of Power Quality Disturbances in a Single-phase Power System”, Int. Conf. on Power Eng., Energy and Elec. Drives, pp. 713-718, April 2007.
[10]K. Poh and P. Marziliano, “Analysis of Neonatal EEG signals using Stockwell Transform”, Int. Conf. on Eng. in Medicine and Biology Society, pp. 594-597, Aug. 2007.
[11]A. Moreno, Power Quality: Mitigation Technologies in a Distributed Environment, Springer, 2007.
[12]IEEE Recommended Practice for Monitoring Electrical Power Quality. IEEE Std. 1159-1995 Approved Jun. 14, 1995.
A.R Abdullah was born in Kedah, Malaysia in 1979. He received his B. Eng., Master, PhD Degree from University of Technology Malaysia in 2001, 2004 and 2011 in Electrical Engineering and Digital Signal Processing. He is currently a Senior Lecturer and Coordinator of Center of Excellent Robotic and Industrial Automation (CeRiA) in Universiti Teknikal Malaysia Melaka (UTeM).
N.H.T.H Ahmad was born in Terengganu Malaysia in 1986. She received diploma and B.Eng from Universiti Teknikal Malaysia Melaka in 2007 and 2010 respectively in Electrical Engineering and Control, Instrumentation and Automation. She is now continues her Master degree at same university in Digital Signal Processing.