1
SCOTTISH JOURNAL OF
ARTS,
SOCIAL SCIENCES
AND
SCIENTIFIC STUDIES
VOLUME 7, ISSUE I
DECEMBER, 2012
Articles
The Use of Multiple Linear Regressions in Determining the Relationship between
Housing Unit Price and Some Major Components in a Real Estate Building
3
Paul Boye 3
Consumption Pattern, Supplementation and Organoleptic Assessment of Plantain
(musa paradisiaca) and the Snacks Made from its Flour.
18
Bridget Uyoyou Nora Imonikebe 18
Impact of Gender Diversity on Organizational Performance in Telecom Sector of
Pakistan: The Moderating Role of Organizational Culture
32
S. M. M. Raza Naqvi 32
Maria Ishtiaq 32
Nousheen Kanwal 32
Samar Inderyas 32
Differences in the Linguistic Features of Text Messages send with an Alphanumeric
Multi-Press Keypad Mobile Phone versus a Full Keypad Touchscreen Smartphone50
Sarah Penelope Kent 50
Genevieve Marie Johnson 50
Continuous beam analysis using slope deflection and moment distribution method:
the difference
68
2
Vascular Plant Diversity of Osmaneli (Bilecik-Turkey).
78
Onur Koyuncu 78
Ö. Koray Yaylacı 78
Derviş Öztürk 78
Kurtuluş Özgişi 78
Okan Sezer 78
Filiz Savaroğlu 78
İsmühan Potoğlu Erkara 78
Atila Ocak 78
Human Thermal Comfort Situation in the City of Sakarya, Turkey
130
Yuksel Guclu,PhD 130
Economic Study of the Asian Region
137
Owen Tang 137
Po-wan SUN 137
Yui Yip Lau 137
Optimization of Machining Parameters in Turning Operation Using PSO and AIS
Algorithms: A Survey
147
Adnan, J.A. 147
Mohamad, B.M. 147
3
The Use of Multiple Linear
Regressions in Determining the
Relationship between Housing Unit
Price and Some Major Components in a
Real Estate Building
Paul Boye
University of Mines and Technology Department of Mathematics
Tarkwa, Ghana.
Abstract
Real estate is of most importance to any developing society as it usually one of the indicators for development. Pricing housing units by real estate developers usually depends on cost of materials and the profit margins set by the developers. This study seeks to find if there exist a relationship between housing unit price and some major components in a real estate building using Multiple Regression Analysis, Microsoft Excel and SPSS programs. A case study of housing units of Regimanual Gray Estate Developers of Ghana shows high consistency between housing units and the model analysis. The coefficient of determination
2R also suggests that approximately 98.7% of the total variation in the dependent variable was explained by the independent variables of the multiple regression model. Sensitivity analysis had been performed to show how ‘sensitive’ the model is to changes in the model coefficient parameters. The model is recommendable to be used for further researches to find the present value of a Single - Family Housing Unit by using the housing unit components.
4
Introduction
The problem of inadequate housing in developing countries including Ghana has become a very crucial one and may soon get out of control, especially due to rapid increasing population, uncontrollable urbanization, deterioration of rural mud and swish houses, and the high cost of building materials. As a result of aforementioned factors have resulted in the high cost of constructing houses and have worsened the housing situation in Ghana.
The issue of real estate valuation in Ghana is regulated by legal and professional standards. The term ‘real estate valuation’ denotes the process of valuing a real estate as the subject of the right of ownership and other rights to the real estate. Real estate can only be assessed by certified valuers. A real estate valuer is a person qualified to value real estate. The relevant certificate is issued by the Minister for works and Housing to the provision of the law of real estate management.
The valuation of real estate is a central tenet for all businesses. Land and property are factors of production and, as with any other asset, the value flows from the use to which it is put, and that in turn is dependent upon the demand and supply for the product that is produced. Valuation, in its simplest form, is the determination of the amount for which the property will transact on a particular date. However, there is a wide range of purposes for which valuation atr required. These range from valuations for purchase and sale, transfer, tax assessment, expropriation, inheritance or estate settlement, investment and financing (Bonbright, 1937).
Real property is defined as all the interests, benefits, rights and encumbrances inherent in the ownership of physical real estate, where real estate is the land together with all improvements that are permanently affixed to it and all appurtenances associated thereto (Pricier and Alec, 1996).
Due to the increasing significance attributed to real estate and its value in the process of taking various economic and political decisions, it has become necessary to develop and propagate knowledge of real estate buildings as well as the principles and methods of valuation used. The knowledge of real estate value and the basic factors which affect it are required of government and self-government administration workers.
The links between financial institutions, insurance companies and developers, on the other hand, and real estate owners on the other, are becoming noticeably stronger. These tendencies have resulted in the emergence of the real estate developers like Regimanuel Gray Ltd, SSNIT, Parakuo, Home Finance Company with the noble aim of providing adequate and affordable housing for Ghanaians.
Applying the principle of market economy to the decision-making process in real estate buildings has prompted a decision on unifying the opinions in the field as well as determining new areas of research, which would concern, for example, real estate valuation.
In this research, we seek to find a relationship between housing unit price and some major components such as plot size, building size, number of apartment units, number of car parking lots in a real estate building using Multiple Regression Analysis, Microsoft Excel and SPSS programs.
5
used Hedonic model to examine the effect of characteristics of goods on their prices. Factors that determined the house prices in Turkey were analyzed using 2004 Household Budget Survey Data. The most important variables that affected house rents were type of house, type of building, number of rooms, size, and other structural characteristics such as water system, pool, natural gas.
Ordinary Least Square (OLS) regression has typically been used in housing research to determine the relationship of a particular housing characteristic with selling price. Results differ across studies, not only in terms of size of OLS coefficients and statistical significance, but sometimes in direction of effect. Zietz et al., (2007) suggested that some of the observed variation in the estimated prices of housing characteristics may reflect in the fact that housing characteristics are not priced the same across a given distribution of house prices. To examine this issue, they used quantile regression, with and without accounting for spatial autocorrelation, to identify the coefficients of a large set of diverse variables across different quantiles. The results showed that purchasers of higher-priced homes value certain housing characteristics such as square footage and the number of bathrooms differently from buyers of lower-priced homes. Other variables such as age are also shown to vary across the distribution of house prices.
The housing market is special in that houses are immobile, costly and durable. Mynbaev and Ibrayeba (2011) looked at the determinants of prices of the housing market of Almaty. What affects the prices of houses and apartments? How was the housing market developing during the economic boom and after the financial crisis started? They started with a review of the existing models. The theory indicated the size, quality and location as the main determinants. To apply the hedonic model, They collected a random sample of about 2,500 observations on housing units in seven districts of Almaty from newspaper advertisements. Those units were categorized by the number of rooms, quality, district, floor, etc. Some of those characteristics were non-numerical and require dummy variables. With the data collected, They ran several regressions in Eviews. They obtained valuation figures for different characteristics of housing units. The data clearly showed existence of a bubble during 2006-2007. The regression results revealed the differences between different districts, dependence on the quality and floor. Among unexpected results were the facts that corner apartments and floor level had negative coefficients, perhaps because first floor apartments were considered as potential commercial property or perhaps lower stories were preferred in general but the first storey is the least preferred. Some questions, such as valuation of luxury apartments or those in the north of the city remain unanswered because of lack of data. It would be also interesting to correlate housing prices with the interest rate on mortgages.
6
Habans, (2004), analyzed the role of local land use policies in determining the levels and changes of housing prices in California cities between 1990 and 2000. Three models were developed. First, a cross-sectional model fits price levels to income, demographic, and regulatory variables that characterize the extent to which a given city’s land use policy reflects exclusivity or growth-hospitality. Second, a “before and after” transformation of the cross-sectional model compares housing price changes with variables that relate the extent to which local policy favors single-family, detached housing construction through the permits process. Third, the “initial conditions” model relates changes in housing prices to the permits variables. The models addressed potential endogeneity built in the permits variables with a two-stage least squares procedure. For each sampled municipality, the mentioned exclusivity and growth-hospitality variables, along with state-proposition voting outcomes, served as instrumental variables. On the whole, the regressions substantiated the hypotheses that both regulations and demographics influence housing prices.
Residential house prices in New Zealand (NZ) have experienced substantial increases even as the rate of house transactions began to slow down in 2007. Ge, (2009) developed house price forecasting models using Multiple Regression Analysis in order to analyze the main determinants of house prices in the New Zealand market. Quarterly time series data for the period from March 1980 to December 2007 were collected from the Department of Statistics and the Reserved Bank New Zealand for the model development. The estimated that house prices will fall after 2007 and will continue to fall in 2008 and 2009, and that migration plays an important role in determining house price fluctuation, so that a one-percent increase in migration arrivals was associated with approximately a ten- percent change in house prices with a one-year lag. Investment expectations, unemployment, mortgage rate and building permits were also the main determinants of price variations. The model showed that even before the sub-prime crisis hit New Zealand, the prices had been on the way down.
Sirmans, G.S. et al. (2005) provided a meta regression analysis of nine housing characteristics that were presented most often in hedonic pricing models for single-family housing: square footage, lot size, age, bedrooms, bathrooms, garage, swimming pool, fireplace, and air conditioning. Meta regression analysis is useful for comparing the estimated regression coefficients from different studies. The major interest is to determine if the estimated coefficients vary by geographical location, time, type of data, controlling for other variables, and model specification. The results showed that some estimated coefficients vary significantly by geographical location. These include square footage, lot size, age, bedrooms, bathrooms, garage, swimming pool, and air conditioning. Only the coefficient for age was sensitive to time. Controlling for type of data produced differences in coefficients for age, bathrooms, and fireplace. Only the air conditioning coefficient was affected by level of household income. Controlling for square footage produced lower coefficients for lot size and bedrooms. Controlling for the size of the hedonic model does not affect the coefficients for any of the characteristics.
7
total population. At the same time, he attempted to show the implication from the development and economic crises which occurred during period 1971 to 2000 towards the provision of low cost houses in Sabah. Empirical analyses were conducted using the multiple linear regression method, stepwise and also the dummy variable approach in demonstrating the link. The empirical result showed that the government’s budget for low-cost housing is the main contributor to the provision of low-cost housing in Sabah. The empirical decision also suggested that economic growth namely Gross Domestic Product (GDP) did not provide a significant effect to the low-cost housing in Sabah. However, almost all major crises that have beset upon Malaysia’s economy caused a significant and consistent effect to the low-cost housing in Sabah especially the financial crisis which occurred in mid 1997.
The spiraling increase in housing construction costs in Nigeria has been adduced to various factors such as the high cost of production and of building materials. Windapo and AIyagba (2007) sets to find out if there is any significant relationship between housing construction costs and economic factors proposed in the study as leading indicators of future levels of housing construction costs. It also sought to construct a model from the economic factors for use as predictors of future levels of housing construction costs. Literature was reviewed to aid the direction of the study. Data analyzed with the use of Pearson Product Moment Correlation and Multiple Regression Analysis was annual based over a fifteen-year period. The study revealed that future levels of housing construction cost in Nigeria could be predicted from future estimated levels of labor costs among other findings.
Yazgi, (2007) explored the spatial distribution of housing prices in the Metropolitan Area of Istanbul, the largest city of Turkey and the most important socioeconomic centre with a long historical background. After 1980s, multi-center development of the city played an important role for distribution of population, jobs and housing prices at the city level. By examining certain cases that were developed over time in different parts of the city, the factors affecting the housing prices were investigated. The samples were taken from three different zones: The core area, the intermediate zone, and the periphery. Housing prices were taken from real estate agents and presented with computer based techniques and with other variables collectively. Regression analysis was used for the investigation. Housing prices were considered as dependent variables while road area ratio, distance to the sea shore, distance to the center, floor area ratio, the size of the floor area of the houses and access-integration value as space-syntax indices were measured as independent variables. The results of the analysis indicated that the most important factor affecting the housing prices was the size of the floor area. The second and third most effective factors were the road surface ratio and the floor area ratio consecutively. The distance to the sea shore was fourth most important factor particularly for cities surrounded by a sea; such as Istanbul. The access-integration values as space-syntax indices were not found significant. The other factor distance to the center included in the analysis was not found significant, either. Results of this study could be useful for the investors, urban planners and the policy makers. Time series analysis was suggested for further research.
8
Budget Survey Data. The most important variables that affected house rents were type of house, type of building, number of rooms, size, and other structural characteristics such as water system, pool, natural gas.
Research on housing set out for various reasons but the focus of all research lies in the three main traits: price, affordability and ownership. Whilst affordability captures the attention of social scientist, an interest in property investment identifies price determinants and what actually paid for a house and whether the decision to invest in housing is guided by sufficient information. Yusof, (2008) analyzed the impact of macro and micro determinant of house price in five selected location in Malaysia. A literature review revealed that house price was determined by an inter play of some macro factors such as income per capita. Twelve macro models proved that economic indicators were significant in explaining the price variation. The finding indicated that for all models, economic growth plays an important role in price but as the income-related variables were included in the model, income-related variables gained significance. Thus, the regression models led to a conclusion that price was greatly influenced by income and income-related factors. While this finding pertains to the national and state level, local market was investigated via the development of hedonic equation. A total of twenty-six (26) models has been developed for five different locations in Malaysia. Transaction prices of secondary double storey terrace houses were regressed against the identified attributes and collected from secondary and primary sources. Appropriate statistical analysis was performed to minimize any potential technical disability in the model development which may affect the interpretation ability. Stepwise regression process was employed to eliminate multicollinearity that might affect the stability of the models. The analysis indicated that price was actually specific to a particular location. One location was greatly explained by building area, which means people are paying for larger area. Whilst in some other location, the price was significantly explained by the locational related factors. The finding for each location was quite consistent even though there was a tendency of shift in paying preference. For example Penang imposed higher implicit price observed in the model for distance factor, but in 2000s model showed that price was dominated by various factors. It shows that the implicit prices for each attribute vary from one year to another. Hence suggest that the price paid is not fixed but need adjustment from time to time. The findings thus suggests that it is quite impossible to draw general conclusion for the local market as it is influenced by factors or attributes that pertains to or specific to the particular market.
Yung, (2010) detailed the uses of multivariate regression method in construction cost studies. It covers most practical operations that students or researchers may encounter when undertaking similar studies. These include the treatment of original data, discounting of data with appropriate tender price indices, sample size, the use of dummy variables, hypothesis testing, interpretation of results, diagnosis of problems, etc. A demonstration with real data was also conducted to consolidate the ideas. It is believed that the practical method presented in this paper will help readers explore the rich database of the Building Cost Information Service compiled by the Royal Institution of Chartered Surveyors.
9
take longer time despite that the prevailing conditions seem similar. Several studies done especially on changes in prices of real estates revealed that real estate prices go through bubbles and slumps. Messah and Kigige (2011) investigated the factors at play in determining real estate property prices in Meru Munincipality in Kenya. They investigated factors such as incomes of real estate investors, the influence of location on the price, demand and realtors influence on the price. They adopted descriptive research design to obtain information on the current status of the phenomenon. Structured questionnaires were used in data collection to obtain the required information needed for the study. The population consisted of all 15,844 registered real estate owners in the 5 (five) selected areas of Meru municipality from which a sample of 390 real estate owners were selected by stratifying the population and then selecting the respondents by use of simple random sampling. The data obtained was analyzed by use of available statistical packages for social sciences to obtain descriptive statistics and a regression model. Findings indicated that incomes alone contributed almost 70% of the variations in prices. Demand alone contributed 20% of the changes in prices of real estate. Location and Realtors were found insignificant in determining real estate prices. A summary regression showed that the variables considered could explain up to about 70% of variations in prices. The study recommended that further investigation be done on reasons why location and realtors were not significant in determining real estate property prices in Meru municipality.
The hedonic pricing model has been employed with a degree of success in housing market analysis in developed countries. Babawale, et al. (2012) demonstrated the potentials of the same technique to the study of housing markets in a developing country like Nigeria. They used data from Ikeja area of Lagos state, Nigeria, to provide empirical evidence on market parameters that described the hedonic price structure for apartments (flats) in a typical Nigerian city. Primary data were elicited through structured questionnaire, complemented with selective interviews and personal observations. The results revealed that number of bedrooms, condition of the property, availability of pipe-borne water, average size of bedrooms, and numbers of bath/toilets, in that order, were the main descriptors of apartment rentals in the study area. The results of this empirical investigation are of particular importance to investors, developers, financiers, and real estate valuers operating in the property sub-market under consideration. Among others, adequate knowledge of issues investigated and raised would assist developers to build to consumer tastes and preferences. The resulting model also provided an alternative to traditional valuation techniques and afforded greater flexibility in accounting for sustainability in real estate valuation.
10
This paper analyzed the main determinants of real estate prices. Investigation of Kiev real estate market confirmed the influence of different macro and micro factors on real estate market. Mavrodiy, (2005) examined the effect of changes in Gross Domestic Product (GDP), income level, population and interest rate. The analysis inferred the direct relationship between GDP, income level, population and housing prices. It was observed that interest rate affected price level negatively. Examination results also provided the evidence of the relationship between micro factors and housing prices. Location and qualitative attributes appeared to have significant effect on real estate prices.
Description of the Study Area
The study area is in Accra the capital of Ghana and has a geographic location of 5°33'N latitude and 0°15'W longitude. Accra is in the Southern part of Ghana which is very close to the Gulf of Guinea (fig. 1).
Fig. 1 Location map of the Study Area
History of Regimanuel Gray Ltd.
11
Materials and Methodology
In this study, we used multiple linear regression to model the relationship between housing unit price
Y and some major components of a Single-Family apartment
Xi .The independent variables in the model were number of apartment units, plot size, gross area of building, and number of site parking spaces.
Model:
0 1 1 ni i i
E y X
; where i1, 2,3, 4.This study utilized the sample data in Table 1, to examine the relationship between the dependent variable and the independent variables.
Hypotesis Testing
0
H : 1 2 ... k 0 There are no significant differences among the parameter
coefficients
1
H : j 0 for at least one j. There are significant differences among the parameter
coefficients.
Results
12
Table 1: Sample Data Comps
Code number
Sales price
Y ($ )Number of apartment units ( x1 )
Plotsize(x2)
(sq. meter)
Gross Area (Sq.meter ) ( x3 )
Number of sitepacking spaces ( x4 )
RG- 5E 88400 20 8000 248 2
RG- 5E 99600 23 8000 279 2
RG- 7 26400 8 5600 96 0
RG-7 45000 16 5600 178 0
RG-9F 55100 16 6000 182 0
RG-11 135700 22 8000 339 2
RG-12 133700 22 8000 334 2
RG-1 16000 14 2800 76 0
RG-2 19800 7 5200 82 2
RG- 2 22500 7 5200 82 2
RG-2 23000 8 5200 96 2
RG-2 27800 8 5200 96 2
RG-2 28800 10 5200 120 1
RG-2 32700 11 5200 140 1
RG-2 34800 10 5200 120 1
RG-2 38700 11 5200 120 1
RG-2C 42800 12 5200 178 1
RG-2C 50300 12 5200 178 1
RG-2C 46000 12 5200 192 1
RG-2C 55600 12 5200 192 1
Table 2: Computed Anova for the Linear Model
SOURCE OF VARIATION SUM OF SQUARES DEGREES OF FREEDOM MEAN SQUARE F- STATISTIC Test Statistic
REGRESSION 2.466778E10 4 6166945000 101.029983 2.7278
ERROR 1648100000 27 61040740.74
TOTAL 2.631588E10 31
Tables 3a and 3b were the results of the sensitivity analysis performed by varying Beta-zero in the range of ±1.
Table 3 a
Confidence Level 1.00 0.50 0.00 -0.50 -1.00
Beta Value -25796.78 1452.61 0.13 316.31 2583.11
Beta New -25795.80 1452.61 -25796.80 -25797.30 -25797.80
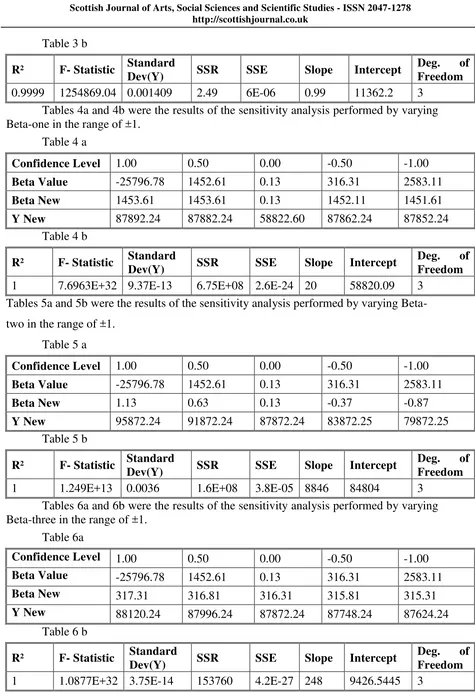
13 Table 3 b
R² F- Statistic Standard
Dev(Y) SSR SSE Slope Intercept
Deg. of Freedom
0.9999 1254869.04 0.001409 2.49 6E-06 0.99 11362.2 3
Tables 4a and 4b were the results of the sensitivity analysis performed by varying Beta-one in the range of ±1.
Table 4 a
Confidence Level 1.00 0.50 0.00 -0.50 -1.00
Beta Value -25796.78 1452.61 0.13 316.31 2583.11
Beta New 1453.61 1453.61 0.13 1452.11 1451.61
Y New 87892.24 87882.24 58822.60 87862.24 87852.24
Table 4 b
R² F- Statistic Standard
Dev(Y) SSR SSE Slope Intercept
Deg. of Freedom
1 7.6963E+32 9.37E-13 6.75E+08 2.6E-24 20 58820.09 3
Tables 5a and 5b were the results of the sensitivity analysis performed by varying Beta-two in the range of ±1.
Table 5 a
Confidence Level 1.00 0.50 0.00 -0.50 -1.00
Beta Value -25796.78 1452.61 0.13 316.31 2583.11
Beta New 1.13 0.63 0.13 -0.37 -0.87
Y New 95872.24 91872.24 87872.24 83872.25 79872.25
Table 5 b
R² F- Statistic Standard
Dev(Y) SSR SSE Slope Intercept
Deg. of Freedom
1 1.249E+13 0.0036 1.6E+08 3.8E-05 8846 84804 3
Tables 6a and 6b were the results of the sensitivity analysis performed by varying Beta-three in the range of ±1.
Table 6a
Confidence Level 1.00 0.50 0.00 -0.50 -1.00
Beta Value -25796.78 1452.61 0.13 316.31 2583.11
Beta New 317.31 316.81 316.31 315.81 315.31
Y New 88120.24 87996.24 87872.24 87748.24 87624.24
Table 6 b
R² F- Statistic Standard
Dev(Y) SSR SSE Slope Intercept
Deg. of Freedom
14
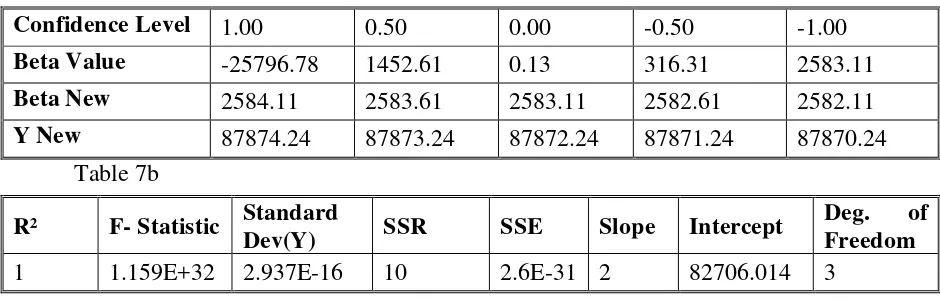
Tables 7a and 7b were the results of the sensitivity analysis performed by varying Beta-four in the range of ±1.
Table 7a
Confidence Level 1.00 0.50 0.00 -0.50 -1.00
Beta Value -25796.78 1452.61 0.13 316.31 2583.11
Beta New 2584.11 2583.61 2583.11 2582.61 2582.11
Y New 87874.24 87873.24 87872.24 87871.24 87870.24
Table 7b
R² F- Statistic Standard
Dev(Y) SSR SSE Slope Intercept
Deg. of Freedom
1 1.159E+32 2.937E-16 10 2.6E-31 2 82706.014 3
Discussion of Results
Table 2 presents information on hypothesis as measured by F- statistic to determine the statistical significant predictive capability of the model. Since the computed F-statistic is 101.029983 which is greater than the test statistic
0.05,4,27 2.7278
f , the null hypothesis is rejected and we concluded that the independent variables contributed significantly to the estimated model.
Results of Beta zero does not represent coefficient of any housing unit component. Tables 3a and 3b showed a minimal variation in Ynew values, which indicates
that the model does not change in the range of ± 1 variation. The coefficient of determination (R2) was 0.9999 which indicates that there is a very good fit of the data to the model. The standard deviation in Y is also very small. This explains the variation in
Y our knowledge of Xi full of error brings to bear. Smaller deviations, better
predictions.
Results of Beta one is the coefficient representing the number of housing units and its usefulness to the model. Tables 4a and 4b showed minimal variations forYnew,
which indicates that the model does not change in the range of ± 1 variation. The coefficient of determination (R2) was 1, which indicates that the data fits the model perfectly well. The standard deviation in Y is also very small. This explains the variation in Y our knowledge of Xi full of error brings to bear. Smaller deviations, better
predictions.
Results of Beta two is the coefficient representing the plot size and its usefulness to the model. Tables 5a and 5b showed minimal variations forYnew, which indicates that
the model does not change in the range of ± 1 variation. The coefficient of determination (R2) was 1, which indicates that the data fits the model perfectly well. The standard deviation in Y is also very small. This explains the variation in Y our knowledge of Xi
15
Results of Beta three is the coefficient representing the gross area of building and its usefulness to the model. Tables 6a and 6b showed minimal variations forYnew, which
indicates that the model does not change in the range of ± 1 variation. The coefficient of determination (R2) was 1, which indicates that the data fits the model perfectly well. The standard deviation in Y is also very small. This explains the variation in Y our
knowledge of Xi full of error brings to bear. Smaller deviations, better predictions.
Results of Beta four is the coefficient representing the number of site parking spaces and its usefulness to the model. Tables 7a and 7b showed minimal variations for
new
Y , which indicates that the model does not change in the range of ± 1 variation. The
coefficient of determination (R2) was 1, which indicates that the data fits the model perfectly well. The standard deviation in Y is also very small. This explains the variation in Y our knowledge of Xi full of error brings to bear. Smaller deviations, better
predictions.
Conclusion
From the above research findings, it is clear that the estimated model does not only fits the data very well, but also shows a perfect relationship between housing unit price and some major components both within and around the real estate building. The following are the conclusions from the research:
(i) The multiple coefficient of determination calculation (R2) made revealed that the
four independent variables in the model explained 93.74% of the total variation of
the dependent variable. This shows that there exists a verygood fit of the Multiple regression model to the sample data.
(ii) The residuals obtained do not only appear to behave randomly, but also suggests
that the model fits the data well.
(iii) From all the five sensitivity analysis carried out, the statistical outputs show that
all the four parameters that were varied in the range of ±1 has no significant effect on the output results.
Acknowledgement:
16
References
Anon, (2005) “Ground Floor Plan” Regimanuel Gray Estates, pp1
Ameen, J. R. M, Neale, R. H., and Abrahamson, M. (2003). “An application of regression analysis to quantify a claim for increased costs” . Journal of
Construction Management and Economics, U.K., Vol.2; pp.159-167.
Bonbright, J.C. (1937): “The valuation of property”, New York: MC Graw Hill. Vol. 7; pp.18 – 33.
Castle and Gilbert, (1998): “Property Investment & Finance” Journal of brokers participating in transactions.Vol.1; pp. 59- 66.
Cohen Jacob (2003), Applied Multiple Regression/Correlation Analysis for the Behavioral Sciences, Routledge Academic; Third edition, pp. 480 - 499.
Doane P. David, Lori E. Seward (2000), Applied Statistics for Business and Economics, Irwin/mcgraw-hill, pp. 91- 110.
Eple R. Donald, Burns William (2004), “Real estate and insurance business” Journal of the American Real Estate and Urban Economics Association, Vol. 6, Issue 1, 1978.
Friedman, S.L. (1979) ‘Use of multiple regression analysis to test for a deferent effect of capital punishment- prospects and problems’. From Criminology Review Yearbook, V1, 1979 by Sheldon L Messinger and Egon Bittner-See NCJ-60767.
John D. Benjamin, (2004), “ An Introduction to Multiple Regression Analysis for Real Estate Valuation” Journal, Vol.7, pp.65-78).
Kazmierczak, S. C. , Catrou, P. G. , Best, A. E. , Sullivan, S. , W. and Briley, K. P. (1998). “Multiple regression analysis of interference effects from a
hemoglobin-based oxygen carrier solution” Journal of Clinical chemistry and laboratory medicine, Spain. Volume 37. Page 453-464
Kruse, C. G., Hubert, W. A., (1998).”Single-Pass Electro fishing Predicts Trout Abundance in Mountain Streams with Sparse Habitat”, Journal of Fisheries Management, USA. Vol. 112, PP. 451-469.
Kucharik, J. C.(2008)“Contribution of Planting Date Trends to Increased Maize Yields in the Central United States” Agronomy journal, USA. Vol.3; PP. 451- 469.
17
Morris Hamburg (1993), Statistical Analysis for Decision Makers, Springer, pp. 451-469.
Nick French, Edwards Jonathan (2003), “The Journal of Business”, Journal of Property Investment & Finance, Vol.2, pp.617- 632.
Pannell, J.D.(1997), Sensitivity and uncertainty analysis, John Wiley & Sons, pp.
337- 350).
Pricier W. Robert, Alec C. Johnson (1996), “Dallas Business Journal”: Journal of Small Business Management, Vol.32; PP.27-35.
Satish, K. P.,Srinivasan, R. (2010). ‘Total quality management and its impact on innovation performance’ International Journal of Electronic Customer
Relationship Management,India. Vol. 4, PP. 19-32.
Tooru, S. (2003).‘Application of Multiple Regression Analysis to Extract Promising Areas of Kuroko Deposits in the Hokuroku Area’. Journal of the Mining and Materials Processing Institute of Japan. Vol. 119, PP. 149-154.
William Dale Berry, Stanley Feldman (1985), Multiple regression in Practice,
Sage Publications, pp. 37- 50.
Yongjae, K., Sehun, R., (1989 )‘Arc sensor model using multiple-regression analysis and a neural network’ Mechanical Engineering Publications, London. Vol. 73; PP. 363-369.
18
Consumption Pattern,
Supplementation and Organoleptic
Assessment of Plantain (musa
paradisiaca) and the Snacks Made from
its Flour.
Bridget Uyoyou Nora Imonikebe
Home Economics Unit, Vocational Education Department Delta State University, Abraka, Nigeria.
E-Mail: [email protected]
Abstract
The study investigated various forms of the use of plantain in meal preparation in Isoko North Local Government Area in Delta State, Nigeria and the production from the flour cheap nutritious acceptable food for infants, adolescents and adults. A sample of 400 mothers from various occupational groups was randomly selected. Questionnaire was used for data collection. A – 6 point scale was used to access the sensory properties of the flour products (chinchin, fish pie and pancake) by 40 mothers. Percentage, means, analysis of variance (ANOVA) were used for data analysis Duncan’s New Multiple Range Test was used to detect the means that were different. Findings showed that plantain was consumed by most people once a week, some prefer eating it whenever it was available and when boiled or as pottage. Mashed plantain was fed to infants as weaning food. The plantain wheat flour pancakes, fish pies and chinchin were acceptable to the mothers. It was recommended that mothers in Isoko North should give pancake, fish pies and chinchin made from plantain wheat flour to their family members especially the adolescents.
Keywords: Plantain, Meal preparation, flour products, Fish pie, pancake, chinchin ,
19
Introduction
At present, the population of Nigeria was been increasing rapidly. This has made it difficult for most families to feed adequately. This has led o malnutrition. World Bank (1993) reported that a third part of the world is poor, hungry and malnourished. During harvest, season, there is usually abundance of food stuffs. However much of these get wasted due to inappropriate and inadequate methods of processing, preservation and storage. As a result of post harvest losses, there is much reduction in the total amount of food left to feed the growing populace. If food can be well processed, it could increase its shelf life and make it to be available even when out of season.
A lot of plant foods are consumed in Nigeria. Examples are yam, plantain, rice, beans and maize. Plant based foods are cheaper and form the larger proportion of the food consumed by many Nigerians. These form the major sources of energy, protein and small quantities of other nutrients. Plantain, cassava and yam form the primary sources of carbohydrates (Imonikebe 2007). Plantains are prepared and eaten in various forms. They are eaten alone or in combination with legumes or with fried eggs. Plantain is mixed with palm oil or eaten as pottage (Imonikebe 2007). Plantains cultivated in many parts of Nigeria.
Much of plant foods are usually consumed. One setback in the consumption of plant foods is that they contain only some essential amino acids. They also contain anti-nutritional factors which lead to interference with the availability of such nutrients present in the food that are needed for adequate body functioning (Imonikebe 2007). Any measure which could improve the nutritional quality, shelf life, organolephtic qualities, reduce bulk to enhance storage and promote the use of local staples and could minimize hunger and malnutrition will be of great importance. One of such methods is food processing.
Food processing enhances the quality of food because foodstuffs are converted to forms which may be more acceptable and may be completely different from the original food in terms of odour, taste, flavour, appearance and texture (Enwere 1998). Most of the time the processed food may have a longer shelf life than the original food. Food processing usually improves the nutrient quality of plant foods and enhances nutritional quality.
Plantain is abundantly eaten in various forms boiled, roasted or stewed. Processing of plantain into flour can increase its shelf life and allow for supplementation with other food items. Plantain is used as a complementary food mixed with palm oil. The continuous dependence on the consumption of such unsupplemented foods could precipitate under - nutrition. When processed into flour, plantain can be supplemented with soy, and other foods especially as flours.
20
Purpose of the Study
The purpose of the study was to find out the consumption pattern of plantain and to process it into flour and supplement with wheat flour for the production of chinchin pancakes and fish pies.
Objectives of the Study
1. To identify the consumption pattern of plantain in Isoko North Local Government Area, Delta State in Nigeria.
2. To process plantain into flour and supplement with wheat flour for the preparation of chinchin fish pies and pancakes.
3. To evaluate the sensory properties of the snacks.
Materials and Methods
The study investigated the consumption pattern of plantain in Isoko North Local Government Area in Delta State. The study was also on the production of plantain flour and the organoleptic evaluation of the supplemented products (chin-chin, pancake and fish pies)
Sampling Techniques: A systematic random sampling technique was used to obtain the sample. Six towns Owhelogbo, Ozoro, lyede, Otibio, Otor-Owhe and Emevor were sources of sample (subjects). These towns are in the rain forest region of Nigeria. The major occupations of these communities are teaching, farming, trading and civil service. The subjects were married women (400), who had up to two children in Isoko North Local Government Area.
Preparation of Samples: The plantain were purchased from local sources, washed with clean cold water to remove dirt, after which they were peeled, sun dried to 95% dry matter The thin slices were crushed and milled into fine flour (70 mesh) using a local grinding machine. The flour was allowed to cool prior to name labeling and packaging into polythene bags and stored in air-tight tins until used.
Organoleptic Attributes of Samples: A recipe was developed from plantain flour and used for preparation of chin-chin, fish pies and pancakes. A pilot tasting session was conducted to standardize the recipe. Ten Economics teachers from six secondary schools in lsoko North Local Government Area served as panelists. After session of tasting, some adjustments were made on the recipes: Several tasting sessions were made on each product. The panelists were asked to tick their responses into the checklist questionnaire based on their opinions about each product A 6-point hedonic scale was used for the sensory evaluation (Piggot 1984) of the plantain products. A mean score 3.50-6.00 indicated that the product was palatable and below this showed unpalatability. Another 6-point hedonic scale was used to evaluate the flavour, colour, texture and overall acceptability of the product. A mean score 3.50-6.00 showed that the product was liked by members of taste panel and below 3.50 showed dislike.
Preparation of Plantain Products: The plantain flour was supplemented with wheat flour in ratio of 50:50 and 70:30 and used to prepare some dishes (pancakes, fish pies and chin-chin). These were served with orange drink as accompaniment. The snacks were displayed to a panel of 40 judges for assessment. Prior to tasting, the panelists were educated on how to conduct the tasting and assessment of qualities of each sample.
21
study Each panelist was given a small saucer to place the sample, a teaspoon for taking a portion of the sample, and a glass of clean drinking water. Each person was advised to rinse mouth after tasting each product to prevent a carryover of taste. Each panelist was given evaluation form for each product. They evaluated each product and ticked the attributes that corresponded with their observations. The forms were retrieved at the end of the session.
Statistical Analysis: The data collected were analysed using percentages, mean, standard deviations, variance, standard error of the mean, One Way Analysis of Variance.
The mean separation was conducted using Duncan’s New Multiple Range Test as Steel
and Torrie (1960).
Results
Age range of the mothers
Table 1 presented the age range of the mothers. The women who were between 31-40 years were 154 (38.4%) of the total subjects (400). However, those between 20-30 years and above 40 years were 123 or 30 8% respectively
Qualification of the mothers
Finding showed that 30 (7.50%) of the subjects had either no formal education or First School Leaving Certificate or WASC/Teachers Grade II Certificate. Sixty-two (15.5%) had BSc/BA/BEd. Some 248 (62.0%) of the total subjects (400) had NCE/HND.
Average monthly income of the mothers
Results revealed presented the average monthly income of the mothers. Findings showed that 90 (22.5%) of the total mothers (400) earned below Nl0,000.00 monthly. However, 123 (30.8%) of the women earned between N10,000.00 – N20,000.00 monthly. One hundred and sixty-five (41.3%) of the mothers earned between N21,000.00 – N60,000.00 monthly. Ten subjects (2.50%) earned above N60,000.00 monthly.
Results showed that 30 (7.50%) of the respondents had formal education. Another 30 (7.50%) had first school leaving certificate, WASC, Teachers’ Grade II Certificate. Most of the respondents 249 (62.0%) had NCE/HND sixty-two (15.5%) had BSc/BA/Bed.
Results showed that 30 (7.75%) had a family size of 3; 130 (32.5%) had a family size of 4. Also 60 (15.0%) were 5 or 6 in their families. Thirty (7.25%) were 7 in their families. Ninety (22.5%) were more than 7 in number in their families.
22
Table 1: Frequency of consumption of plantain by each family in Isoko North Local Government Area in Delta State.
Frequency of Consumption Frequency Percentage
Once in a while 33 8.25
Once in a week 93 23.3
Twice a week - -
Thrice a week 30 7.50
Four times a week 91 22.8
Five times a week - -
Six times a week - -
Everyday 32 8.00
Total 279 68.9
In table 2, results showed that majority of the women (84.0%) cooked plantain by boiling unripe peeled plantain. Few (15.5%) boil unripe and unpeeled plantain. More than 22.3% of the women cook plantain pottage.
Table 2: Method of cooking plantain by the women
Frequency of Consumption Frequency Percentage
Boiling unripe peeled plantain 336 84.0
Boiling unripe unpeeled plantain 62 15.5
Boiling ripe unpeeled plantain 37 9.25
Boiling ripe peeled plantain 22 5.50
Roasting 75 18.8
Stewing for preparing pottage 89 22.3
Baking - -
Total 400 100
Food consumed together with plantain by the families.
Table 3 showed that some of the women (40.2%) used unripe plantain to prepare beans pottage. At least 44.0% of the families consumed fried ripe plantain and beans pottage.
Table 3: Food consumed together with plantain by the families.
Food Frequency Percentage
Ripe plantain + beans pottage 161 40.2
Fried ripe plantain (dodo) + beans pottage 179 44.8 Unripe plantain starch + oil soup (owo soup) 60 15
23
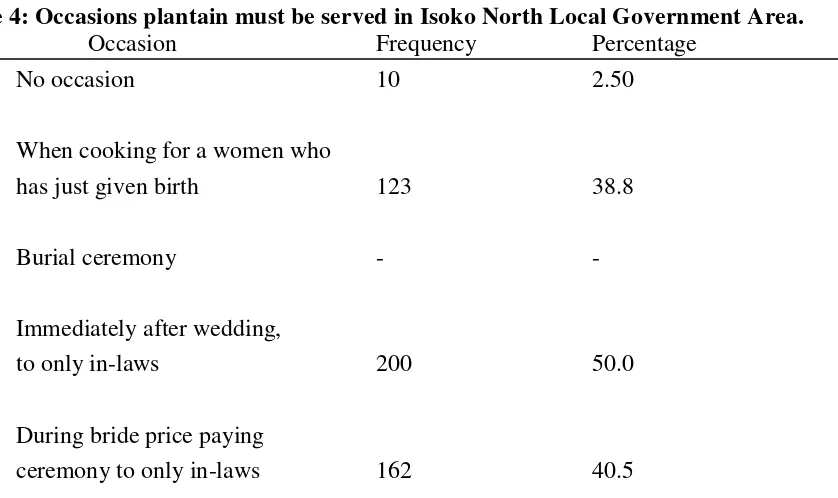
Table 4: Occasions plantain must be served in Isoko North Local Government Area.
Occasion Frequency Percentage
No occasion 10 2.50
When cooking for a women who
has just given birth 123 38.8
Burial ceremony - -
Immediately after wedding,
to only in-laws 200 50.0
During bride price paying
ceremony to only in-laws 162 40.5
Table 5: The forms mothers prepared plantain as complementary food for their babies. The table showed that 120 (30.0%) mashed plantain prior to feeding their babies. Very few (6.25%) soften plantain prior to feeding their babies. Other form mothers prepared plantain and fed to their babies are shown on the table.
Table 5: The forms mothers prepared plantain as complementary food for their babies.
Food Frequency Percentage
Mashed with hand 120 30
Mashed with spoon 30 7.50
Mashed and mixed with palm oil 65 16.3
Mashed and mixed with margarine - -
Mashed with fish 30 7.50
Mashed and mixed with stew - -
In form of pottage 20 5.00
Whole - -
Mashed with fried egg 20 5.00
Organoleptic evaluation of plantain, wheat and soybean flour products: (chinchin, fish pies, pancakes and foofoo dishes).
Organoleptic attributes of chinchin made from plantain and wheat flour
24
Flavour
The flavour of the samples differed. The 70:30 plantain/wheat flour chinchin had lower flavour value than the 50:50 plantain wheat/flour (4.80 versus 3.98). The difference was significant (P <0.05). Wheat flour chinchin had higher flavour value than any of the chinchin products (P<0.05)
Texture
There were variations in the texture of the chinchin. This was influenced by the components of the chinchin. The texture of the chinchin ranged from 3.33 to 4.85. The products were significantly different (P < 0.05) from each other.
The texture of the 70:30 plantain/wheat flour chinchin (PWFCHNa) had lower value (3.33) than the 50:50 plantain/wheat flour chinchin (4.75) (P<0.05). The control (wheat flour chinchin) had the highest acceptable texture (4.85). The PWFCHN, and the WFCHN did not differ in textures (P>0.05).
Colour
There were differences in colour of chinchin samples. The 70:30 plantain/wheat flour chinchin (PWFCFINa) had the least acceptable colour (3.33) and the control (wheat flour chinchin) had (5.55). The 70:30 plantain/wheat flour chinchin had lower acceptable colour than the 50:50 plantain/wheat flour chinchin. The difference was significant (P<0.05). The wheat flour chinchin (WFCHN) had the highest acceptable colour (5.55). The PWFCHN, and the WFCHN had no difference in colours (P>0.05).
Palatability
The level of palatability of the samples of chinchin was different. The 70:30 p1antain/wheat flour chinchin (PWFCHNa) had the least (4.20) and the control (wheat l:flour chinchin (WFCHN) was the most palatable (5.85). The PWFCHNa, which is the (70:30 plantain/ wheat flour chinchin) had a lower palatability than the 50:50 plantain flour chinchin (PWFCHN). The difference however, was significant (P<0.05). The control (wheat flour chinchin) WFCHN had significantly different palpability from the rest of the fur chinchin samples. The samples had palatability that was highly acceptable or accepted.
Overall acceptability
25
Table 6: Organoleptic attributes of chinchin made from plantain and wheat flours.
Samples Flavour Texture Colour Palatability Overall acceptability
PWFCHNa 3.98+0.28 3.33+0.31 3.33+0.31 4.20+0.26 4.53+0.27 PWFCHN 4.80+0.17a 4.75+0.19a 5.43+0.10a 5.45+0.11a 5.55+0.80a WFCHN 5.70+0.07ab 4.85+0.18 5.55+0.18a 5.85+0.06ab 5.63+0.08ab
Letters (abc) indicate significant differences. Mean not followed by the same letter along the same vertical column are significantly different from each other (P<0.05) as determined by Duncan’s New Multiple Range Test.
Mean ± SEM of 40 subjects.
PWFCHNa = Plantain wheat flour chinchin (70:30)
PWFCHN = Plantain wheat flour chinchin (50:50)
WFCHN = Wheat flour chinchin (control) (100% wheat flour)
It is based on a 6-point scale where 1 is the least acceptable score and 6 is the highest acceptable score based on people’s general food attitude.
6 = 1 will always eat this food at every given opportunity (highest). 1 = 1 will never want to eat this food again (least).
Organoleptic attributes of fish pies produced from plantain and wheat flours.
Table 7 showed the mean responses of the organoleptic attributes of fish pies produced from plantain and wheat flours.
Flavour
The flavour of fish pies varied. The (70:30) plantain/wheat flour fish pie had lower flavour than the (50:50) plantain wheat flew fish pie (PWFFPI). The values were 3.23 and 4.52, respectively. The difference was not significant (P>0.05). The PWFFPI was different from the PWFFP1a. The wheat flour fish pie (WFFPI) control had higher flavour value than any of the fish pies (P<0.5).
Texture
The texture of fish pies varied: The values ranged from 2.88 to 5.73. The (70:30) p1antain/wheat flour fish pie (PWFFP1a had the least (2.88). The PWFFP1a had lesser desirable texture than the (50:50) plantain wheat/flour fish pie (PWFFPI) (4.88). The difference was significant (P<0.05). The wheat flour fish pie (WFFPI) (control) had the best acceptable texture (P<0.05).
Colour
26
Palatability
There were variations in palatability of the fish pies. The values ranged from 3.33 to 5.28. The control (WFFPI) (5.85) was the most palatable pie (P<0.05). The palatability of the (70:30) plantain/wheat flour fish pie (PWFFP1a) was lower (3.33) than the (50:50) plantain fish pie (PWFFPI) (4.60). The difference was significant (P<0.05). On the other hand, the WFFPI had the highest level of palatability than any of the fish pies’ (P<0.05).
Overall acceptability
There were differences in overall acceptability of the fish pie samples. The (70:30) PWFFPla (plantain/wheat flour fish pie) was less accepted (3.60) than the (50:50) (PWFFPI) (plantain/wheat flour fish pie) (5.30). The control (WFFPI) wheat flour fish pie had the highest acceptability (5.63) which was not significantly different from the PWFFPI (P>0.05).
Table 7 Organoleptic attributes of fish pies prepared form plantain and wheat flours.
Samples Flavour Texture Colour Palatability Overall acceptability
PWFFPla 3.23+0.32 2.88+0.28 2.83+0.29 3.33+0.31 3.60+0.24a PWFFPI 4.52+0.68ab 4.88+0.19a 4.35+0.27a 4.6+0.20a 5.30+0.14ab WFFPI 5.18+0.16abc 5.73+0.07abc 5.88+0.05ab 5.28+0.14ab 5.63+0.08abc
Letters (abc) indicate significant differences. Mean not followed by the same letter along the same vertical column are significantly different from each other (P<0.05) as determined by Duncan’s New Multiple Range Test.
Mean ± SEM of 40 subjects.
PWFFPla = Plantain wheat flour fish pie (70:30)
PWFFPI = Plantain wheat flour fish pie (50:50)
WFFPI = Wheat flour fish pie (control) 100% wheat flour
It is based on a 6-point scale where 1 is the least acceptable score and 6 is the highest acceptable score based on people’s general food attitude.
6 = I will always eat this food at every given opportunity (highest). 1 = I will never want to eat this food again (least).
Organoleptic evaluation of pancakes made from plantain and wheat flours
Table 8 shows the organoleptic evaluation of pancakes made from plantain and wheat flours.
Flavour
27
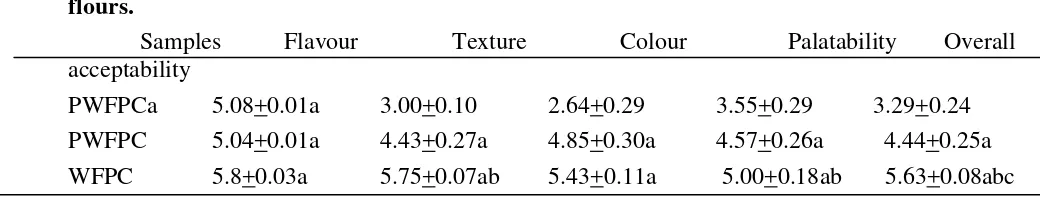
Texture
The texture of the pancakes ranged from 3.00 to 5.75 for the wheat flour (WFPC). The WFPC was significantly different in texture from the PWFPC pancake (P<0.05).
Colour
The colour of the products (pancakes) were 4.85 for the PWFPC and the YWFPC 4.83. The wheat flour pancake (control) had 5.43. The high value particularly for the WFPC products showed that the food was acceptable. The colour of the PWFPC was much more acceptable than that of the PWFPC pancake. However, the WFPC (control) had the most acceptable colour (5.43) (P<0.05). The PWFPC, and the WFPC pancakes colour were not different (P>0.05).
Palatability
The scores for palatability of the plantain pancakes are 4.57 for the PWFPC. The control wheat flour pancake (WFPC) had 5.00. These scores showed that the two samples had comparable palatability (P>0.05). The control WFPC had the highest score.
Overall acceptability
There were differences in the general acceptability of the pancakes. The value ranged from to 3.29 to 5.63. The PWFPCa had the least general acceptability (3.29) (P<0.05).
Table 8 Organoleptic attributes of pancakes prepared from plantain and wheat flours.
Samples Flavour Texture Colour Palatability Overall acceptability
PWFPCa 5.08+0.01a 3.00+0.10 2.64+0.29 3.55+0.29 3.29+0.24 PWFPC 5.04+0.01a 4.43+0.27a 4.85+0.30a 4.57+0.26a 4.44+0.25a WFPC 5.8+0.03a 5.75+0.07ab 5.43+0.11a 5.00+0.18ab 5.63+0.08abc
Letters (abc) indicate significant differences. Mean not followed by the same letter along the same vertical column are significantly different from each other (P<0.05) as determined by Duncan’s New Multiple Range Test.
Mean ± SEM of 40 subjects.
PWFPCa = Plantain wheat flour pancake (70:30)
PWFPC = Plantain wheat flour pancake (50:50)
WFPC = Wheat flour pancake (100% wheat flour)
It is based on a 6-point scale where 1 is the least acceptable score and 6 is the highest acceptable score based on people’s general food attitude.
6 = I will always eat this food at every given opportunity (highest). 1 = I will never want to eat this food again (least).
Organoleptic evaluation of the foofoo dishes produced from plantain and soybean flours
28
Flavour
The flavour of foofoo dishes were different. The flavour values ranged from 4.15 in plantain/soybean flour foofoo dish (PFFV) 5.26 to 51.3 which is unripe pounded plantain (plantain foofoo). The pounded plantain dish (PDPV) had a flavour value of 3.26. This was the control. The PFFV had 4.15 which was the unsupplemented plantain flour foofoo. However the PSFFV (5.18), and the PDPV (5.26) were not significantly different (P>O.05).
Texture
There were differences in texture value for the foofoo dishes. The pounded plantain dish PDPV had 5.11 and the PFFV had 5.30. The texture ratings of these dishes were not significantly different P> 0.05. The unsupplemented plantain flour foofoo dish with soyabean (PSFFV) had 4.95.
Colour
The colour of the foofoos were different. The mean colour ratings ranged from 4.15 in plantain flour foofoo dish (PFFV) to 5.54 in pounded plantain flour foofoo dish (PDPV). The unsupplemented plantain flour foofoo dish had a mean of 4.15. The soyabean supplemented plantain (PSFFV) dish had 4.60.
Palatability
There were variations in palatability of the foofoo dishes. The values ranged from 4.95 to 5.63. The pounded plantain foofoo dish (PDPV) was (5.60). The plantain flour foofoo dish (PFFV) (5.63) had higher rating than the control for the plantain (PDPV). The supplemented plantain/soybean foofoo dish (PSFFV) had the value of 4.95. The unsupplemented plantain flour foofoo dish (PFFV) had 5.63 which was higher tin that supplemented with soybean flour. Similarly PFFV (5.63), and PDPV (5.60) were not significantly different (P>0.05). However, these dishes were significantly different from the other foofoo dish (P<0.05).
Overall acceptability
There were differences in the overall acceptability of the foofoo dishes. The values ranged from 4.25 to 5.62. The plantain flour foofoo dish (PFFV) was least accepted (4.25). The soybean supplemented plantain flour foofoo (PSFFV) had comparable value (5.50) with the control. The plantain flour foofoo dish (unsupplemented) had lower acceptability value (4.25) than the soybean supplemented dish (PSFFV) 5.50. The difference was significant (P<0.05).
Table 9 Organoleptic attributes of foofoo dishes prepared from plantain, and soybean flours.
Samples Flavour Texture Colour Palatability Overall acceptability
29
Letters (abc) indicate significant differences. Mean not followed by the same letter along the same vertical column are significantly different from each other (P<0.05) as determined by Duncan’s New Multiple Range Test.
Mean ± SEM of 40 subjects.
PFFV is plantain flour foofoo + vegetable melon soup (100% plantain flour). PSFPV is plantain soybean flour foofoo + vegetable melon soup (70:30).
PDPV is pounded unripe plantain (plantain foofoo) + vegetable melon soup (100% boiled plantain).
It is based on a 6-point scale where 1 is the least acceptable score and 6 is the highest acceptable score based on people’s general food attitude.
6 = 1 will always eat this food at every given opportunity (highest). 1 = 1 will never want to eat this food again (least).
Discussion of Results
The study investigated the utilization and supplementation of plantain and thee floury. The use of plantain was influenced by many factors. Food forms, where prepared, nutrition education and food availability were the major constraints against diversification of use of plantain. The highly educated and high income group of the communities (urban) consumed less plantain weekly. This is because they had nutrition education and avoided too much consumption of starchy foods. Their high level of education and high income employment enabled them to purchase expensive and high quality foods.
The lower educated and lower income segments of Isoko North Local Government Area consumed more starchy food (plantain). This was because of their poor knowledge of nutrition to make good choice of foods and low income to purchase expensive and high quality foods. The lower family size of 4 was much more among the educated and high income earners. The groups knew that the fewer the family the more resources they have for family. The consumption of combination of plantain with egg among the educated and high income was because they had nutrition education which enabled them to make better choice of foods. The small segments of Isoko North Local Government Area that include egg in their diets did so because they know their nutritional implications. They have also the purchasing power to have these high quality foods available in their families.
The high percentage, of serving plantain dishes during bride price paying ceremony depicts the food habit of the community. Many cultures in Nigeria serve their best traditional dishes during occasions like bride price paying ceremony. It is not a surprise then to find such a high percentage of serving of plantain dishes in various forms in Isoko North Local Government Area.
Vegetables were not added to the weaning foods. These are sources of minerals which are needed by babies. The continuous dependence on such carbohydrate foods could be detrimental to the health of such children. Addition of food with protein of high biological value and food rich, in other nutrients are essential to babies for maintaining good nutritional status.
30
flavour value obtained when plantain flour was 50:50 with wheat flour was because of desirable mutual supplementation effect. This is a commonly observed phenomenon. The higher flavour value for whole wheat flour chinchin was because the judges were used to the flavour of whole wheat products. The lower texture, colour and palatability value of 70% plantain to 30% wheat flour was due to poor mutual supplementation effect. The similarities in textures, flavour, palatability and overall acceptability for 50:50 ratio (plantain and wheat flour), suggests that wheat flour may not have a superiority over other flours for preparation of chinchin. They were similar.
The lower flavour score for both. 70% plantain based fish pie might be due to poor mutual supplementation effect. The high flavour for the 50:50 plantain wheat blend demonstrates that the flavour is acceptable to the judges. The much higher flavour value of (5.18) for the control indicates its superiority or edge over other fish pies. Wheat flour products are usually highly acceptable by most people due to their pleasant flavour.
The values for the 50:50 mixture (plantain versus wheat flour) was high in texture, colour palatability and overall acceptability of the product. The high texture value of the PWFFPI indicates their good’s mutual supplementation effect. The products could be used as acceptable mixes to reduce cost than wheat flour. The higher values 5.18, 5.73, 5.88, 5.28, and 5.63 for fish pies based on 100% whole wheat flour was because the judges were much more familiar with these organoleptic attributes of whole wheat.
The PWFPC 50:50 products had higher rating because they had desirable and acceptable flavour, colour, palatability and overall acceptability. They could be used as good substitutes for lower cost fish pies based on wheat flour.
The high value for flavour of foofoo dish based on PSFFV (5.18) indicates that the flavour from the product is liked by the judges. The high palatability value of the PFFV indicates it was liked. The higher overall acceptability for the and PSFFV, (5.33) product might be attributed to components of the dishes.
Conclusion
Sun drying is a simple domestic processing method of preserving plantain. The production of cheap, nutritious, safe and acceptable snacks from plantain shows that more of such foods can be produced and utilized from many neglected foods in Nigeria. Mothers need to practice the preparation of the plantain wheat flour snacks. They can vary the ingredients/spices added to allow for variety.
Recommendations
1. Mothers in Isoko North Local Government Area and other status in Nigeria should be educated through workshops and clinics to give these snacks e.g. plantain wheat flour chinchin and plantain wheat flour pancake, fish pies to their family members e.g. adolescents.
2. Mothers in the area of study should be educated on how to prepare plantain flour. This could serve as a means of increasing the shelf life of plantain and hence prevent possible post harvest losses.
31
References
Enwere, N.J. and Okeke (1993) Processing and Marketing of fresh soymilk in the University of Nigeria, Nsukka Community: Problems and Prospects. A Paper presented at the 17th Annual Conference of the Nigerian Institute of Food Science and Technology, Ilorin, Kwara State. Dec. 6 – 11, Book of Abstract, p.22.
Ezema, P.A. (2001) Poverty Alleviation in Rural Nigeria: The Role of Home Economics. Conference Proceedings of the Home Economics Research Association of Nigeria.
Imonikebe B.U. (2007) Utilization, Development, Chemical, Microbial and Organoleptic Evaluation of Yam (dioscorea rotundata poir) and plantain (Musa paradisciaca) flour products in Isoko North LGA of Delta State. A Doctoral thesis, Home Science, Nutrition and Dietetics, Department, University of Nigeria, Nsukka, Nigeria.
32
Impact of Gender Diversity on
Organizational Performance in Telecom
Sector of Pakistan: The Moderating
Role of Organizational Culture
S. M. M. Raza Naqvi
Assistant Professor, Department of Management Sciences, Muhammad Ali Jinnah University, Islamabad, Email: [email protected]
Maria Ishtiaq
MS scholar, Muhammad Ali Jinnah University, Islamabad, Email: [email protected]
Nousheen Kanwal
MS scholar, Muhammad Ali Jinnah University, I