DEVELOPMENT OF MOBILE-BASED SPATIAL EXPERT SYSTEM FOR SELECTING BROILER CLOSED HOUSE FARM LOCATION
ARIF KURNIA WIJAYANTO
GRADUATE SCHOOL
BOGOR AGRICULTURAL UNIVERSITY BOGOR
STATEMENT
I, Arif Kurnia Wijayanto, hereby stated that this thesis entitled:
DEVELOPMENT OF MOBILE-BASED SPATIAL EXPERT SYSTEM FOR SELECTING BROILER CLOSED HOUSE FARM LOCATION
is result of my own work under the supervision of advisory board during the period of February until September 2015 and that it has not been published before. The content of the thesis has been examined by the advisory board and external examination.
Bogor, November 2015
Arif Kurnia Wijayanto
RINGKASAN
ARIF KURNIA WIJAYANTO. Pengembangan Sistem Pakar Spasial Berbasis
Mobile untuk Pemilihan Lokasi Peternakan Broiler tipe Kandang Tertutup. Dibimbing oleh KUDANG BORO SEMINAR dan RUDI AFNAN.
Indonesia merupakan negara dengan jumlah dan tingkat pertumbuhan penduduk yang tinggi. Fakta ini menyebabkan peningkatan permintaan protein hewani berkualitas baik dengan kuantitas yang mencukupi. Sebagai respon positif, banyak peternakan ayam broiler dibangun untuk meningkatkan produksi. Namun, perkembangan peternakan broiler telah menyebabkan banyak masalah lingkungan. Sistem pakar untuk pemilihan lokasi berdasarkan faktor-faktor sosial-lingkungan dan prinsip-prinsip berkelanjutan sangat diperlukan untuk mengatasi masalah ini. Tujuan dari penelitian ini adalah untuk menciptakan peta kesesuaian pengembangan peternakan ayam broiler untuk kondisi saat ini di Parung, Bogor. Selanjutnya, sistem pakar berbasis mobile diharapkan dapat berkembang dan bermanfaat sebagai pedoman bagi peternak ayam broiler dalam mengambil keputusan untuk memastikan produktivitas yang optimal dengan tetap memperhatikan lingkungan dan masyarakat.
Penelitian ini dilaksanakan sejak Februari hingga September 2015. Parung, Kabupaten Bogor, Jawa Barat, Indonesia dipilih sebagai daerah penelitian, sedangkan proses pembangunan sistem dilakukan di Kampus SEAMEO Biotrop, Bogor.
Kuesioner digunakan untuk memperoleh pengetahuan dan preferensi ahli menurut tingkat kepentingan dari setiap faktor yang menentukan. Responden kuesioner bervariasi dari instansi pemerintah, perusahaan swasta, dan akademisi. Kuesioner diolah dalam bentuk perbandingan berpasangan untuk masing-masing faktor dan sub-faktor dan disusun berdasarkan hirarki. Penilaian dari para ahli kemudian disintesis menggunakan perangkat lunak AHP untuk mendapatkan bobot untuk setiap faktor dan sub-faktor. Rasio konsistensi (RK) digunakan untuk menganalisis kualitas pengisian kuesioner.
Penelitian ini mempertimbangkan empat faktor utama, yaitu 1) dampak ekologis dan lingkungan, 2) ekonomi dan infrastruktur, 3) kondisi alam, dan 4) kerentanan bencana alam. Seluruh faktor diperingkatkan dengan menggunakan AHP dan diproses melalui analisis spasial untuk membangun peta kesesuaian. Bobot dari proses AHP digunakan dalam proses weighted overlay dalam perangkat lunak GIS. Weighted overlay dilakukan secara hirarki berdasarkan hirarki AHP dari faktor dan sub-faktor. Kesesuaian daerah ditentukan berdasarkan skor akhir pada keluaran weighted overlay.
Metode yang digunakan dalam pengembangan sistem ini mengacu pada metode pemrograman ekstrim (extreme programming). Metode pemrograman ekstrim dipilih karena informasi dan pengetahuan, ahli, dan semua data pendukung telah tersedia. Analisis dan desain langkah mengadopsi metode pemrograman ekstrim. Langkah ini terdiri dari empat langkah, yaitu analisis, desain, implementasi dan pengujian, dan akhirnya merilis aplikasi.
ii
pengisian kuesioner oleh beberapa responden tidak cukup baik. Ditemukan dari nilai rasio konsistensi (RK) yang lebih dari 0.1 (>0.1). Namun, penilaian ulang dilakukan untuk meningkatkan nilai rasio konsistensi masing-masing responden sehingga semua kuesioner dari setiap responden harus konsisten dengan nilai rasio kurang dari 0.1 (<0.1).
Berdasarkan hasil kuesioner, kondisi alam dinilai sebagai aspek yang paling penting, diikuti oleh aspek ekologi dan dampak lingkungan. Sementara kerentanan bencana alam dinilai aspek paling tidak penting.
Peta kesesuaian dibuat dengan menggunakan bobot dari proses AHP pada langkah sebelumnya dan diproses melalui weightedoverlay dalam perangkat lunak GIS. Daerah terbesar yang dianggap sesuai ditemukan di Iwul, dengan total luas 109.56 ha. Sementara wilayah sesuai yang terkecil ditemukan di Bojongindah (0.01 ha) dan Parung (0.11 ha). Hasil ini sesuai dengan fakta bahwa Parung memiliki kepadatan penduduk tertinggi dan daerah yang paling maju di wilayah Parung. Dengan demikian, untuk tujuan pembangunan berkelanjutan, pengembangan peternakan ayam broiler di daerah Parung sebaiknya dilakukan di wilayah selatan. Gagasan sistem ini adalah jika pengguna menempatkan titik pada lokasi tertentu, sistem harus mampu membaca apakah titik tersebut terletak pada poligon tertentu atau poligon lain dalam peta kesesuaian, dan kemudian membaca atribut poligon seperti yang diminta oleh query. Sistem yang dikembangkan adalah aplikasi berbasis web mobile yang dapat diinstal pada perangkat Android.
Pengujian sistem dilakukan dengan membandingkan keluaran dari sistem dengan keluaran yang diharapkan. Pengujian menyimpulkan sistem telah teruji dan bekerja dengan baik. Validasi di lapangan juga telah dilakukan dengan mengunjungi daerah penelitian. Ada empat titik lokasi yang masing-masing mewakili setiap kelas kesesuaian. Pertimbangan pemilihan titik didasarkan pada setiap titik harus terletak di lokasi dengan atribut fisik yang kontras (penggunaan lahan, dan lain-lain), sehingga kelas kesesuaiannya mungkinakan berbeda. Validasi menyimpulkan peta kesesuaian dan juga sistem sudah sesuai dengan kondisi nyata di lapangan.
Sebuah peta kesesuaian untuk kandang broiler kandang tipe tertutup di wilayah Parung mempertimbangkan dampak ekologi dan lingkungan, ekonomi dan infrastruktur, kondisi alam, dan kerentanan bencana alam telah dibuat. Berdasarkan peta kesesuaian, sistem pakar untuk pemilihan lokasi peternakan ayam broiler kandang tertutup telah dikembangkan. Sistem ini dapat digunakan sebagai alat untuk menentukan kesesuaian lokasi, baik di wilayah Parung atau lokasi lain di Indonesia. Lebih banyak faktor dapat ditambahkan untuk meningkatkan kualitas kesesuaian peta dan masukan data ke database. Peta kesesuaian untuk daerah lain di luar wilayah Parung dapat meningkatkan kualitas sistem. Pemerintah disarankan dapat menggunakan peta ksesuaian ini sebagai alat pendukung keputusan dalam mengelola zonasi untuk budidaya ayam broiler dengan mempertimbangkan aspek ekologi dan lingkungan, dan sebagai prototipe untuk pengembangan sistem yang sama pada berbagai industri pertanian dan ternak atau sektor lain.
SUMMARY
ARIF KURNIA WIJAYANTO. Development of Mobile-based Spatial Expert System for Selecting Broiler Closed House Farm Location. Supervised by KUDANG BORO SEMINAR and RUDI AFNAN.
Indonesia is a country with a large number of inhabitant and a high population growth rate. This fact leads to the increasing demand for high-quality and high quantity animal protein as well. As positive respond, many broiler farms are built to increase production. However, the massive development of broiler farms has led to many socio-environmental problems. An expert system for site selection based on the socio-environmental factors and sustainable principles is urgently needed to cope with this problem.
The objective of this research was to create a suitability map for broiler farm development for the current condition in Parung, Bogor. Further, it was expected to develop and utilize a mobile-based expert system which can be used as a guidance for broiler farmer to take decision to ensure the productivity by still pay attention to the environment and society.
This research was conducted from February to September 2015. Parung, Bogor Regency, West Java, Indonesia was chosen as study area, while the development process was done in Biotrop Campus, Bogor.
Questionnaire was used to obtain expert knowledge and preference according to importance of each determining factor. The respondent for the questionnaire were vary from governmental institution, private company, and academician. The questionnaire was in the form of pairwise comparison for each factor and sub-factor and arranged based on hierarchy. The expert’s judgment from questionnaire then synthesized by using AHP software to obtain the weight for each factor and sub-factor. Consistency ratio (CR) was used to analyze the quality of questionnaire filling.
This research considered four main factors: 1) ecological and environmental impact, 2) economic and infrastructure, 3) natural condition, and 4) natural disaster vulnerability. The whole factors were ranked by using AHP and processed through sequence step in spatial analysis to build suitability map. Weight from AHP process was used in weighted overlay in GIS software. The weighted overlay was done hierarchically based on AHP hierarchy of factors and sub-factors. Suitability of an area was determined based on the final score on the weighted overlay outputs.
Method used in this system development refers to Extreme Programming. The extreme programming method was chosen because information and knowledge, experts, and all supporting data has been available. The analysis and design step adopted extreme programming method. This step consisted of four steps: analysis, design, implementation and testing, and finally release the application.
All questionnaires from each respondent has been processed by AHP method using Expert Choice software. From the processing results, it was known that the quality of the questionnaire filling by some respondents was not good enough. It
iv
of each respondent. So that all questionnaires from each respondent had consistency ratio value less than 0.1 (< 0.1).
Based on questionnaire result, natural conditions was considered as the most important aspect, followed by ecology and environmental aspect. While the natural disaster vulnerability was the least important aspect.
Suitability map was created by using weight from AHP process in the previous step and processed through weighted overlay in GIS software. Suitability based on all factors was obtained by weighted overlaying the four suitability map of all factors. The largest suitable area found in Iwul, by total area of 109.56 ha. While the smallest suitable area found in Bojongindah (0.01 ha) and Parung (0.11 ha). This result match to the fact that Parung has the highest population density and the most developed area in Parung region. Thus, for sustainable development purpose, broiler closed house farm development in Parung region should be located in the southern area.
The idea for this system working is that if user put a point on a certain location, the system should be able to read whether the point is located on a certain polygon or other polygon in the suitability map, and then read the attribute of the polygon as requested by the query. The system was implemented by using several web programming language, such as html, css, php, javascript, and jQuery. The developed system is a web-based mobile application that can be installed on an Android device. The installer is in the form of .apk file, can be downloaded from http://arif.mit.biotrop.org or http://broilerfarmloc.web.id.
System testing was done by comparing the output from system by expected output. From the test, it was concluded that the system has been tested and working properly. On field validation was also already done by visiting the study area. There were four points each of which representing each class of suitability. The consideration of point selection was that each point should be located in a contrast physical attributes (land use, etc), so that the suitability will be different. From the validation, it was concluded that the suitability map and also the system was already match to the real condition on the field.
A suitability map for broiler closed house farm in Parung region considering ecological and environmental impact, economic and infrastructure, natural condition, and natural disaster vulnerability has been created. Also, based on the suitability map, an expert system for selecting broiler closed house farm location has been developed. This system can be used as a tool to determine suitability of a location, either in Parung region or other location in Indonesia. If possible, more factors can be added to increase the quality of the suitability map as input data to the database. Suitability map for other area outside Parung region could increase the quality of the system. It is recommended that the government can use this suitability map as decision support tool to manage zoning for broiler farming concerning ecology and environment, and as prototype for the development of same system for various agricultural and animal industry or other sectors.
vi
Copyright @ 2015, Bogor Agricultural University
It is prohibited to cite all of part of this thesis without referring to end mentioning the source. Citation only permitted for the sake of education, research, scientific writing, critical writing, or reviewing scientific problem. Citation does not inflict the name and honor of Bogor Agricultural University.
DEVELOPMENT OF MOBILE-BASED SPATIAL EXPERT SYSTEM FOR SELECTING BROILER CLOSED HOUSE FARM LOCATION
ARIF KURNIA WIJAYANTO
A thesis submitted for the Degree Master of Science in Information Technology for Natural Resources Management Study Program
GRADUATE SCHOOL
BOGOR AGRICULTURAL UNIVERSITY BOGOR
viii
Research Title : Development of Mobile-based Spatial Expert System for Selecting Broiler Closed House Farm Location
Student Name : Arif Kurnia Wijayanto Student ID : G051130051
Approved by, Advisory Board
Prof. Dr. Ir. Kudang Boro Seminar, M.Sc. Supervisor
Dr. Rudi Afnan, S.Pt, M.Sc.Agr Co-Supervisor
Endorsed by
Program Coordinator
of Master of Science in IT for Natural Resources Management
Dr. Ir. Hartrisari Hardjomidjojo, DEA
Dean of the Graduate School
Dr. Ir. Dahrul Syah, M.ScAgr.
Date of examination: Date of graduation:
x
ACKNOWLEDGEMENTS
Alhamdulillah, thanks to the Almighty, Allah SWT, for the opportunity and ability to complete this thesis. The success of this study would not have been possible without various contributions and supports from many people. Of course, the author would like to express highly appreciation to all of them.
I sincerely thank to Bapak Prof. Dr. Ir Kudang Boro Seminar, M.Sc as the supervisor and Bapak Dr. Rudi Afnan, S.Pt, M.Sc.Agr as co-supervisor, for the guidance, support, and valuable advices for this research. Moreover, I would like to express gratitude to the external examiner Prof. Dr. Ir. Cece Sumantri, M.Sc for giving advices and valuable corrections to make this thesis better.
I also acknowledge valuable supports from several institutions: Regional Planning Agency (BAPPEDA) Kabupaten Bogor, Dinas Tataruang dan Pertanahan (DTRP) Kabupaten Bogor, Dinas Peternakan dan Perikanan (Disnakkan) Kabupaten Bogor, Badan Penanggulangan Bencana Daerah (BPBD) Kabupaten Bogor, Badan Meteorologi, Klimatologi, dan Geofisika (BMKG) klas 1 Darmaga, PLN Depok Area and Bogor Area, and PT Sierad Produce, tbk; that have facilitated valuable data during this research. Especially for Ibu Tika Mustika Effendi, S.T, M.Si (BAPPEDA), Bapak Wawan Darmawan, S.P, M.Si (DTRP), Ibu Drh. Sulistyowati, M.Si (Disnakkan), and Bapak M Gufron and Bapak Sudihanto (PT Sierad Produce) that have kindly supported this research by being respondent for the questionnaire.
Also, I specially and honorly thank Bapak and Ibu, and all of the family for support and doa. Finally, thank to all of MIT family, the lecturers, administration staff, technician, and all of the colleagues for helping, supporting, and togetherness. Hopefully, this thesis could give positive and good contribution for many people.
Bogor, November 2015
Arif Kurnia Wijayanto
TABLE OF CONTENT
LIST OF TABLE xii
LIST OF FIGURE xii
LIST OF APPENDIX xiii
1 INTRODUCTION 1
Background 1
Problem Statement 3
Research Scope 3
Research Objectives 3
Research Benefits 3
2 METHOD 4
Time and Location 4
Data Source 5
Required Tools 5
Procedures 5
3 RESULT AND DISCUSSION 11
Suitability Map Building 11
System Building 20
4 CONCLUSION AND RECOMMENDATION 31
xii
LIST OF TABLE
1 Data required 5
2 Software used in the research 5
3 Hardware used in this research 5
4 Pair wise comparison scale for AHP preferences (Saaty, 1988) 6 5 AHP result in weight for each factor and sub-factor 11
6 User interest reflecting needs 20
7 System functional needs 21
8 System testing result 28
LIST OF FIGURE
1 Map of Kecamatan Parung as study area 4
2 Hierarchy of goal, factor, and sub-factor 6
3 Example of weighted overlay process 9
4 The sequence of work to build suitability map 9
5 System development flowchart 10
6 Suitability map based on distance from river or waterbody sub-factor 12 7 Suitability map based on distance to settlement sub-factor 13 8 Suitability map based on ecology and environmental impact factor 13 9 Suitability map based on distance to road access sub-factor 14 10 Suitability map based on distance to electricity network sub-factor 14 11 Suitability map based on economic and infrastructure factor 15 12 Suitability map based on average humidity sub-factor 15 13 Suitability map based on average temperature sub-factor 16 14 Suitability map based on land use type sub-factor 16 15 Suitability map based on land slope sub-factor 17 16 Suitability map based on natural condition factor 17 17 Suitability maps based on natural disaster vulnerability factor. Flood
vulnerability (a), fire vulnerability (b), earthquake vulnerability (c), landslide vulnerability (d), storm or puting beliung vulnerability (e), and the final suitability map based on all sub-factors in natural disaster vulnerability factor
(f). 18
18 Final suitability map representing suitability of area in Parung for broiler
closed house farm 19
19 Area of each suitability class for each desa/region 19
20 Target user scheme 20
21 System working scheme 21
22 Database design 22
24 Illustration of point location calculation 23 25 Application after installed on mobile device. Application icon on drawer (a),
splash screen (b), and homescreen (c) 24
26 Detect location by using GPS 25
27 Suitability information section 25
28 Input form to calculate suitability for area outside Parung 26 29 Analysis result based on input form for location outside Parung 26
30 Recommended location based on farm capacity 27
31 Display of information section. Area of each desa (a), broiler farm population
(b), and broiler slaughterhouse location (c) 27
32 Survey points location for validation 28
33 On field validation for point 1 (expected: very unsuitable) 29 34 System result based on coordinate of point 1 showing that location was very
unsuitable 29
35 On field validation for point 2 (expected: unsuitable) 29 36 System result based on coordinate of point 2 showing that location was
unsuitable 30
37 On field validation for point 3 (expected: moderate) 30 38 System result based on coordinate of point 3 showing that location was
moderate 30
39 On field validation for point 4 (expected: suitable) 31 40 System result based on coordinate of point 4 showing that location was
suitable 31
LIST OF APPENDIX
1 Questionnaire 36
1
INTRODUCTION
Background
Indonesia is a country with a large number of inhabitant (around 237 million) and high population growth rate (1.49 percent/year) (BPS, 2010). This fact leads to the increasing demand for high-quality and high quantity animal protein as well. By an increasing demand, it is necessary to meet the needs by increasing the production of animal protein. One animal protein producers is broiler meat. Broiler meat has comparable nutritional value to beef but the price is relatively lower than meat from cattle.
Demand for broiler always increase every year. Directorate General of Livestock and Animal Health, Republic of Indonesia (2013) reported that the consumption of broiler meat is increasing from year to year. In 2006, the national consumption rate was 3.076 kg/capita/year, and in 2012 was 3.494 kg/capita/year. As positive respond, many broiler farms are built to increase production. However, the massive development of broiler farms has led to many socio-environmental problems, such as bad odor from manure (Rachmawati 1999). A farming technology called closed house has been developed to overcome this negative impact.
However, the same case with the other business development, closed house farm development should also consider three important aspects of sustainable development: economic, social, and environmental. An expert system for site selection based on the socio-environmental factors and sustainable principles is urgently needed to cope with this problem.
Decision making is based on numerous data concerning the problem. It has been estimated that 80% of data used by managers and decision makers are geographical (spatial) in nature (Worral 1991). The combination of the internet enabling speed and access, and the maturation of artificial intelligence techniques, has led to sophisticated aids to support decision making under risky and uncertain conditions. These aids have the potential to improve decision making by suggesting solutions that are better than those made by the human (Kabari and Nwachukwu 2013). Nowadays, the system is well known as Decision Support System (DSS).
2
integration of MCA within a GIS context could help users to improve decision-making processes. One of the most popular method of MCA is analytical hierarchical process (AHP). The AHP is a systematic method to guide decision-makers in making decisions to solve the problems based on priorities.
In this research, a suitability map produced by AHP method was used as input data. The suitability map then exported as one table in spatial database which was PostgreSQL and PostGIS extension. Spatial databases are a new technology in the database systems which allow storing, retrieving and maintaining geospatial data (Mocanu and Velicanu 2011). While PostGIS is an extension to the PostgreSQL object-relational database system which allows GIS objects to be stored in the database (Boluwade and Ferdinand 2011).
Many researches have been done concerning the use of GIS in determining suitable location for animal farm. However, in Indonesia, especially in Bogor, there is no report of research that has been done according to the utilization of GIS for poultry farm. Liaghat, et al. (2013) have done a research about multi criteria evaluation using AHP technique to analyze coastal tourism sites in Port Dickson district in Malaysia. The result offered six suitable sites, which based on the analysis, can be helpful for future urban plan development.
Another research applying AHP done by Nekhay, et al. (2008). The study adopted a two folds methodological approach for assessing the suitability of agricultural areas for wildlife habitat restoration. Embedding expert judgments through an AHP and GIS about the effect of specific elements of the landscape on Iberian lynx (Lynx pardinus) habitat restoration potentiality as an indicator of selection of the most suitable agricultural areas to be transformed to the natural state (Mediterranean forest and scrublands). The case study is the olive (Olea europaea L.) plantations of the mountain areas of Andalusia (Spain).
Prawiradiputra (2008) did a research about land suitability for dairy cattle farm selection using spatial analysis and AHP in Bener Meriah. Nanggroe Aceh Darussalam, Indonesia. The AHP was used to select the most suitable area for dairy cattle farm from those candidates based on expert’s judgments. The result of the study was stated that 11 hectares of area in Kute Lintang village categorized as suitable.
In poultry field, formerly, a research had been done by Fitriadi (2011) by conducting two different regulation as considered criteria: Indonesian regulation and Australian regulation. From the research, it is said that Australian regulation gave wider suitable area compared to what was given by Indonesian regulation. However, the research was conducted by using general poultry as research object. This research will focus on broiler farm as the research object and implement Australian regulation as the general criteria to be processed in MCA.
and communities to act on warning issue. Singh, et.al (2012) developed a web based GIS application for spatial natural resources information system using effective open source software and standards. The research conveyed an efficient approach to customize and integrate an open source web GIS system for effective dissemination, sharing and management of spatial information over the internet. Chen, et al. (2013) applied web-GIS technique to develop management platform of traffic control devices.
Considering the massive development of information technology, especially mobile technology, it must be better if the information is served through mobile technology. In this case, the system is developed as Android application.
The expectation from this system development is the easiness of broiler farmer to take decision in developing a new broiler closed house, considering location suitability and other economic and ecologic factors. Also the system can be a guide for farmers to manage their broiler closed house, especially to cope environment problem. As the main goal, the productivity should be raised, but still care to the environment and society.
Problem Statement
The production of chicken meat in Indonesia is still not adequate to fulfill the national demand. One factor that derive the fact is in location choosing for broiler farm development. It is important to analyze the suitable locations for broiler farm, not only to maximize the profit but also to minimize the negative impacts to the environment. The farmer also need a fast and reliable guide to take decision in broiler management, both for on-farm and off-farm.
Research Scope
The scope that limits this research is that this research aims to determine suitable area for broiler closed house farm development in Parung, Bogor Regency, generate the suitability map and develop the expert system.
Research Objectives
The objective of this research was to create a suitability map for broiler farm development for the current condition in Parung, Bogor. Further, it was expected to develop and utilize a mobile-based expert system which can be used as a guidance for broiler farmer to take decision to ensure the productivity by still pay attention to the environment and society.
Research Benefits
4
2
METHOD
Time and Location
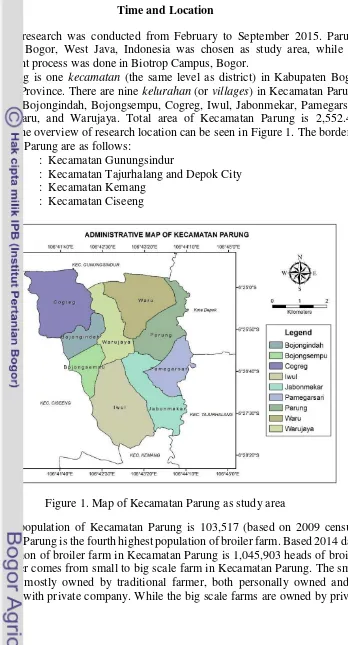
This research was conducted from February to September 2015. Parung, Kabupaten Bogor, West Java, Indonesia was chosen as study area, while the development process was done in Biotrop Campus, Bogor.
Parung is one kecamatan (the same level as district) in Kabupaten Bogor, West Java Province. There are nine kelurahan (or villages) in Kecamatan Parung, which are: Bojongindah, Bojongsempu, Cogreg, Iwul, Jabonmekar, Pamegarsari, Parung, Waru, and Warujaya. Total area of Kecamatan Parung is 2,552.478 hectares. The overview of research location can be seen in Figure 1. The border of Kecamatan Parung are as follows:
North : Kecamatan Gunungsindur
East : Kecamatan Tajurhalang and Depok City South : Kecamatan Kemang
West : Kecamatan Ciseeng
Figure 1. Map of Kecamatan Parung as study area
Data Source
Materials used in this research were digital map which were used in multi-criteria analysis method.
Table 1 shows the detail of whole data that were used. Table 1. Data required
No Data Format Source
1 Road network Vector Bappeda
2 River network Vector Bappeda
3 Administrative Vector Bappeda
4 Land use Vector BIG
5 Electricity supply Vector PLN
6 Digital Elevation Model (DEM) Raster USGS
7 Disaster vulnerability Tabular BPBD
8 Climatic data Tabular BMKG
Note: Bappeda = Agency of Regional Development and Planning
BIG = Agency of Geospatial Information
PLN = National Electricity Company
USGS = United States Geological Survey
BPBD = Agency of Regional Disaster Management
BMKG = Agency of Meteorology, Climatology, and Geophysics
Required Tools
To support this research, some tools used which were computer software installed in a computer. The list of tools used in this research are shown in Table 2 and Table 3.
Table 2. Software used in the research
No Item Function
1 ArcGIS Process the shapefiles 2 Expert Choice Compute AHP
3 Notepad++ Edit text and code
4 Geoserver Serve map data
5 PostgreSQL+PostGIS Database management system
Table 3. Hardware used in this research
No Item Function
1 Personal computer General usage 2 Server computer Serve the application
Procedures Collecting Expert’s Preferences to Rank Factors
6
were vary from governmental institution, private company, and academician. The questionnaire as shown in Appendix 1 was in the form of pairwise comparison for each factor and sub-factor and arranged based on hierarchy as shown by Figure 2. Pairwise comparison is a method that used to calculate the expert assessment of each criteria used in this study. Pairwise comparison method was developed by Saaty (2008) as part of AHP.
Figure 2. Hierarchy of goal, factor, and sub-factor
Expert’s judgment of the relative preferences or importance of one factor to another is expressed in numerical values. Saaty (1988) suggested a scale for pairwise comparison, consisting of value ranging from 1 to 9 describing intensity of importance. The value of 1 expresses one factor has the same importance to another factor. While the value of 9 is given to those factors whose importance is extremely more important to another factor. Table 4 shows the scale value for pairwise comparison in AHP.
Table 4. Pair wise comparison scale for AHP preferences (Saaty, 1988) Preferences expressed
7 Very strong importance
9 Extreme importance
2, 4, 6, 8 Intermediate value between adjacent scale values
(Ziaei and Hajizade 2011). Value of CR was also obtained from AHP software. Reassessment would be done if the value of CR exceed 0.1 (CR > 0.1).
Building Suitability Map
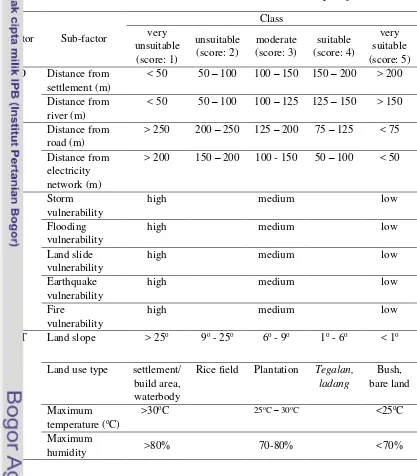
Australian Regulation for broiler farming was selected in this study because the regulation contains more numerous and complex criteria in determining the suitable location of poultry farm (Fitriadi 2011). This research considered four main factors: 1) ecological and environmental impact (ECO), 2) economic and infrastructure (ECI), 3) natural condition (NAT), and 4) natural disaster vulnerability (DIS). Table 5 shows the factors and constraints that used in multi-criteria analysis in this research.
Table 5. Factor and constraints considered to build suitability map
No Factor Sub-factor
8
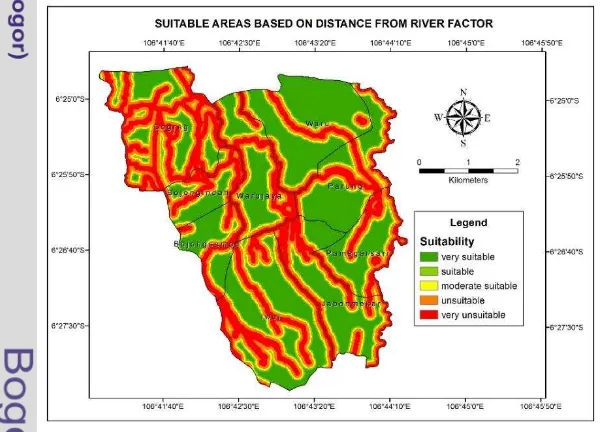
Distance from settlement was considered due to the odor from broiler farm and to minimize noise from settlement that can disturb the broiler chickens, which can influence their productivity. Also to minimize negative impact of ammonia and carbon dioxide from the farm which can negatively affect people around the farm, as stated by Killic and Yaslioglu (2014). Distance from river in this research was not related to water comsumption for broilers but it was related to waste disposal. Waste from poultry house was considered not good to environment. Although the waste management in some broiler farm was already good, building broiler farm as far as possible from river will be better to decrease waste negative impact.
Factors included as economic and infrastructure factor were: distance from/to road and electricity supply. Distance from/to road related to easiness of one location to be discovered. Closer location impacted to the cost by the farmer to transport farm material to come in to the farm and harvested broiler chicken to go out of the farm. Broiler farm needs electricity supply to use for several electricity equipment, such as: lighting and water pump. Thus, the availability of electricity is obligatory.
Local climate as natural factor was counted to its stimulation effect on the characteristic to broiler chicken to environment change. This effect can influence the growth thus body weight as the main objective of broiler chicken farming. Land elevation and slope, soil type, and land use were factors to determine the possibility of broiler farm development location. This research considered also natural hazard as influencing factor. Area with high vulnerability of natural hazard has to be avoid. The whole factors mentioned above were ranked by using AHP and processed through sequence step in spatial analysis to build suitability map. Weight from AHP process was used in weighted overlay in GIS software. Overlay is spatial analysis by combining at least two layers of data as input. The overlaying was done by performing arithmetic process on each pixel of input data to produce new pixel as output data. Weighted overlay was an overlay process that uses weights for each factor. In the weighted overlay process, the input data is in the form of raster data, which located and stored data using a matrix structure or pixels that make up the grid. Weighted overlay method was used in this research because of its simple and straightforward technique especially for spatial inference using multi-classes maps (ESRI 2002). Basically, spatial analysis can also be simply done by using Boolean logic. In Boolean logic, the suitable area on the final suitability map are the area which fulfill the whole criteria. The involved variables are considered to have the same importance. Thus, as stated by Carvalho et al. (2007), weighted overlay operations allow a more flexible map combination compared to Boolean logic operations.
The weighted overlay was done hierarchically based on AHP hierarchy of factors and sub-factors as shown by Figure 2. Generally, determination of suitable area for broiler farm in this research was modeled as follow:
SAx =
α
1X1 +α
2X2 +α
3X3 + …. +α
nXnNote: SAx = Suitability of area based on factor X
α
i = Weight of factor Xi . Ranged from 0 to 1 ( α
i = 1) Xi= Score for factor XiFigure 3. Example of weighted overlay process
By using GIS software, score for each area were determined based on classes described in Table 5. Once the final score was obtained, the area on the map would be classified into five classes based on the final score. The level of final score for determining suitability was as follows:
1.00 – 1.99 = Very unsuitable 2.00 – 2.99 = Unsuitable
2.00 – 3.99 = Moderate suitable 4.00 – 4.99 = Suitable
5.00 = Very suitable
The result of spatial analysis was a suitability map which will be exported as one database table for the system. Overall sequence work of building suitability map can be seen in Figure 4.
10
Building the System
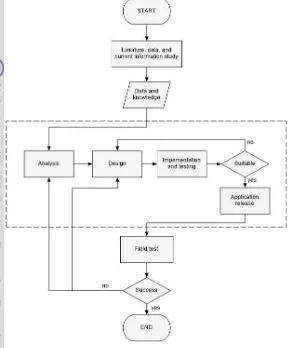
Method used in this system development refers to Extreme Programming (XP). The XP method was chosen because information and knowledge, experts, and all supporting data has been available (Al Ikhsan 2012). The suitability map that was obtained from previous part was used as base for spatial module. The overall flow step of system development was shown in Figure 5.
Figure 5. System development flowchart
The analysis and design step adopted extreme programming method. This step consisted of four steps: analysis, design, implementation and testing, and finally release the application. Details about each step explained as below:
1) Analysis
In this step, system requirement was analyzed by understanding the latest technology for more usable and general system development. In this case, a mobile-based system was chosen concerning its usability, low cost, and current technology trending. To cope cross platform problem, this system was not developed as one platform application rather than was developed as a mobile web-based application which can be access from several mobile platform. 2) Design
3) Implementation and testing
The system implementation was done to implement the system in a research level by using a localhost server. To view the system running, common desktop browser was used, only by changing the windows size to mobile size aspect ratio. Testing by using mobile device could be done after the system have been uploaded to the online server. The system was tested on mobile device in the form of application installed in Android device.
4) Software release
If the system can passed the test, then it was ready to be released. The system was released in the form of package system which was ready to be downloaded and installed on Android devices.
3
RESULT AND DISCUSSION
Suitability Map Building Expert Preference for Determining Each Factor’s Weight
All questionnaires from each respondent has been processed by AHP method using Expert Choice software. From the processing results, it was known that the quality of the questionnaire filling by some respondents was not good enough. It
was found from the value of consistency ratio (CR) which was more than 0.1 (> 0.1). However, a reassessment was done to improve the consistency ratio values
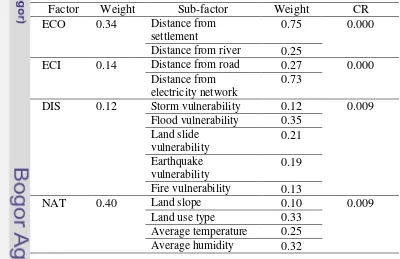
of each respondent. So that all questionnaires from each respondent had consistency ratio value less than 0.1 (< 0.1). The results of AHP processing of weight for each criterion was shown in Table 6.
Table 6. AHP result in weight for each factor and sub-factor
No Factor Weight Sub-factor Weight CR
1 ECO 0.34 Distance from
settlement
0.75 0.000
Distance from river 0.25
12
Table 6 shows the result of AHP process represented by weight for each factor and sub-factor. The right column shows the consistency ratio for each factor. From the column, it was known that the quality of questionnaire filling was good (CR < 0.1). This fact indicated that the weights could be used in the spatial analysis.
From the table, according to weight, natural conditions was the most important aspect, followed by ecology and environmental aspect. While the natural disaster vulnerability was the least important aspect. This result implied that respondent also had a concern to the ecology and environmental aspects. The same result also can be found in natural conditions aspect which had the highest weight. In natural conditions aspect, land use type had the highest weight means the most important aspect in natural condition. In land use type aspect, many ecology and environmental factors were considered. This aspect also respect to the regulation which regulate the development of new farm should be not located on prohibited land use type, and even, not located on surrounding of prohibited land use type. Mostly of the regulation said that poultry farming is essentially a rural activity and new poultry farms should be located on rural zoned land (Western Australia Planning Commission 2003). Distance from settlement in ecology and environmental aspect in this study could cope with this regulation. Every new poultry farms should be established in locations suitable to their operational requirements, to minimize the impact of poultry farms on residential, rural-residential and other potentially incompatible uses. In ecology and environmental aspect, distance from settlement considered as the most important factor.
Spatial Analysis
Suitability map was created by using weight from AHP process in the previous step and processed through weighted overlay in GIS software. Here are the analysis for each factor.
1. Analysis for ecological and environmental impact (ECO) factor
possibility to dispose the waste to river or waterbody. Based on expert’s judgment, weight for distance from river or waterbody was 0.25.
A broiler farm should be located at least 100-150 meters from the settlement to minimize the negative impact. From spatial analysis as shown by Figure 7, almost all area in Parung was categorized as very unsuitable. This was because Parung was one of the highest population density. The largest suitable area was found in the southern area, mostly located in Desa Iwul. Based on expert’s judgment, the weight
of this factor was 0.75.
Figure 7. Suitability map based on distance to settlement sub-factor
Those two sub-factors then processed through weighted overlay to become suitability map based on ecology and environmental impact factor. Figure 8 shows the suitability map based on ecology and environmental impact factor. Since distance from settlement was considered as more important than distance from river or waterbody, this suitability map was almost similar to suitability map based on distance from settlement factor.
14
2. Analysis for economic and infrastructure (ECI) factor
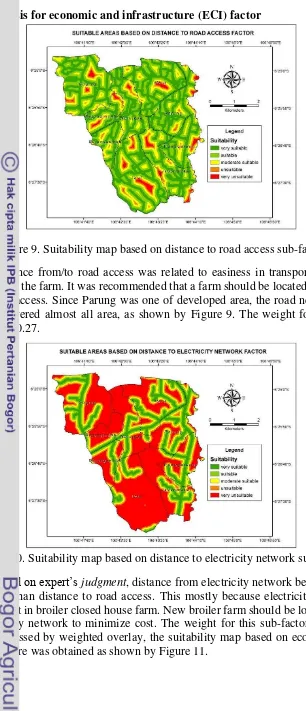
Figure 9. Suitability map based on distance to road access sub-factor Distance from/to road access was related to easiness in transporting goods from and to the farm. It was recommended that a farm should be located not too far from road access. Since Parung was one of developed area, the road network had already covered almost all area, as shown by Figure 9. The weight for this sub-factor was 0.27.
Figure 11. Suitability map based on economic and infrastructure factor 3. Analysis for natural condition (NAT) factor
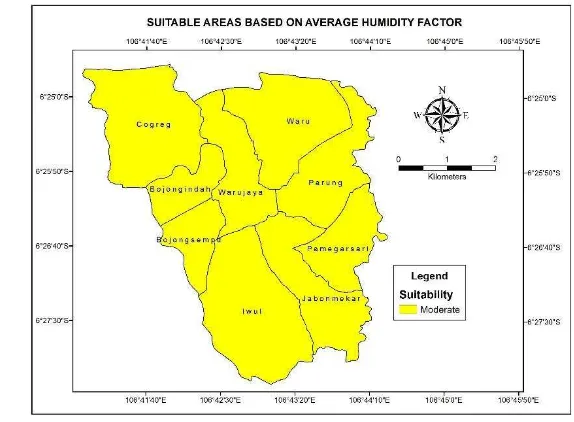
There were two climatic factors considered in natural condition factor, which were average humidity and average temperature. Based on data from the Agency of Meteorology, Climatology, and Geophysics (BMKG), refers to the nearest station, average temperature of Parung was 25oC – 30oC and average humidity was 70% - 80%. Thus, based on the data, area of Parung was categorized as moderate, both for average humidity and average temperature sub-factor as shown by Figure 12 and Figure 13.
16
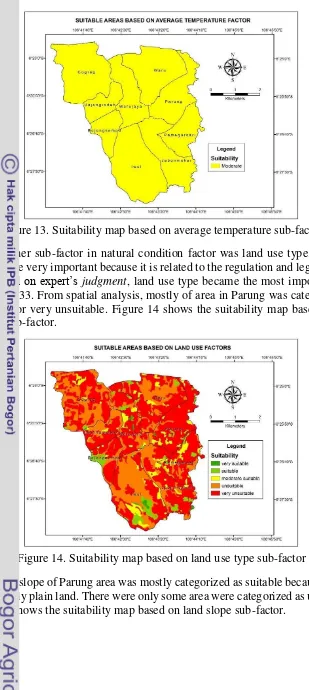
Figure 13. Suitability map based on average temperature sub-factor
Another sub-factor in natural condition factor was land use type. Land use type become very important because it is related to the regulation and legal aspects. Also, based on expert’s judgment, land use type became the most important sub-factor by 0.33. From spatial analysis, mostly of area in Parung was categorized as unsuitable or very unsuitable. Figure 14 shows the suitability map based on land use type sub-factor.
Figure 14. Suitability map based on land use type sub-factor
Figure 15. Suitability map based on land slope sub-factor
After the four sub-factors were processed by weighted overlay, the final suitability map based on natural condition factor was obtained. Figure 16 shows the suitability map based on natural condition factor.
Figure 16. Suitability map based on natural condition factor 4. Analysis for natural disaster vulnerability (DIS) factor
18
(a) (b)
(c) (d)
(e) (f)
Figure 17. Suitability maps based on natural disaster vulnerability factor. Flood vulnerability (a), fire vulnerability (b), earthquake vulnerability (c), landslide vulnerability (d), storm or puting beliung vulnerability (e), and the final suitability map based on all sub-factors in natural disaster vulnerability factor (f).
5. Suitable area based on all factors
Figure 18. Final suitability map representing suitability of area in Parung for broiler closed house farm
From the figure, it can be seen that suitable location was mostly located in Iwul, at the southern area of Parung. Figure 19 shows more detail information about area (in ha) of each suitability class for each desa/region. The largest suitable area found in Iwul, by total area of 109.56 ha. While the smallest suitable area found in Bojongindah (0.01 ha) and Parung (0.11 ha). This result match to the fact that Parung has the highest population density and the most developed area in Parung region. High population density theoretically decreases the suitability for broiler farm, especially by concerning ecology and environment aspects. The southern area, which was less developed area, has the largest suitable area. Thus, for sustainable development purpose, broiler closed house farm development in Parung region should be located in the southern area.
Figure 19. Area of each suitability class for each desa/region
0 very unsuitable 22.09 20.26 75.43 41.1 25.03 13.89 44.8 17.41 40.9 unsuitable 74.18 74.13 199.86 128.19 162.03 119.37 182.57 191.33 134.03 moderate 42.45 30.77 160.46 199.97 110.74 65.86 41.36 127.35 62.2 suitable 0.01 12.32 1.35 109.56 6.23 1.22 0.11 29.82 2.88
Area
(ha)
Desa/region
20
System Building System Development Analysis
Analysis is the first step in system or software design and development. This step was very important before the next is done. There were three aspects of analysis in this system development, which were: 1) user needs analysis, 2) functional needs analysis, and 3) non-functional needs analysis.
1. User needs analysis
User needs analysis is part of the ongoing process of system development that will effectively meet the needs of users. This process also helps to determine the technological requirements necessary to justify these needs. Target user of this system were: 1) farmer, 2) private company, and 3) government institution. Each user has the same role and right in using this system, however the interest was different to each other. Table 7 below shows the interest of each target user based on analysis.
Table 7. User interest reflecting needs
Target user Interest
Farmer 1. Location suitability information 2. Location recommendation based
on farm capacity
3. Slaughterhouse location information
Private company 1. Location suitability information 2. Suitability map
Government institution 1. Suitability map
Figure 20. Target user scheme 2. Functional needs analysis
Table 8. System functional needs No Functional needs Description
1 About the system To know the profile of the system and system developer
2 Direction to use To know the direction to use the system (user guide)
3 Contact or feedback To send recommendation, advice, information, or any feedback about the system
4 Analysis To analyze the suitability based on spatial input Needs included as non-functional needs were: 1) comfort of color and display, 2) speed of access, 3) ability of the system to serve in real time. In comfort factor, components that were emphasized in the design of this system was the selection of colors, the layout, and the use of icons. In determining location, spatial input by moving marker on the map might be difficult. Thus, a capability of location detection by using GPS is very important. Based on the analysis, it was decided that the system would be developed as Android application.
System Design
The developed system consists of three parts: 1) user interface, 2) database, and 3) processor. User interface enables interaction between users of the system (Faihah, Seminar and Wiyono 1999). User interface as the input section will be seen by user. The user interface was installed on the user device, in this case an Android device. Database was related to data management and storage. The suitability map step was exported as one table in the database. Database was not attached on the user device but stored on the server. PostgreSQL with PostGIS extension were used as spatial database management system. Processor processes the input from user, do the database query and calculation, and serve the appropriate information to the user as requested. The processor was developed by using some web programming language: php, javascript, jQuery, html+css, and application programming interface (API) such as GoogleMaps API.
Figure 21. System working scheme
22
1) User send a request, then the request will be sent through internet to the server 2) On the server, processor will process the request and decide wheter it is required to do database query to retrieve data from database or the processor needs to retrieve another data from external source.
3) If it is required to do database query, processor will do database query to retrieve data from database.
4) Data from database will be retrieved, and will be processed by processor to become information. Information will be sent to the user through internet. 5) If it is required to do data retrieval from external source, processor will retrieve
data from external source, in this case is data from the Agency of Meteorology, Climatology, and Geophysics (BMKG). BMKG serves climatic data (such as temperature, humidity, rain prediction, etc) of every cities in Indonesia. Climatic data is needed to analyze the suitability of area which are not located in Parung as study area. The data are served as .xml file which can be read by using xml parsing.
6) Data from external source will be retrieved and processed by processor to become information. Information will be sent to the user through internet. Database Design
Object-relational database design conceptually illustrates relationships data objects that will be implemented into the system (Al Ikhsan 2012). Figure 22 shows the design for database tables. The main tables are kesesuaian table, desa table, and
desa_central table which are all spatial table. The kesesuaian table is the suitability map in shapefile which was exported to become database table. One feature in the shapefile would be one row in the database table. There are five fields in kesesuaian
table: id_desa, kesesuaian, skor, luas, and geom. Field of id_desa is the primary key, represents the ID of desa or kelurahan of the location. This fields is used to find the name of desa from the desa table. Field of kesesuaian represent the suitability, this field will be read and showed to the user. The skor field represent the suitability in numerical value. The value of 1 for very unsuitable location and the value of 5 for very suitable location. This field was created to make query process become easier. The field of luas represent the area (in hectares) of each location. While the field of geom is the most important field. This field contains the coordinate of nodes of the polygon of location. Figure 23 shows some rows of
kesesuaian table in the database.
Figure 23. Some rows of Kesesuaian (suitability) table in database
The desa_central table contains only two fields: id_desa as primary key, and geom. This table used in location selection by selecting name of desa. The field of
geom is the coordinate of centroid of each desa. The concept is: when user select a desa, then the system will direct the marker to move to centroid of the desa, based on the coordinate in this table.
The kabkot table is used in location selection by using form (for location outside Parung). This table contains all cities or kabupaten in Indonesia. The other three tables: pemukiman, bencana, and perairan, are used in reasoning feature.
System Implementation
The idea for this system working is that if user put a point on a certain location, the system should be able to read whether the point is located on a certain polygon or other polygon in the suitability map, and then read the attribute of the polygon as requested by the query. Figure 24 shows the illustration of point location calculation.
Figure 24. Illustration of point location calculation
In Figure 24, there are three rectangle polygons which are polygon a, polygon
24
of the point is more than or equal to 1 and less than or equal to 7, and the y
coordinate is more than or equal 1 and less than or equal 8. In Figure 24, user put a point in coordinate of (6, 7). By using certain algorithm, since the x coordinate is more than 1 but less than 7 and coordinate of y is more than 1 but less than 8, the system will read that the point is located on polygon a, and then read the attributes of polygon a to be served as information. Also if user put a point on q (11, 4), the system will read that point q is located on polygon b by the same algorithm, and if user put a point on r (13, 5), the system will read that point r is not located on any polygon a, b, or c.
The system was implemented by using several web programming language, such as html, css, php, javascript, and jQuery. Copy of code below is example of query code written in php. This code will return the result of location suitability based on coordinate input which is represented by longitude ($lng variable) and latitude ($lat variable). Some PostGIS function are used in this code, which are ST_Within, ST_SetSRID, and ST_MakePoint. This sample code used the same principle as shown by Figure 24.
//cek kesesuaian
$cek_suai="SELECT b.nama_desa, b.luas, a.kesesuaian FROM kesesuaian AS a, desa AS b
WHERE(ST_Within(ST_SetSRID(ST_MakePoint($lng,$lat),4326 ), a.geom)) AND a.id_desa=b.id_desa";
$kueri= $cek_suai;
$output_suai = run_kueri($pg_conn_string, $kueri); $suai=$output_suai;
$kesesuaian = $suai[2];
The developed system is a web-based mobile application that can be installed on an Android device. The installer is in the form of .apk file, can be downloaded from http://arif.mit.biotrop.org or http://broilerfarmloc.web.id. After the application is installed, there will be an icon in the application list. Figure 25 shows the application icon in the application list (shown by red circle).
(a) (b) (c)
Main features in this system are: detect location using GPS (Global Positioning System), suitability based on form input, location recommender based on farm capacity, and other information according to broiler industry.
1. Detect location by using GPS
The first thing the user have to do to use this system is define the location. In this system there are two method to define location: 1) by selecting name of desa
and moving cursor on the map, or 2) detect location automatically by using mobile GPS. To define location by selecting name of desa, user have to select the name and then move the cursor to the appropriate location. However, sometimes this method is difficult to do. To help user to define location, this system can detect user’s location by using mobile GPS. As shown by Figure 26, to detect the location by using GPS, user may simply click blue button, and the system will detect the coordinate of latitude and longitude of the location. After refresh button is pressed, the yellow cursor will go to the location as detected.
Figure 26. Detect location by using GPS
Once after the location is defined, user can obtain the information of suitability according to the location. Figure 27 shows the suitability information displayed after location is defined. For area which are categorized as very unsuitable or unsuitable, a reasoning system also displayed to give reasons of why the location is categorized as very unsuitable or unsuitable.
26
2. Suitability based on form input
This feature is was developed especially for user which is not located in Parung since there was no spatial data for area outside Parung. The idea of this feature was to calculate the suitability of a location based on score of each criteria inputted by multiple choice form. Five choices are provided for each question of criteria each of which has score. The score based on choice simply multiplied by weight of the criteria. The final suitability score will be obtained hierarchically based on AHP hierarchy. Figure 28 shows the display of the input form.
Figure 28. Input form to calculate suitability for area outside Parung
The output of this feature is suitability in linguistic value, suitability in percentage, and climatic information based on the location inputted. Figure 29 shows the calculation result based on input form.
3. Location recommender based on farm capacity
This feature was designed to help farmer to choose the best location based on farm capacity which will be built. User only needs to input the farm capacity, and the system will give location recommendation based on the capacity. Figure 30 shows the recommended location based on farm capacity of 4000 heads of broiler. The recommendation is based on assumption of 1 ha of land for 40,000 heads of broiler farm capacity.
Figure 30. Recommended location based on farm capacity 4. Other information of broiler industry
Based on system development analysis, farmer also needs information according to broiler industry. The information served by using interesting chart or figure. Figure 31 shows the display of information section.
(a) (b) (c)
28
System Testing and Validation
System testing was done by comparing the output from system by expected output. Table 9 shows system testing result for some part of system. From the test, it was concluded that the system has been tested and working properly.
Table 9. System testing result Part of
system
Input Expected output System output Justification
Desa
On field validation was already done by visiting the study area. There were four points each of which representing each class of suitability. The consideration of point selection was that each point should be located in a contrast physical attributes (land use, etc), so that the suitability will be different. Figure 32 shows the location of each point of validation.
Figure 33. On field validation for point 1 (expected: very unsuitable) Based on field survey, point 1 was located on a residential and close to waterbody (small river) as shown in Figure 33. So it was predicted that the suitability of the point is very unsuitable or unsuitable.
Figure 34. System result based on coordinate of point 1 showing that location was very unsuitable
Based on system running, the same result was also obtained. The system categorized the location as very unsuitable, as shown in Figure 34. The reasoning system also gave the same characteristic as seen on the field, such as the location was exactly on the residential area, location was too close to waterbody, and location was on high risk of natural disaster.
30
Point 2 was also located on a residential area, but the population was not as dense as was point 1, as shown in Figure 35. This point was predicted as unsuitable location.
Figure 36. System result based on coordinate of point 2 showing that location was unsuitable
Based on system running, the same result was also obtained. The system categorized the location as unsuitable, as shown in Figure 36. The reasoning system also gave the same characteristic as seen on the field, such as the location was exactly on the residential area, and location was on high risk of natural disaster.
Figure 37. On field validation for point 3 (expected: moderate)
Point 3 was located on an agricultural land, yet it was located in the middle of low density settlement area, as shown in Figure 37. Based on this physical characteristic, it was predicted that the location would be categorized as moderate.
Based on system running, the same result was also obtained. The system categorized the location as moderate, as shown in Figure 38. There was no reasoning because reasoning will only displayed if the location is categorized as very unsuitable or unsuitable.
Figure 39. On field validation for point 4 (expected: suitable)
Point 4 was located in the middle of an agricultural land, as shown by Figure 39. Based on this physical characteristic, it was predicted that the location would be categorized as suitable or very unsuitable. Based on system running, the same result was also obtained. The system categorized the location as suitable, as shown by Figure 40.
Figure 40. System result based on coordinate of point 4 showing that location was suitable
4
CONCLUSION AND RECOMMENDATION
32
As recommendation, if possible, more factors (i.e. distance from existing broiler farm, distance from slaughterhouse, etc) can be added to increase the quality of the suitability map as input data to the database. Suitability map for other area outside Parung region could increase the quality of the system. It is recommended that the government can use this suitability map as decision support tool to manage zoning for broiler farming concerning ecology and environment. So, this system can be used as prototype for the development of same system for various agricultural and animal industry or other sectors by adjusting the factors and constraints.
REFERENCES
Al Ikhsan S.H. 2012. Pengembangan sistem pakar agribisnis cabai (Capcicum annuum.L) berbasis android. [master thesis]. Bogor(ID): Graduate School, Bogor Agricultural University.
Boluwade A, Ferdinand A. 2011. The Design and Development of Spatial Database Management Systems (SDMS) for Hydrographic Studies using Coupled Open-Source GIS and Relational Database. The Pacific Journal of Science and Technology 12 (1): 286-291.
Brovelli M A, Magni D. 2003. An Archeological Web GIS Application Based on Mapserver and PostGIS. The International Archives of the Photogrammetry, Remote Sensing and Spatial Information Sciences.
Ancona: International Society of Photogrammetry and Remote Sensing (ISPRS). 86-94.
[BPS] Badan Pusat Statistik. 2010. Sensus Penduduk 2010. Badan Pusat Statistik. Accessed 11 09, 2015. http://sp2010.bps.go.id/
Carvalho L M T, Ribeiro M S, de Oliveira L T, Oliveira T C A, Lozada J N, Scolforo J R S, Oliveira A D. 2007. Weighted Overlay, Fuzzy Logic and Neural Networks for Estimating Vegetation Vulnerability within the Ecological Economical Zoning of Minas Gerais, Brazil. IX Brazilian Symposium on GeoInformatics. Campos do Jordão: INPE. 171-182.
Chen, Chao-Hui, Chia-Ming Ao, Chia-Chun Yen, Ho-Sheng Chang. 2013. Application of Web-GIS Technique to Developing the Management Platform of Traffic Control Devices . Proceedings of the Eastern Asia Society for Transportation Studies. Taipei.
ESRI. 2002. Using ArcGIS Spatial Analyst. Redlands: ESRI Press.
Faihah, Sitti Eha, Kudang Boro Seminar, Suryo Wiyono. 1999. Expert System for Identification of Red Pepper Plant (Capsicum annum L.) Diseases. Buletin Keteknikan Pertanian, December: 75-86.
Fitriadi, Agus. 2011. Evaluation of regulations in determining suitable areas for chicken farming using geographic information system (case study in Singkawang, West Kalimantan).[master thesis]. Bogor (ID): Graduate School, Bogor Agricultural University.
Janssen, R, Rietveld P. 1990. Multi criteria analysis and Geographical Information Systems. An application to agricultural land use in the Netherlands. In: Hossain, M.S, Das N.G. 2010. GIS-based multi-criteria evaluation to land suitability modelling for giant prawn (Macrobrachium rosenbergii) farming in Companigonj Upazila of Noakhali, Bangladesh. Computers and Electronics in Agriculture 172-186.
Kabari, L.G, Nwachukwu E.O. 2013. Decision support system using decision tree and neural networks. Journal of Computer Engineering and Intelligent Systems 8-19.
Killic, I, Yaslioglu E. 2014. Ammonia and Carbon Dioxide Concentrations in a Layer House. Asian-Australasian Journal of Animal Sciences 27 (8): 1211-1218. doi:http://dx.doi.org/10.5713/ajas.2014.14099.
Liaghat, M, Shahabi H, Deilami B.R, Ardabili F.S, Seyedi S.N, Badri H. 2013. A multi-criteria evaluation using the analytic hierarchy process technique to analyze coastal tourism sites. ICESD 2013. Dubai: APCBEE Procedia 5. 479-485.
Mocanu, AM, Velicanu M. 2011. Building a Spatial Database for Romanian Archaeological Sites. Database Systems Journal 2 (1): 3-12.
Nasaruddin, Munadi K, Dirhamsyah M, Yuliansyah D. 2011. Web-based Geographic Information System for Aceh Natural Hazards. TELKOMNIKA
9 (1): 89-98.
Nekhay, O, Gonzalez-arenas J, Arriaza M. 2008. Suitability assessment of olive plantations for Iberian Lynx habitat restoration. 12th Congress of the European Association of Agricultural Economists - EAAE. Gent.
Prawiradiputra, P. 2008. Land Suitability for Dairy Cattle Farm Selection Using Spatial Analysis and Analytical Hierarchy Process. [master thesis]. Bogor (ID): Graduate School, Bogor Agricultural University.
Rachmawati, S. 1999. Upaya pengelolaan lingkungan usaha peternakan ayam.
Buletin Ilmu Peternakan Indonesia (Puslitbang Peternakan) 9 (2): 73-80. Saaty, T L. 1988. Decision Making for Leaders: The Analytical Hierarchy Process
34
Saaty, T L. 2008. Decision making with the analytic hierarchy process. Int. J. Services Sciences 1 (1): 83-98.
Singh, P S, Chutia D, Sudhakar S. 2012. Development of a Web Based GIS Application for Spatial Natural Resources Information System Using Effective Opensource Software and Standards. Journal of Geographic Information System 4: 261-266.
Western Australia Planning Commission. 2003. State Planning Policy 4.3 Poultry Farms. Department of Planning, Western Australia Planning Commission.
Accessed 10 19, 2015.
http://www.planning.wa.gov.au/publications/1179.asp.
Wing, M.G, and P Bettinger. 2008. Geographic Information System: Applications in Natural Resource Management. Ontario: Oxford University Press. Worral L. 1990. Spatial Analysis and Spatial Policy using Geographic Information
Systems. In: Rikalovic, A, Cosic I, Lazarevic D. 2014. GIS based multi-criteria analysis for industrial site selection. 24th DAAAM International Symposium on Intelligent Manufacturing and Automation, 2013. Zadar: Procedia Engineering 69. 1054-1063
36
Appendix 1 Questionnaire
LEMBAR PENGISIAN KUESIONER
A. Identitas respondenTanggal pengisian (hari/bulan/tahun) :
Jam mulai pengisian :
Nama lengkap responden : Jabatan/profesi dan instansi :
B. Pertanyaan Kuesioner Metode Perbandingan Berpasangan 1. Penentuan lokasi ditinjau dari aspek ekologi atau dampak terhadap
lingkungan, terdapat beberapa kriteria yang mempengaruhi: a. Jarak dari sumber air (sungai dan danau) (JSA)
b. Jarak dari pemukiman (JPM)
Bandingkanlah besarnya tingkat kepentingan diantara kriteria-kriteria tersebut, sehingga menentukan besarnya bobot tiap-tiap kriteria tersebut:
Aspek
2. Penentuan lokasi ditinjau dari aspek ekonomi dan infrastruktur, terdapat beberapa kriteria yang mempengaruhi:
a. Jarak dari jalan (JJL) b. Pasokan listrik (PLS)
Bandingkanlah besarnya tingkat kepentingan diantara kriteria-kriteria tersebut, sehingga menentukan besarnya bobot tiap-tiap kriteria tersebut: