THE IMPACTS OF NON-TARIFF MEASURES ON
INDONESIAN COFFEE EXPORTS: EVIDENCE FROM
THE SPS AND TBT MEASURES
YUSMITA SITI HAJAR FARIDA
POSTGRADUATE SCHOOL
BOGOR AGRICULTURAL UNIVERSITY BOGOR
STATUTORY DECLARATION
I, Yusmita Siti Hajar Farida, hereby declare that the master thesis entitled
“The Impacts of Non-Tariff Measures on Indonesian Coffee Exports: Evidence from the SPS and TBT Measures” is my original work under the supervision of Advisory Committee and has not been submitted in any form and to another higher education institution. This thesis is submitted independently without having used any other source or means stated therein. Any source of information originated from published and unpublished work already stated in the part of references of this thesis.
Herewith I passed the thesis copyright to Bogor Agricultural University.
Bogor, September 2015
RINGKASAN
YUSMITA SITI HAJAR FARIDA. Dampak Non-Tariff Measures terhadap Ekspor Kopi Indonesia: Bukti dari Measures SPS dan TBT.Di bawah bimbingan HERMANTO SIREGAR and FLORIAN PLOECKL.
Ada concern yang meningkat mengenai dampak non-tariff measures (NTMs) pada kopi sehubungan dengan kesadaran konsumen akan keamanan pangan pada kopi. Sementara beberapa faktor mungkin mempengaruhi pemberlakuan NTMs pada kopi, NTMs tetap diperdebatkan apakah NTMs bersifat hambatan atau katalis terhadap perdagangan kopi. Tujuan pertama dari studi ini adalah untuk mengukur pengaruh faktor-faktor pada pemberlakuan NTMs pada kopi. Probabilitas adanya NTMs pada kopi diestimasi menggunakan model logit yang mencakup 43 negara pengonsumsi kopi. Data yang digunakan adalah data sekunder yang diperoleh dari berbagai sumber yaitu harga ekspor dan harga impor kopi, GDP per capita, populasi, laju partisipasi angkatan tenaga kerja, konsumsi kopi dan NTMs. Selain itu, studi ini juga bertujuan untuk menganalisis dampak NTMs, khususnya sanitary and phytosanitary (SPS) dan technical barrier to trade (TBT), terhadap ekspor kopi Indonesia yang diestimasi menggunakan model gravity dengan data panel. Data sekunder yang digunakan adalah nilai ekspor kopi, GDP nominal, jarak bilateral, populasi, produksi kopi dan dummy NTMs, SPS dan TBT serta dummy tahun.
Hasil estimasi menunjukkan signifikansi konsumsi, harga ekspor dan harga impor mempengaruhi adanya NTMs pada kopi pada tiga model berbeda. Signifikansi ketiga variabel tersebut menunjukkan bahwa negara konsumen kopi cenderung memberlakukan NTMs pada kopi dan probabilitas konsumen memilih produk kopi berkualitas tinggi semakin besar. Sementara itu, dampak NTMs adalah katalis terhadap perdagangan kopi, yang dikonstribusikan sebagian besar oleh signifikansi positif dari TBT. Secara singkat, NTMs, khususnya TBT, pada kopi dapat meningkatkan perdagangan kopi. Selanjutnya, SPS tidak mempengaruhi perdagangan kopi antara Indonesia dan negara importer utama.
SUMMARY
YUSMITA SITI HAJAR FARIDA. The Impacts of Non-Tariff Measures on Indonesian Coffee Exports: Evidence from the SPS and TBT Measures. Under Supervision of HERMANTO SIREGAR and FLORIAN PLOECKL.
There have been growing concerns about the impact of non-tariff measures (NTMs) on coffee in relation to consumer awareness of food safety of coffee. While some factors might influence the existence of NTMs on coffee, it remains debatable whether they are a barrier or catalyst to its trade. The first objectives of this study is to quantify the influence of factors on the incidence of NTMs on coffee. The probability of the presence of NTMs on coffee is assessed using a logit model covering 43 countries. Data used is secondary data obtained from many sources, i.e. export and import price, GDP per capita, population, labour force participation rate, coffee consumption and NTMs. Meanwhile, this study also aims at analysing the impacts of NTMs, especially for sanitary and phytosanitary (SPS) and technical barrier to trade (TBT), on Indonesian coffee export which is estimated utilising a gravity model with panel data. Secondary data used is the export value of coffee, nominal GDP, bilateral distance, population, coffee production, and dummies of NTMs, SPS and TBT as well as year dummy.
The estimated result indicates the significance of consumption, export price and import price in influencing the presence of NTMs on coffee in three different models. The significance of three variables shows that coffee-consuming countries tend to impose NTMs on coffee and the probability of consumers to prefer high-quality coffee is higher. Moreover, the impact of NTMs might be a catalyst to coffee trade, which is contributed largely by the positive significance of TBT. In brief, NTMs, especially for TBT, on coffee can increase the coffee trade. Further, SPS does not affect coffee trade between Indonesia and main importing countries.
© Copyright belongs to IPB, 2015
All Rights Reserved LawProhibited quoting part or all of this paper without including or mentioning the source. The quotation is only for educational purposes, research, scientific writing, preparation of reports, writing criticism, or review an issue; and citations are not detrimental to the interests of IPB.
Master Thesis
as a requirement to obtain a degree Master of Science in
Economics Program
THE IMPACTS OF NON-TARIFF MEASURES ON
INDONESIAN COFFEE EXPORTS: EVIDENCE FROM
THE SPS AND TBT MEASURES
POSTGRADUATE SCHOOL
BOGOR AGRICULTURAL UNIVERSITY BOGOR
2015
Thesis Title : The Impacts of Non-Tariff Measures on Indonesian Coffee Exports: Evidence from the SPS and TBT Measures
Name : Yusmita Siti Hajar Farida
NIM : H151120321
Approved Advisory Committee,
Prof Dr Ir Hermanto Siregar, MEc Dr Florian Ploeckl
Agreed
Coordinator of Major Economics Dean of Postgraduate School
Dr Lukytawati Anggraeni, SP, MSi Dr Ir Dahrul Syah, MScAgr
ACKNOWLEDGEMENT
‘For indeed, with hardship (will be) ease’ (The Quran 94:5). My greatest
gratitude goes to My God Almighty, Allah SWT, who has provided me strength and ability to accomplish my thesis. This thesis would not have been possible without the help of the following people in numerous ways.
I would like to express my deepest gratitude to my supervisor, Dr Florian Ploeckl, for his outstanding and immense knowledge, worthwhile suggestions, ideas and patience during the course of this thesis. His guidance and technical assistance led me to finish my thesis. My sincere thanks also go to Prof. Hermanto Siregar for absolute support, motivation and encouragement.
I highly appreciate all lecturers in the School of Economics who shared their valuable knowledge and perspectives in economics. I cannot find words to express my honour to all staff of the University of Adelaide, especially Niranjala, Gus, Nicole and Athena who support my study life in Adelaide.
I would like to thank the Ministry of Trade and Australian Awards Scholarship for providing sponsorship to undertake my study in Bogor and Adelaide. I also wish to thank the Bogor Agricultural University and University of Adelaide for providing me the chances to pursue my academic achievement. Special thanks are given to my institution, the Directorate of Quality Development–the Ministry of Trade.
I would also like to acknowledge Elite Editing for providing me editorial assistance to improve the quality of my thesis. The editorial intervention was restricted to Standards D and E of the Australian Standards for Editing Practice.
I am also indebted to all of my friends for their time, discussion and care in Indonesia and Adelaide. They are not only inspiring to me in their stories and lives, but also in spending time together to have fun.
Last but not the least, I owe more gratitude and honour to my parents and younger brother, who have supported and encouraged me throughout this challenging period of study. I am very grateful for having their spiritual blessing, tender love and patience. I dedicate my thesis to them.
All errors are, of course, my own.
Bogor, September 2015
TABLE OF CONTENTS
LIST OF FIGURES xiii
LIST OF TABLES xiii
LIST OF APPENDIXES xiii
1 INTRODUCTION 1
2 BACKGROUND 3
World Coffee Market 3
Indonesian Coffee 5
Trade Barriers on Coffee 7
3 LITERATURE REVIEW 8
Lemons Market Theory 8
SPS and TBT Measures in Lemons Market Theory 9
The Trade and Welfare Effects of SPS and TBT 10
4 METHODOLOGIES AND DATA 12
Logit Model 13
Gravity Model 14
5 RESULTS 17
The Incidence of NTMs on Coffee 17
The Impacts of NTMs on Indonesian Coffee Exports 19
6 CONCLUSION AND POLICY IMPLICATIONS 23
Conclusion 23
Policy Implications 24
REFERENCES 25
LIST OF FIGURES
Figure 1 Volume and value of exports in coffee crops from 2003/04 to
2013/14 3
Figure 2 Coffee production in main exporting countries 4
Figure 3 Price volatility of coffee 5
Figure 4 Indonesian coffee exports to the world 6
Figure 5 Coffee production in Indonesia 6
Figure 6 The impact of SPS or TBT measures on trade and welfare: 11 Figure 7 The impact of SPS or TBT measures on trade and welfare: 12
LIST OF TABLES
Table 1 The logit model for determinants influencing the incidence of
NTMs on coffee 18
Table 2 The regression results for the impacts of NTMs on Indonesian
coffee exports 20
LIST OF APPENDIXES
Appendix 1 The notification on NTMs for coffee in 2012 29 Appendix 2 The notification on SPS and TBT agreements for coffee
between 2001 and 2013 30
1
INTRODUCTION
As international trade expanded enormously as a result of economic liberalisation, the trade performance for some developing countries (DCs) has shown substantial progress, even though they should have struggled into the integrated world trading system (Henson & Loader 2001). International trade plays an important role in providing market access from DCs to developed countries, particularly for agricultural products. UNCTAD (2013) revealed that traditional trade policies might have not restricted market access in the era of trade liberalisation, since tariff measures have continued to decline since the establishment of the General Agreement on Tariffs and Trade (GATT) and the World Trade Organization (WTO). However, agricultural export has been challenged by the imposition of non-tariff measures (NTMs), which demand compliance from exporting countries.
Concerns have been raised over the implementation of NTMs in recent years, which are assumed to having a critical role in international trade (Disdier & van Tongeren 2010). It became a subject of public debate when the increasing number of NTMs affected trade, especially sanitary and phytosanitary (SPS) and technical barrier to trade (TBT) measures. As stated by WTO (2015d), SPS and TBT measures have a trade-impeding effect, particularly for DCs, which can be driven by producer or consumer, while the argument of imposing SPS or TBT measures is more reliable and scientifically proven on the basis of health, safety and consumer protection. In this regard, agricultural products are more affected by these measures than non-agricultural products, despite many complaints on the implementation of technical measures proposed by some DCs (UNCTAD 2005).
Coffee is one of several strategic agricultural commodities that have contributed prominently to enhance DCs’ economies. Considering that coffee production mostly originates from DCs and the least developing countries (LDCs), whereas majority of consumers stem from industrialised countries, coffee
is taken into account as a vital commodity for the country’s agent of development
(ICO 2010a). Coffee, as one of the main agricultural commodities, also makes a significant contribution to the Indonesian economy. In Indonesia, coffee is mostly grown by smallholders involving rural families, while the rest of the coffee plantations are owned by private companies and government. Therefore, coffee trade can improve the livelihoods of smallholder families, since coffee production is labour-intensive and provides employment in rural areas. Nevertheless, Wahyudi and Jati (2012) stated that the application of coffee processing is still used by coffee farmers in a conventional way, which is likely to cause low-quality coffee.
2
coffee. Therefore, incidents of non-compliance with those requirements can lead to import rejection due to the differences of standards and technical measures across countries. For instance, Japan claimed that Indonesian coffee contained levels of chemical substances not permitted by the allowable maximum residue limits (MRLs). As a result, an inferior quality of coffee was rejected by re-exporting or destroying it and consequently, it can cause a substantial drop in coffee exports (Slette & Wiyono 2013).
While Indonesian coffee is considered a favourable coffee, due to the taste and flavours, it is ranked fourth after Brazil, Vietnam, and Colombia in the world market. In fact, the implementation of NTMs on coffee may have hindered coffee exports. Hence, it raises several questions:
1. What are the determinants influencing the imposition of NTMs on coffee? 2. What are the impacts of NTMs, either SPS or TBT measure, on the trade
flow of Indonesian coffee? This study also provides the relevant economic insights about potential
determinants affecting these measures by utilising the logit model. Using the gravity model, this study also estimates the influence of these measures on coffee trade, whether it is a barrier or catalyst to the trade of Indonesian coffee in providing greater transparency, and trade facilitation for coffee exporters and policy makers.
3
2
BACKGROUND
Coffee, as the most traded agricultural commodity, has played a leading role in the world economy in which the economies of DCs and developed countries are interconnected. The contribution of coffee is significant as a source of national revenues, foreign exchange earnings, employment and economic growth (Arifin 1999).
World Coffee Market
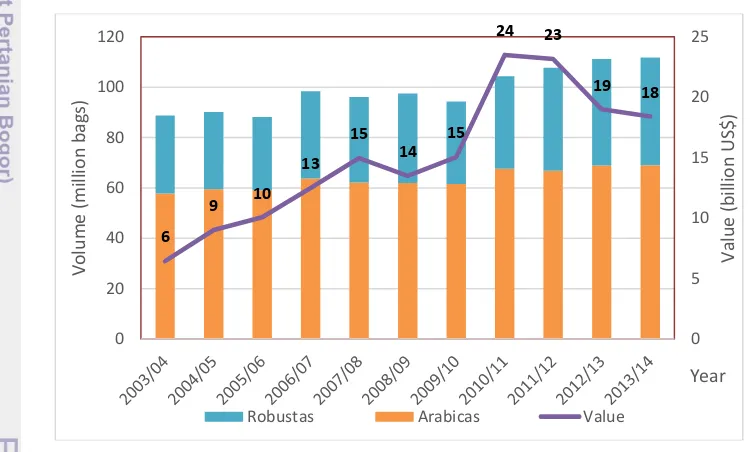
The coffee market worldwide has shown varying trade performances during the last 10 years. Figure 1 depicts an upward trend in coffee exports between 2003/04 and 2013/14. The export volume increased by 26 per cent from 89 to 112 million bags between crop year 2003/04 and 2013/14 with the same proportion of arabica and robusta. Similarly, the earnings of coffee exports in 2013/14 increased to US$18.4 billion with a peak in 2010/11. This trade performance seems to grow depending on market fundamentals linked to the supply and demand patterns.
Figure 1 Volume and value of exports in coffee crops from 2003/04 to 2013/14 Source: (ICO 2009b, 2010b, 2015b)
4
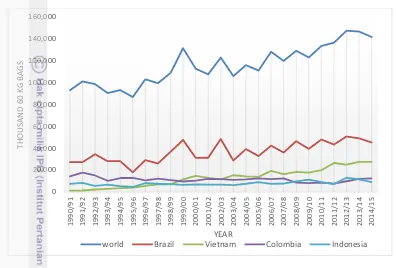
emerging producer. It contributes to a quarter of world production because of the lack of a volatile regular biennial cycle. In contrast, Indonesia has experienced stagnant production because of the ageing coffee trees and no area expansions (Arifin 1999).
Figure 2 Coffee production in main exporting countries Source: (ICO 2015a)
Coffee consumption is continuously growing, characterised by the transition of coffee consumption from traditional markets to exporting countries and emerging markets (ICO 2014a). This transition is related to gross domestic product (GDP), urbanisation and demographic evolution. Despite the weak consumption in traditional markets, the rise in world coffee consumption is strongly attributable to the increasing demand in coffee-producing countries and emerging markets (ICO 2014b). If this coffee consumption shows a sustained trend of demand growth, it can create potential prospects for the coffee sector.
5 Price volatility has a large impact on the earnings of producers and consumers. ICO (2009a) highlighted that price volatility can cause economic shocks for the commodity-dependent developing countries (CDDCs) and higher processing costs for importers, in the case of roasted coffee. However, Maurice and Davis (2011) explained that CDDCs have more structural vulnerability to the turbulence of increased commodity markets than developed countries since they lead to lower earnings of commodity exports.
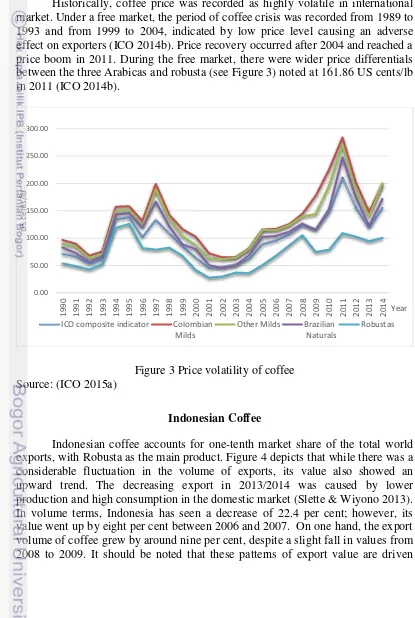
Historically, coffee price was recorded as highly volatile in international market. Under a free market, the period of coffee crisis was recorded from 1989 to 1993 and from 1999 to 2004, indicated by low price level causing an adverse effect on exporters (ICO 2014b). Price recovery occurred after 2004 and reached a price boom in 2011. During the free market, there were wider price differentials between the three Arabicas and robusta (see Figure 3) noted at 161.86 US cents/lb in 2011 (ICO 2014b).
Figure 3 Price volatility of coffee Source: (ICO 2015a)
Indonesian Coffee
Indonesian coffee accounts for one-tenth market share of the total world exports, with Robusta as the main product. Figure 4 depicts that while there was a considerable fluctuation in the volume of exports, its value also showed an upward trend. The decreasing export in 2013/2014 was caused by lower production and high consumption in the domestic market (Slette & Wiyono 2013). In volume terms, Indonesia has seen a decrease of 22.4 per cent; however, its value went up by eight per cent between 2006 and 2007. On one hand, the export volume of coffee grew by around nine per cent, despite a slight fall in values from 2008 to 2009. It should be noted that these patterns of export value are driven
1990 1991 1992 1993 1994 1995 1996 1997 1998 1999 2000 2001 2002 2003 2004 2005 2006 2007 2008 2009 2010 2011 2012 2013 2014
6
largely by the changes in price when the export volume increases or decreases. Thus, the value of coffee exports can be negatively affected by low price in spite of a strong rise in volumes.
Figure 4 Indonesian coffee exports to the world Source: (UNCOMTRADE 2015)
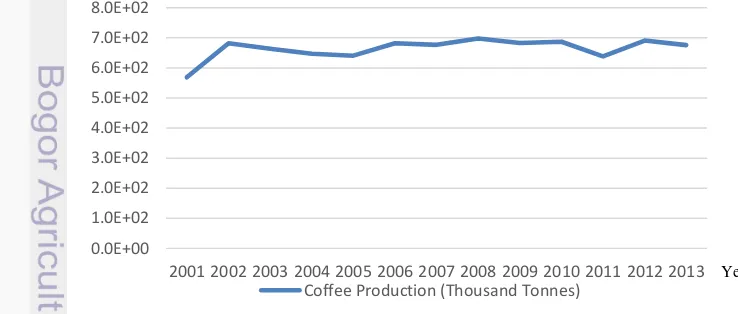
Indonesia has recorded only a slight increase in coffee production over the last 10 years, due to the limited area and the uncertain climate. Panhuysen and Pierrot (2014) affirmed that coffee production suffered from the climate change. Consequently, coffee plants are vulnerable to climate change because pests, mould and diseases will grow easily and damage the output and quality of coffee. According to Slette and Wiyono (2013), long-term drought also brought conditions of flowering and budding down in Indonesia between June and September 2012. This added to the impact of rainfall on young coffee cherries from December 2012 to January 2013, causing a loss in coffee cherries. Thus, these external factors can damage the production and quality of coffee. As shown in Figure 5, coffee production fell by 2.2 per cent in 2013, likely caused by
2000 2001 2002 2003 2004 2005 2006 2007 2008 2009 2010 2011 2012 2013
v
2001 2002 2003 2004 2005 2006 2007 2008 2009 2010 2011 2012 2013 Coffee Production (Thousand Tonnes)
7 It has been acknowledged that coffee production can be influenced by the agricultural practices applied by growers and coffee plant condition. Slette and Wiyono (2013) revealed that coffee growers on farm sites have poor knowledge of good agricultural practices. Additionally, low-quality seeds and old trees are vulnerable to disease and adverse weather. Susila (2005) stated that coffee yield with high moisture content is correlated with Ochratoxin A (OTA), negatively affecting coffee quality. Consequently, the coffee productivity drops and coffee yields are not suitable for market demand for high-quality coffee.
Nowadays, the growth of coffee consumption in Indonesia is strongly affected by domestic demand and supply. Slette and Wiyono (2013) asserted that excessive coffee demand is influenced by stable economic growth, youth population, lifestyle changes and the expanding middle class. The supply side includes the growing franchises and entrepreneurs, and innovative products. These characteristics offer considerable potential to the growth of coffee consumption in Indonesia and a great chance for development of the local market. A positive shift in domestic demand and supply would stimulate an increase in coffee demand and provide competitive prices for growers in market equilibrium. As projected by analysts, Indonesian coffee consumption will reach 2.58 million bags, a 3.61 per cent increase from 2012/13 to 2013/14 (Slette and Wiyono 2013).
However, prospects for coffee exports are still promising, taking into account the continual increase in export performance. More than two-thirds of Indonesian-produced coffee is exported worldwide compared to domestic consumption, making coffee an export-oriented commodity that is apparently essential for foreign exchange earnings.
Trade Barriers on Coffee
Exporting countries are increasingly confronting NTMs on coffee as the tariff rate has been declining over decades. According to ICO (2011), tariffs for raw and unprocessed coffee products in importing countries are fairly low compared with refined coffee products. Tariffs levied on coffee increases as green beans are further refined to roasted, decaffeinated and soluble coffee, known as tariff escalation. In addition to tariffs, higher taxes, such as value added tax (VAT) and excise duties, are also levied on processed coffee products rather than green beans. Due to the subject of study’s domination by the largest proportion of green coffee, the effect of tariff and taxes on coffee is becoming insignificant.
8
Indonesian coffee has been affected by SPS barriers primarily from Japan and the European Union (EU). Slette and Wiyono (2013) stated that due to the pesticide residue on coffee, 20 and 30 containers of robusta coffee beans were rejected in Japan because they exceeded the permitted MRLs of carbaryl on the Japan Positive List of Regulation on Food Safety, ranging from 0.5 to 0.7 mg carbaryl. Although Codex does not list carbaryl residue on coffee, Japan and EU impose carbaryl limits on coffee at 0.01 and 0.1 milligrams per kilogram, respectively. As Japan and EU are Indonesia’s main coffee importers, it has been contended that this regulation is negatively correlated to the trade flow of Indonesian coffee and has hit the potential future exports of coffee.
The most sensitive issue of food safety is the occurrence of OTA on coffee. As the leading coffee importers, EU set the level of tolerable OTA on roasted and soluble coffee (i.e., five and 10 parts per billion (ppb)) in the mid of 2005 (Nugroho 2014), although OTA contamination was relatively low, ranging between 0.74 and 2.7 ppb (Susila 2005). Consequently, Indonesian coffee exports might be constrained by this measure, although the OTA level is lower than the specified OTA level.
Further, consumers are increasingly demanding sustainable coffee, with minimal social and environmental impacts, which has necessitated certification and labelling schemes. However, Indonesian coffee is mostly driven by smallholders with limited finances, making it difficult to provide certification on coffee. Subsequently, Indonesian coffee lacks certification, which leads to the loss of competitiveness in the global market. Accordingly, the uncertified coffee cannot provide economic sustainability, such as market share and premium price, resulting in the inability of smallholders to certify their coffee.
3
LITERATURE REVIEW
SPS and TBT measures on coffee play a significant role in international trade. Through the lemons market approach, understanding SPS and TBT measures on coffee is of great importance to study how those measures can affect the economy, and trade as well as welfare.
Lemons Market Theory
9 Malouche and Sáez (2012), this uncertain condition created by sellers drives high-grade used car owners out of the market: the bad drives out the good. Finally, only low-grade used cars are found in the market, which results in low quality and market size.
SPS and TBT Measures in Lemons Market Theory
The application of some technical measures is utilised as a trade instrument to encounter market failure in pursuit of legitimate government objectives in relation to consumers’ health and safety. Those measures could be the more preferred policy by directly targeting the source of market failure without distorting trade in order to maximise national welfare (WTO 2015d). By definition, market failure is a situation where an outcome is not pareto-optimal from collective standpoints. That is, individuals can be made better off without making someone worse off. The existence of market failure can be characterised by the pursuit of pure self-interest leading to inefficient results. For example, market failure may be built by low-quality product suppliers who drive high-quality product suppliers out of the market, known as a ‘lemons market theory’ (Cadot, Malouche and Sáez 2012). Additionally, market failure occurs when individuals are unlikely to be fully aware of hazardous food alerts or make irrational decisions about their chosen food. As a result, the market generates an inefficient outcome.
Further, the lemons problem caused by asymmetric information on health, safety and nutritional value can lead to market failure. Asymmetric information refers to a condition where market participants have better information than the others. Asymmetric information also occurs when less-informed buyers are unlikely to recognise defective imported products (Cadot, Malouche and Sáez 2012) that are contaminated by harmful pathogens, which can have health hazards for consumers (Antle 1999). On one hand, asymmetric information can likewise provoke a number of market failures. In the case of low-quality products, many unsafe foods in the market may trigger an outbreak of food-borne illness (WTO 2015d). The society will bear the burden of spillover effects, such as the recovery or social costs, which are not covered by the origin producers.
There is a strong relationship between asymmetric information and international trade. Bond (1984) revealed that trade loss takes place if low-quality products from the exporting country are traded in the country producing high-quality products. In this regard, there are differences of safety and high-quality between the home country with high-quality products and low-quality producing country. Suppose that consumer preference in both countries differs in terms of quality, with the higher showing willingness to pay to obtain high-quality products and in turn, the others unwilling to pay more. Due to the unknown country of origin, the differences of product characteristics are difficult to be observed by consumers until they decide to purchase, which creates bad choices in consumption.
10
on scientific justification. These measures are advantageous to protect humans from food contaminated by hazardous materials, in terms of the reduction in mortality and morbidity (Antle 1999). Of all measures, the labelling scheme is one of the best policies to provide product information to consumers between high-quality and low-high-quality products so that they can distinguish between them. Pienaar (2005) revealed that products’ labelling based on the country of origin provides consumers sufficient information to identify the product’s quality and safety. UNCTAD (2013) stated that consumer uncertainty about the products’ quality could be reduced by labelling and as a result, it generates a higher willingness to pay and enhances profits.
On one hand, SPS standards can offer quality assurance for consumer and
increase consumers’ trust in products by delivering information flow from exporters to importers and ultimately to consumers. Inevitably, standards can provide solutions for information problems and increase efficiency. Penello (2014) stated that these measures can be justified because of the decrease in asymmetric information between producer and consumer by means of providing a signal to the market player that is in accordance with the requirements. In spite of associated with trade-impeding effects, SPS standards can guarantee product quality to consumers by providing streamlined information about quality and safety, which is supposed to reduce trade cost. Therefore, the improved product quality can have influenced positively consumer confidence due to its quality assurance so that those products are potentially in overwhelming demand and their trade would increase.
The Trade and Welfare Effects of SPS and TBT
Regardless of the legitimate objectives of SPS and TBT, those measures are difficult to assess in terms of their impacts on trade and welfare depending on the government motive (WTO 2015d). The implementation of technical measures may increase or reduce trade, despite greater consumer trust in products, as
implied by consumers’ demand. The size of trade effects can be measured by the
magnitude of consumers’ demand, which can counterbalance the higher compliance costs. By reducing consumer uncertainty about product safety and quality, the importance of technical measures is highly relevant if these measures can target the existing market failures correctly. These are signalled by possible increases in welfare and the ambiguous effects of trade. Nonetheless, if there is a decline in trade and welfare, the reasons why governments intervene in these measures are questionable. Therefore, the effects of those technical measures can be either a barrier or a catalyst for trade if imported products are necessary to comply with technical requirements.
11 goods and an increased price, creating a decline in social welfare. Unlike consumers, however, domestic producers have benefited from less competition caused by the recall of exporters and the limited sales of remaining exporters in the domestic market.
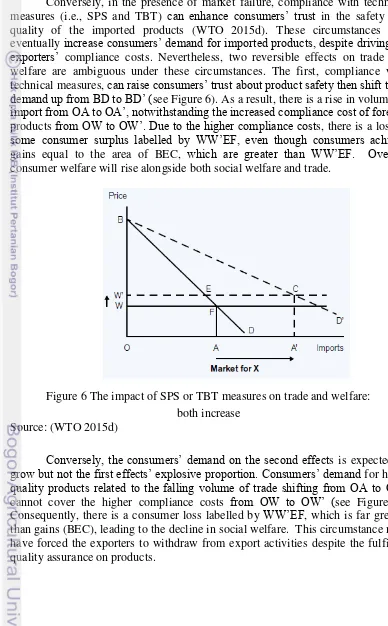
Conversely, in the presence of market failure, compliance with technical measures (i.e., SPS and TBT) can enhance consumers’ trust in the safety and quality of the imported products (WTO 2015d). These circumstances will eventually increase consumers’ demand for imported products, despite driving up
exporters’ compliance costs. Nevertheless, two reversible effects on trade and welfare are ambiguous under these circumstances. The first, compliance with technical measures, can raise consumers’ trust about product safety then shift their
demand up from BD to BD’ (see Figure 6). As a result, there is a rise in volume of
import from OA to OA’, notwithstanding the increased compliance cost of foreign
products from OW to OW’. Due to the higher compliance costs, there is a loss in
some consumer surplus labelled by WW’EF, even though consumers achieve
gains equal to the area of BEC, which are greater than WW’EF. Overall, consumer welfare will rise alongside both social welfare and trade.
Figure 6 The impact of SPS or TBT measures on trade and welfare: both increase
Source: (WTO 2015d)
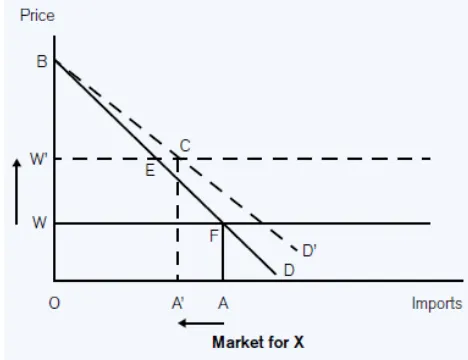
Conversely, the consumers’ demand on the second effects is expected to
grow but not the first effects’ explosive proportion. Consumers’ demand for
high-quality products related to the falling volume of trade shifting from OA to OA’
12
Figure 7 The impact of SPS or TBT measures on trade and welfare: both decrease
Source: (WTO 2015d)
In brief, the application of technical measures is likely to increase trade leading to a rise in welfare and vice versa. However, Swann (2010) discovered there is no single answer to explain the impact of international standards and trade and how the multiple economic effects of standards can interact. It might become difficult to obtain the corresponding impacts because it is not prevailing under general conditions. The application of NTMs has various impacts based on the affected sector and countries. Some DCs and least developing countries (LDCs) face higher imposition of technical measures than developed countries. As shown by Looi Kee, Nicita and Olarreaga (2009), DCs and LDCs’ exports have a large share of trade influenced negatively by SPS and TBT, particularly on export of agricultural products to the EU market compared to OECD countries. According to UNCTAD (2013), the application of technical measures are costly because of the required improvement in high technology and supporting infrastructures. Meanwhile, the effects of SPS and TBT in agricultural sectors are generally much larger than those in manufactured products. In this regard, Moenius (2004) stated that although there is a positive effect of shared standards on trade, agricultural trade has a negative impact on importer-specific standards and their effects on manufactured goods seem to be positive. In addition, agricultural products are more highly sensitive to the implementation of SPS and TBT. This is evidenced by the finding of Sithamaparam and Devadason (2011) that higher SPS and TBT have a negative and statistically significant effect on Malaysian exports of agricultural products.
4
METHODOLOGIES AND DATA
13
Logit Model
The logit model, or the logistic regression, is used to measure the correlation between binary or dichotomous outcome (dependent or response) variables and one or more independent (predictor or explanatory) variables in order to explain the probabilities of outcome variables (Hosmer Jr, Lemeshow & Sturdivant 2013). Using a logit model, the influence of factors on the incidence of NTMs can be examined, either SPS or TBT, in order to identify the determinants that could have influenced the occurrence of NTMs on coffee. In this model, it is assumed that the binary variables are coded as either 0 or 1, and thus, binary variables takes 0 for the absence of NTMs and 1 for the presence of NTMs in this study.
The simple form of logit model is:
� �� = � �� � � �� = � − � �� � = + � (1)
Regarding the number of observations, the linear logistic model can be extended for the dependence of pi on k explanatory variables (Collett 1991; Hosmer Jr, Lemeshow & Sturdivant 2013), known as the multiple logistic regression model:
� �� = � ���
− ��� = + � + � + ⋯ + � (2)
Where p is the probability of indicators influencing the presence of NTMs on coffee, β0 is the intercept, and βi is the regression coefficient. To derive an equation to predict the probability of the occurrence of NTMs on coffee, both sides of equation are exponentiated as follows:
P = probability = eβ + β x
eβ + β x (3)
14
This study uses three logit models to capture the determinants affecting the presence of NTMs, either SPS or TBT, on coffee. All models include observations including x indicators and the explanatory variable specifying whether NTMs is imposed and then examines variables affecting the presence of NTMs on coffee.
Model 1:
= + + + + � (4)
Model 2:
= + � + + + +
� (5)
Model 3:
= + � + � � + + +
+ � (6)
Where ‘EXPPRICE and IMPPRICE’ indicates the price of exported or imported coffee, which is comparison of the value of exported or imported coffee
and the volume of exported or imported coffee, ‘GDPCAP’ is the level of income
of each country weighted by population. ‘POP’ or population indicates the size of
country, ‘LABFORCE’ is the proportion of the population at aged of 15 and 64 years old, that is economically active and ‘CONSUMPTION’ consumption per capita is defined by the total coffee consumption in kilograms divided by total population in each country. The qualitative dependent variable is NTMs, which takes on the value of 1 if the country imposed NTMs, either SPS or TBT measure, and 0 if no imposition of NTMs.
All secondary data are collected only for the selected year: 2012. The dataset is of cross section covering 43 countries based on the availability of consumption data. This study uses HS 0901 (i.e., coffee, coffee husks and skins and coffee substitutes) as a subject of analysis. Export price and import price are calculated based on the data of export and import from UNCOMTRADE. Data for GDP per capita, population, labour force participation rate are from World Development Indicators (WDI), whereas coffee consumption is from the International Coffee Organization (ICO). Information of NTMs focussing on SPS and TBT is taken from WTO.
Gravity Model
This study aims to measure the effects of NTM, specifically for SPS or TBT, on Indonesian coffee exported to major importing countries. This study uses coffee as a subject of study because not only it is a prioritised exported product in Indonesia, but there are rising concerns about the food safety of coffee in the importing countries and the tightened regulation of SPS and TBT measures on coffee.
15 entities. As Tinbergen (1963) wrote, the gravity equation measures the interaction of trade flows between two countries in proportion to their respective GDPs and proximity on the ground of the Newtonian theory of gravitation. The gravity equation provides an appropriate framework to analyse the relationship between the economic size, distance and the amount of trade, though without a strong theoretical foundation (Bacchetta et al. 2012). Anderson and Van Wincoop (2003) showed that the gravity model can be explained theoretically by introducing the constant elasticity of substitution (CES) utility function and heterogeneous goods subject to budget constraint based on consumer preference to assess trade patterns. Additionally, the iceberg trade costs, such as distance, trade agreements, tariff and NTMs, were introduced in this model because price differentials occurred among countries.
According to Anderson and Van Wincoop (2003), the general form of gravity equation can be written as:
X = Y YY (t ) −σ(Π P)σ− (7)
Where Xij is the value of exports from exporting country i to importing country j, Yi and Yj denotes the GDP of countries i and j, Y denotes world GDP, tij represents the trade cost, Πiand Pjare the easiness of market access or multilateral resistance variables and σ > 1 is the elasticity of substitution between all goods.
By deriving specification and variables, gravity equation has estimated trade flows accurately based on economic theory by means of controlling relative trade costs as multilateral trade resistance (Bacchetta et al. 2012). This term refers to the presence of trade barriers that not only include distance but also NTMs.
In this study, the standard models estimated by taking the natural logarithms of all variables are:
Model 1:
ln( �) = + ln( �) + ln � + ln � +
� � + + + ∈ � (8)
Model 2:
ln( �) = + ln( �) + ln � + � � +
ln � + + + + ∈ � (9)
Where i, j, t is the exporting country in terms of Indonesia, importing countries which have the biggest value of coffee export, and trade year.
and are the coefficients of variable and ∈ t is the error term.
� represents the export value of coffee from Indonesia to importing
16
Malaysia, Italy, Russian Federation, Belgium, Algeria, UK and Egypt) with the period of observation from 2001 to 2013.
� represents GDPs of importing countries as a proxy of importers’
absorption capacity of coffee. This variable captures the coffee demand, the purchasing power and the economy size. Those variables are introduced as a nominal value, not real terms, because both variables deflated by price indices, such as consumer price index (CPI) or GDP deflator, could be misleading and cannot capture the unobserved multilateral resistance terms (Nugroho 2014; Shepherd 2013). Data for importing country’s GDP are from the World Development Indicators (WDI) database and measured in billion US dollars.
Bilateral distance between Indonesia and importing countries, accounted for DIST, is used as a resistance variable in this model and measured in km. Bilateral distance is the geographical distance of capital cities, which is extracted from the CEPII database.
Population, denoted as POP, represents the size of country. Data for population come from WDI.
Coffee production, denoted as PROD, represents the supply side effect of coffee, which is the potential capacity for export. Statistics for coffee production stem from the Ministry of Agriculture of Republic of Indonesia.
Dummy represents the binary variable, which indicates the presence of SPS or TBT or NTMs imposed by importing countries of coffee commodity. This study estimates two models to assess the impact of NTMs on Indonesia export coffee. Model 1 uses a dummy variable for NTMs, which assumes value 1 if there is at least one NTM, either SPS or TBT, imposed by importing countries and zero otherwise. Model 2 is specified with a dummy variable for SPS or TBT, which equals 1 if importing country notifies at least one SPS or TBT on coffee and zero otherwise. This measure is derived from the WTO at the HS four-digit level (i.e., 0901). (OLS) and fixed effect (FE). As a benchmark, both models are estimated by OLS, and FE is applied for comparison. OLS provides useful estimations under restrictive assumptions in order to provide consistent, unbiased and efficient estimations. The variables for a gravity model with OLS estimation includes GDP, distance, population and coffee production without taking account of multilateral resistance. However, due to taking account of multilateral resistance in FE estimation, a country fixed-effect model controls non-time varying effects. Therefore, distance is not measured in this model. Besides this, the use of FE in a gravity model is to overcome inconsistency (Anderson and Van Wincoop 2003).
17
impact of EU’s aflatoxin standard on African food exports. In their work, EU’s
aflatoxin standard had a negative impact on African exports of cereals, dried fruits and nuts, with a 64 per cent decrease. This study was extended by Xiong & Beghin (2011), who analysed the impact of EU aflatoxin regulation on Africa’s groundnut. Their study, dealing with zero and missing values, indicated that no significant effect of SPS measure was proven in African exports. Chen, Yang and Findlay (2008) also estimated the effect of SPS and TBT barriers on China’s agricultural exports by using the gravity model. The study showedthat the impact of food safety standards was negative for China’s export of vegetables, fish and aquatic products.
Further, Disdier, Fontagné and Mimouni (2008) used a gravity model to measure the impact of SPS and TBT regulations on agricultural products. They found SPS and TBT measures affected more negatively exports from DCs to OECD countries than trade between OECD members. These measures also decreased European imports more significantly than OECD imports. Recently, Penello (2014) presented a quantitative study for the average effects of NTMs on trade imports of the agri-food sector. His findings suggested that the restrictive SPS measure could be reducing European imports significantly from LDCs, particularly for Africa, middle-income countries with lesser proportion and no significant effect on Asia.
5
RESULTS
The Incidence of NTMs on Coffee
18
Table 1 The logit model for determinants influencing the incidence of NTMs on coffee
* and ** indicate the level of significance for P < 0.1 and P < 0.05, respectively a numbers reported are odds ratio
Source: Author’s calculations.
The estimated result presented in Table 1 indicates that consumption behaviour towards the incidence of NTMs on coffee is a potential determinant for some countries to change their trade policy from the absence to the presence of NTMs on coffee. As shown in model 1, CONSUMPTION has a 10 per cent level of significance, which indicates that coffee consumption is linked to NTMs applied in some countries. The insignificant level found in other variables, such as GDP per capita, population and labour force in three consecutive models, indicate that those variables are not associated with the significance of NTMs on coffee due to the GDPCAP and LABFORCE correlated to POP. The positive sign of CONSUMPTION suggests that coffee consumption in each country has a positive influence on an increased likelihood of NTMs on coffee. It indicates that the higher consumption of coffee may encourage some countries to pay attention to food safety by applying these measures on coffee. Statistically, the incidence of NTMs on coffee are twice as likely to occur when consumption is one unit higher, which implies that people consume or drink more high-grade coffee. In this case, the USA and EU have an amount of coffee consumption per capita accounting for 4.25 and 4.86 kg/capita, respectively. If coffee consumption in the USA goes up as much as in EU, the probability of NTMs on coffee implemented in USA is 122 per cent. Indeed, the majority of global coffee demand and consumption is predominantly from developed countries, such as the USA, Japan and EU, which have imposed NTMs on coffee in their trade policy because food safety is the current issue in international trade (ICO 2014b).
19 coffee can be affected by the high export price which may be a signal of some countries in response to consumer demands for the improved coffee quality so that sanitary and technical measures are applied. In this case, Indonesia and EU have export prices accounting for 2.78 and 5.92 billion US$/million tonnes. Therefore, Indonesia has 3.5 times the probability of implementing NTMs on coffee if export prices of coffee increase as much as that in EU.
Model 3 shows the positive and significant effect of EXPPRICE and IMPPRICE variables; the five per cent level implies that export and import prices are likely to influence the incidence of NTMs on coffee. In this study, export price has the relatively same probability as import price in the incidence of NTMs on coffee. Meanwhile, the high import price might create more expensive coffee as a result of NTMs applied in coffee products. It indicates that some countries are more cautious about human health, which has implications on price. Interestingly, the significance level of consumption disappears due to the positive autocorrelation between consumption and import price.
Besides this, price terms correlated to the omitted variables influencing the presence of NTMs can cause the endogeneity problem (Baltagi 2008). In this model, the potential endogeneity between import price and NTMs can arise if NTMs can substantially change import price. However, it is believed that the possible impact on price is negligible as they probably affect quantity and origin rather than price.
The Impacts of NTMs on Indonesian Coffee Exports
The regression results of the gravity model are presented in Table 2 and analysed to measure the impacts of SPS and TBT measures on Indonesian coffee. Both models are estimated by the following two methods (i.e., OLS and FE estimation), as documented in Nugroho (2014). OLS estimation is consistent by holding restrictive assumptions, while FE estimation is used to control for non-time varying effects, such as distance and production, which are not introduced in this model (Wei, Huang & Yang 2012). FE is used to avoid inconsistency in gravity model (Anderson & Van Wincoop 2003).
20
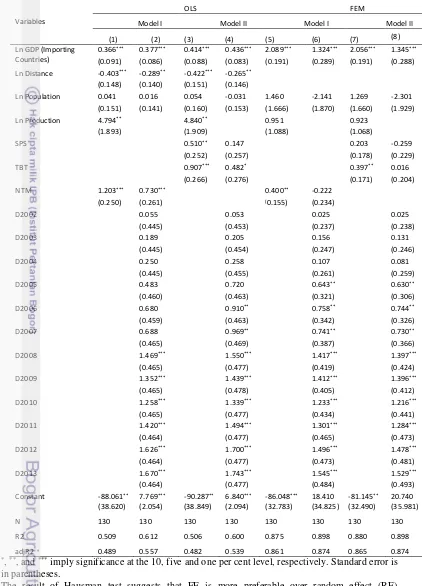
Table 2 The regression results for the impacts of NTMs on Indonesian coffee exports
*, **, and *** imply significance at the 10, five and one per cent level, respectively. Standard error is
in parentheses.
The result of Hausman test suggests that FE is more preferable over random effect (RE) estimation.
21 The regressions of all models have the varied performances in the estimated coefficient of the independent variables. By OLS and FE estimation, the estimated coefficients for GDP have robust results for the signs and the levels of statistical significance with and without dummies (the first row in Table 2). The variable of GDP for importing countries has positive signs and is statistically significant at one per cent levels for all models. This explains that the increase in economy size and purchasing power would raise coffee exports from Indonesia. This result is similar to the study conducted by Wei, Huang and Yang (2012) and de Almeida, Gomes and Monteiro (2012) who revealed that the rise in the
earnings of importing countries would increase the export of China’s tea.
Similarly, all coefficients for distance variables have the expected results. They have negative signs and are statistically significant in OLS estimation at the five per cent level of significance (columns 1 and 3, Table 2) but at the one per cent level of significance for models with time dummies (column 2 and 4). These results imply that distance seems to have a restrictive effect on coffee trade because the greater distance can cause increasing trade costs and ultimately, the lower export of coffee. The negative and significant results were also shown by de Almeida, Gomes and Monteiro (2012) who stated that the greater distance between importing and exporting countries would decrease the supply of green coffee in international market.
Unexpectedly, the population variable for all models is statistically insignificant, although with a positive sign because this variable is taken up by the GDP variable. This result suggests that population is not associated with a higher volume of Indonesian coffee exports and GDP is a better measure of market size than population as a measure of country size. Meanwhile, more populated countries as bigger markets cannot reflect the increase in demand and consumption of coffee. This result is opposite to the study of Sari (2015) which indicated that population of importing countries has a positive effect on the export of crude palm oil (CPO).
22
Under OLS and FE estimations, both models have been examined to measure the impacts of NTMs, SPS and TBT measures on coffee with and without time dummies, given the goal of study (columns 1, 3, 5 and 7). The first model uses dummy variable of NTMs to analyse the presence or absence of NTMs, either SPS or TBT measures, on coffee. When time dummies are introduced, coffee production in Indonesia is dropped off because this variable is specific-year effect and the same for all countries.
The binary variable of NTMs is positive and statistically significant under OLS and FE estimation in the absence of time dummies (columns 1 and 5). When two sets of dummies are included, while NTMs show a positive and statistically significant sign under OLS estimation (column 2), the level of significance for NTMs decreases under FE estimation. In fact, it becomes insignificant and negative with time dummies (column 6). The significant positive effect for NTMs indicates that NTMs act as a catalyst to coffee trade, which influences strongly the trade flow of coffee, and is even positively correlated to coffee trade from Indonesia. The positive effect of NTMs on coffee is even larger in terms of OLS estimation and without time dummies. Otherwise, the regression results shows that the decrease in level of significance seems to be caused by the collinearity and endogeneity as NTMs are introduced in the same year.
Similarly, the binary variables of SPS and TBT measures have positive signs and are statistically significant in OLS estimation and in the absence of time dummies (column 3). Surprisingly, when two sets of dummies were included (i.e., SPS and TBT measures and time), only TBT measure has a positive and statistically significant coefficient while SPS has not (column 4). It suggests that the significance of TBT predominantly influences the significance of NTMs. According to lemon market theory, the significance of TBT on coffee implies that TBT (i.e., labelling) has a positive effect in order to deliver the sufficient information from producers to consumers regarding the supply of high-quality coffee. In the absence of asymmetric information, both market participants have better information about the characteristics and quality of coffee so that TBT can solve information problems and increase market efficiency. In terms of its effect of trade and welfare, the significance of TBT might increase coffee trade in response to the rise in consumer demand, which is correlated to consumers’ trust in coffee quality. At the same time, consumer surplus also increases when consumer gains are greater than compliance costs. Conversely, the insignificance of SPS indicates that the implementation of SPS has not affected Indonesian coffee exports. This finding can also be found in the study of de Almeida, Gomes and Monteiro (2012), who concluded that SPS was not restrictive to green coffee trade.
23 of those measures on coffee, and consequently, those measures become insignificant.
The coefficients of time dummies present similar patterns for both estimations. Time dummies between 2006 and 2013 are statistically significant and positive for SPS and TBT measures under OLS estimation, but FE estimation is found D2005–D2013, which are statistically significant and have a positive sign. These results show that the value of time dummies is consistent because it increases for both estimations.
6
CONCLUSION AND POLICY IMPLICATIONS
Conclusion
Indonesia is one of the largest producers and exporters of coffee throughout the world. Ranking fourth in coffee demand, Indonesian coffee has been challenged by the number of SPS and TBT measures on coffee notified in the WTO. Hence, this study conducts a series of regression analyses using logit and gravity models. In these analyses, the logit model is applied to measure the incidence of NTMs on coffee in 43 coffee-consuming countries in 2012. Further, the impacts of NTMs, particularly for SPS and TBT measures, on Indonesian coffee exports are estimated using the gravity model for the 13-year period.
The first result suggests that consumption, export price and import price determine the presence of NTMs on coffee. Appearing in three different models, these factors have a positive and significant sign that seems to have a probability for coffee-consuming countries to impose the number of NTMs on coffee. As predicted by the first model, coffee consumption is likely to cause the presence of NTMs, which may direct some countries to apply those measures. In addition to consumption, the high-grade coffee is probably found in the market when the export price is significant, as shown in the second model. Since consumption disappears in the third model, the export and import price has a positive and significant sign with similar probabilities in the incidence of NTMs. However, neither GDP per capita, population nor labour force are likely to influence the likelihood of NTMs on coffee in all models.
The second result also indicates that NTMs imposed by importing countries have significantly influenced Indonesian coffee exports, so does TBT. Being a catalyst to coffee trade, NTMs have increased the trade flow of coffee from Indonesia to major importing countries. In addition, the significance of NTMs on coffee might be contributed to by TBT, which has a positive and significant sign in the estimated results. This study shows that Indonesian coffee has met the technical measures established by the importing countries. It seems that NTMs, in terms of TBT, have played an important role in avoiding asymmetric information among market participants. On the other hand, coffee exports from Indonesia are not significantly affected by SPS measures.
24
quality coffee, i.e. grade V and VI, Indonesia has specialty coffee, such as organic coffee and geographically typical coffee, which is characterised by high-quality, sustainable production, strict monitoring in processing and sorting, and has premium price (Dradjat, Agustian and Supriatna 2007). Organic-certified coffee is concerned with the concept of sustainable environment which discourages the use of chemicals. By obtaining organic or fairtrade certification, this coffee is regarded to have positive impacts on trade performance. Based on an analysis of Hakim and Septian (2011), the export of organic coffee from Aceh is predicted to rise with regard to the growth of organic coffee consumption in the world, even though there is a fluctuated trend in value.
Policy Implications
Although this study has provided a new insight on the application of SPS and TBT, which has not influenced coffee trade negatively, Indonesia as a coffee-producing country should maintain its coffee quality to a higher level and support coffee quality-improvement program (CQP) established by International Coffee Organization (ICO). Practically, the projects of CQP emphasizes the improvement in cultivation, processing, storage, transportation and marketing practices in order to support the sustainable coffee economy. The purpose of CQP is to improve the coffee quality by means of restricting coffee exports which is below a minimum accepted quality level and switching low-quality coffee for other uses. This effort is fundamental for Indonesia as a member of ICO in order to maintain coffee consumption worldwide in the longer term, addressing concerns of food safety on coffee. Nevertheless, Indonesia and other exporting countries will face great challenges if such measures are tightened based on scientific justification.
Meanwhile, the government should provide the technical assistance to coffee growers and exporters in order to generate the consistent Indonesian coffee production which complies with SPS and TBT requirements. The purpose of technical assistance program is to develop the integrated technical infrastructure, such as testing laboratory and certification bodies, and to share comprehensive information, such as the introduction of standard and quality supervision, which supports coffee growers and exporters to produce high-quality coffee in the chain of coffee trade. This program may ensure coffee products fulfilling the SPS and TBT requirements by controlling food safety management systems. In this term, Indonesia is supposed to take part actively in the technical assistance program provided by ICO because it is crucial to provide the added value of coffee products and to sustain consumer trust on Indonesian coffee.
25
REFERENCES
Akerlof, GA 1970, 'The market for "lemons": Quality uncertainty and the market mechanism', The Quarterly Journal of Economics, vol. 84, no. 3, pp. 488– 500.
Anderson, JE & Van Wincoop, E 2003, ‘Gravity with gravitas: A solution to the border puzzle’, American Economic Review, vol. 93, no. 1, pp. 170–192. Antle, JM 1999, 'Benefits and costs of food safety regulation', Food Policy, vol.
24, no. 6, pp. 605–623.
Arifin, S 1999, ‘The impact of the economic crisis on development of the estate crops’, Center for Agro-Socioeconomic Research Working Paper, no. 99.18. Bacchetta, M et al. 2012, A practical guide to trade policy analysis, World Trade
Organization.
Baltagi, B 2008, Econometric analysis of panel data, vol. 1, John Wiley & Sons, Chichester & Hoboken.
Bond, EW 1984, 'International trade with uncertain product quality', Southern Economic Journal, vol. 51, no. 1, pp. 196–207.
Cadot, O, Malouche, M & Sáez, S 2012, Streamlining non-tariff measures: A Toolkit for policy makers, World Bank Publications, Washington.
Chen, C, Yang, J & Findlay, C 2008, 'Measuring the effect of food safety
standards on China’s agricultural exports', Review of World Economics, vol. 144, no. 1, pp. 83–106.
Collett, D 1991, Modelling binary data, Chapman & Hall, London & New York. de Almeida, FM, Gomes, MFM & Monteiro, O 2012, 'Non-tariff measures in
international coffee trade', Selected Poster of the International Association of Agricultural Economists (IAAE) Triennial Conference, Foz do Iguaçu, pp. 1–
14, viewed 15 May 2015,
<http://www.researchgate.net/profile/Orlando_Da_Silva3/publication/254387
390_Non-tariff_measures_in_international_coffee_trade/links/0c96053acca1c65dd600 0000.pdf>.
Disdier, A-C, Fontagné, L & Mimouni, M 2008, 'The impact of regulations on agricultural trade: evidence from the SPS and TBT agreements', American Journal of Agricultural Economics, vol. 90, no. 2, pp. 336–350.
Disdier, A-C & van Tongeren, F 2010, 'Non-tariff measures in agri-food trade: What do the data tell us? Evidence from a cluster analysis on OECD imports', Applied Economic Perspectives and Policy, vol. 32, no. 3, pp. 436–455.
Dradjat, B, Agustian, A & Supriatna, A 2007, ‘Ekspor dan daya saing kopi biji
Indonesia di pasar internasional: implikasi strategis bagi pengembangan kopi
biji organik’, Pelita Perkebunan, vol. 23, no. 2, pp. 159-179.
Elder, SD, Zerriffi, H & Le Billon, P 2013, 'Is Fairtrade certification greening agricultural practices? An analysis of Fairtrade environmental standards in Rwanda', Journal of Rural Studies, vol. 32, pp. 264–274.
26
Goktolga, ZG, Bal, SG & Karkacier, O 2006, 'Factors affecting primary choice of consumers in food purchasing: The Turkey case', Food Control, vol. 17, no. 11, pp. 884–889.
Grebitus, C, Yue, C, Bruhn, M & Jensen, HH 2007, 'What affects consumption patterns of organic and conventional products?', Proceedings of the American Agricultural Economics Association Annual Meeting, pp. 1–33, Portland,
viewed by 15 May 2015,
<http://ageconsearch.umn.edu/bitstream/9819/1/sp07gr03.pdf>.
Hakim, L & Septian, A 2011, ‘Prospek ekspor kopi arabika organik bersertifikat di kabupaten Aceh Tengah’, Agrisep, vol. 12, no. 1, pp. 1-8.
Henson, S & Loader, R 2001, 'Barriers to agricultural exports from developing countries: The role of sanitary and phytosanitary requirements', World Development, vol. 29, no. 1, pp. 85–102.
Hosmer Jr, DW, Lemeshow, S & Sturdivant, RX 2013, Applied logistic regression 3rd edition, John Wiley & Sons, New Jersey.
ICO 2009a, 'Coffee price volatility', Document of the 103rd Session of International Coffee Council, London, pp. 1–17, viewed by 20 May 2015, <http://www.ico.org/documents/icc-103-7e-volatility.pdf>.
ICO 2009b, ICO Annual review 2007–2008, International Coffee Organization, viewed by 23 May 2015, < http://dev.ico.org/documents/annual-review-9e.pdf>.
ICO 2010a, 'Development strategy for coffee', Document of the 105th Session of International Coffee Council, pp. 1–21, viewed by 23 May 2015, <http://www.ico.org/documents/icc-105-16e-strategy.pdf>.
ICO 2010b, ICO Annual Review 2008–2009, International Coffee Organization, viewed by 23 May 2015, <http://dev.ico.org/documents/annual-review-10e.pdf>.
ICO 2011, 'The effects of tariffs on the coffee trade', Document of the 107th Session of International Coffee Council, London, pp. 1–17, viewed by 8 June 2015, <http://dev.ico.org/documents/icc-107-7e-tariffs-trade.pdf>.
ICO 2014a, 'Coffee consumption in East and Southeast Asia: 1990–2012', Document of the 112th Session of International Coffee Council, London, pp. 1–16, viewed by 24 May 2015, <http://www.ico.org/news/icc-112-4e-consumption-asia.pdf>.
ICO 2014b, 'World coffee trade (1963–2013): A review of the markets, challenges and opportunities facing the sector', Document of the 112th Session of International Coffee Council, London, pp. 1–29, viewed by 20 May 2015, <http://www.ico.org/news/icc-111-5-r1e-world-coffee-outlook.pdf>.
ICO 2015a, Historical data on global coffee trade, International Coffee
Organization, viewed 18 May 2015
<http://ico.org/new_historical.asp?section=Statistics>.
ICO 2015b, ICO Annual review 2013–2014 Strengthening the global coffee sector through international cooperation, International Coffee Organization, viewed by 23 May 2015, <http://dev.ico.org/documents/cy2014-15/annual-review-2013-14-electronic-e.pdf>.
27 Maurice, N & Davis, J 2011, 'Unravelling the underlying causes of price volatility in world coffee and cocoa commodity markets’, Munich Personal RePEc Archive Paper, No. 43813.
MoA 2015, Basis data pertanian, (agricultural database), The Ministry of Agriculture of Republic of Indonesia, viewed 20 May 2015, <http://aplikasi.pertanian.go.id/bdsp/index.asp>.
Moenius, J 2004, 'Information versus product adaptation: The role of standards in trade', Northwestern University Working Paper.
Nugroho, A 2014, 'The impact of food safety standard on Indonesia's coffee exports', Procedia Environmental Sciences, vol. 20, pp. 425–433.
Otsuki, T, Wilson, JS & Sewadeh, M 2001, 'Saving two in a billion: Quantifying the trade effect of European food safety standards on African exports', Food Policy, vol. 26, no. 5, pp. 495–514.
Panhuysen, S & Pierrot, J 2014, Coffee barometer 2014, Hivos–IUCN Nedeland– Oxfam Novib–Solidaridad–WWF, viewed by 15 May 2015, <https://hivos.org/sites/default/files/coffee_barometer_2014_report_1.pdf>. Penello, D 2014, ‘Study of average effects of non-tariff measures on trade
imports’, UNCTAD Blue Series Paper, no. 66.
Pienaar, N 2005, 'Economic applications of product quality regulation in WTO trade agreements', Doctoral thesis, Stockholm University, Stockholm.
Qie, H 2014, 'Study on food safety based on “lemons market” theory', Asian Agricultural Research, vol. 6, no. 8, pp. 80–82.
Sari, AR 2015, ‘Analisis pengaruh non-tariff measures (NTMs) terhadap ekspor
komoditi crude palm oil (CPO) Indonesia ke negara tujuan ekspor utama’,
Magister thesis, Bogor Agricultural University, Bogor.
Shepherd, B 2013, The gravity model of international trade: A user guide, United Nations publication, Bangkok.
Susila, W 2005, Targeted study of the Arabica coffee production chain in North Sumatra (the mandhaling coffee), The Socio Economic Report, Food and Agriculture Organization.
Swann, GP 2010, 'International standards and trade: A review of the empirical literature', OECD Trade Policy Papers, no. 97.
Tinbergen, J 1963, 'Shaping the world economy', The International Executive, vol. 5, no. 1, pp. 27–30.
UNCOMTRADE 2015, International trade statistics database, UNCOMTRADE, viewed 30 March 2015, <http://comtrade.un.org/>.
UNCTAD 2005, 'Methodologies, classifications, quantification and development impacts of non-tariff barriers', Paper of Expert Meeting: Methodologies, classifications, quantification and development impacts of non-tariff barriers,
Geneva, pp. 1–22, viewed by 15 May 2015,