APPLICATION OF ALOE VERA EDIBLE COATING AND
STORAGE TEMPERATURE TO MAINTAIN MINIMALLY
PROCESSED SALAK PONDOH (Salacca edulis Reinw.)
NUR KHOLIQ
DEPARTMENT OF AGROINDUSTRIAL TECHNOLOGY FACULTY OF AGRICULTURAL TECHNOLOGY
BOGOR AGRICULTURAL UNIVERSITY BOGOR
STATEMENT ON THESIS AND SOURCE OF INFORMATION*
Herewith, I declare that this thesis entitled Application of Aloe Vera Edible Coating and Storage Temperature to Maintain Minimally Processed Salak Pondoh (Salacca edulis Reinw.) is my own work with the guidance from advisor and has not been published in any form and for another degree. Source of information which is collected or cited from published or unpublished works has acknowledged in this text and put it in the list of references at the end of thesis.I hereby assign copyright of my paper to Bogor Agricultural University (IPB). Bogor, August 2015
Nur Kholiq
ABSTRACT
NUR KHOLIQ. Application of Aloe Vera Edible Coating and Storage Temperature to Maintain Minimally Processed Salak Pondoh (Salacca edulis Reinw.). Supervised by SUGIARTO.
Application of edible coating and storage temperature are common to maintain fruit’s quality. A source that can be used as edible coating is aloe vera which contains antimicrobial substance.Unfortunately extra effort is needed to prepare aloe vera to be edible coating (peeling, crushing, and filtering) that causes difficulties in application. Formulation of aloe vera edible coating in powder form could ease the application. This research aimed to know the effect of spray drying process on aloe vera edible coating characteristics and its effectiveness to maintain minimally processed salak pondoh. Furtheremore, this research aimed to get information about the effect of aloe vera edible coating and storage temperature on minimally processed salak pondoh (Salacca edulis Reinw.). Fruits quality parameters in this research were firmness, weight loss, percentage of damage, and visual changes. Statistical analysis used was Completely Randomized Design with twice replications. The result showed that spray drying process decreased aloe vera edible coating viscosity, total soluble solid (TSS), and titratable acidity, while its pH value increased. Aloe vera edible coating color changed to be yellowish from smooth green. Furtheremore storage temperature gave significant (α=0.01) effect on all parameters, while aloe vera edible coating did not give significant effect on all parameters analyzed, but uncoated fruits were contaminated by molds sooner than coated ones.
Keywords: Edible coating, aloe vera, polysaccharides, minimally processed fruit, spray dry.
ABSTRAK
NUR KHOLIQ. Aplikasi Edible Coating Lidah Buaya dan Suhu Penyimpanan untuk Menjaga Mutu Salak Pondoh (Salacca edulis Reinw.) Terolah Minimal. Dibimbing oleh SUGIARTO.
Cara yang biasa dilakukan untuk menjaga mutu buah adalah perlakuan edible
coating dan suhu penyimpanan. Lidah buaya yang mengandung bahan antimikroba
dapat digunakan sebagai edible coating. Namun dibutuhkan usaha yang cukup rumit dalam menyiapkan lidah buaya menjadi edible coating (pengupasan, penghancuran, dan penyaringan) yang menyebabkan kerumitan dalam aplikasi. Pembuatan edible
coating lidah buaya menjadi bentuk serbuk dapat dijadikan alternatif untuk
kerusakan buah, dan perubahan visual. Analisis statistik yang digunakan adalah Rancangan Acak Lengkap Faktorial (RALF) dengan dua kali ulangan. Hasil menunjukkan spray drying menurunkan viskositas, total soluble solid (TSS), dan total asam, sedangkan pH naik. Warna larutan edible coating aloe vera berubah menjadi kekuningan. Selanjutnya suhu penyimpanan berpengaruh secara signifikan (α=0.01) pada parameter buah yang diuji, sedangkan perlakuan edible coating lidah buaya tidak memberikan pengaruh yang signifikan pada kualitas buah, tapi buah tanpa perlakuan
coating terkontaminasi kapang lebih cepat daripada buah dengan coating.
Thesis
as a partial fulfillment for Bachelor of Agricultural Technology in Department of Agroindustrial Technology
NUR KHOLIQ
APPLICATION OF ALOE VERA EDIBLE COATING AND
STORAGE TEMPERATURE TO MAINTAIN MINIMALLY
PROCESSED SALAK PONDOH (Salacca edulis Reinw.)
DEPARTMENT OF AGROINDUSTRIAL TECHNOLOGY FACULTY OF AGRICULTURAL TECHNOLOGY
BOGOR AGRICULTURAL UNIVERSITY BOGOR
Thesis Title : Application of Aloe Vera Edible Coating and Storage Temperature to Maintain Minimally Processed Salak Pondoh (Salacca edulis Reinw.) Name : Nur Kholiq
NIM : F34110105
Approved by
Dr Ir Sugiarto MSi Advisor
Acknowledge by
Prof Dr Ir Nastiti Siswi Indrasti Head of Department
PREFACE
Hereby I would like to give my thankfulness to God Almighty, Allah subhanahu
wa ta’ala, who has given me much blessing so I could finish this thesis. The title of
this research is Application of Aloe Vera Edible Coating and Storage Temperature to
Maintain Minimally Processed Salak Pondoh (Salacca edulis Reinw.). This research
was conducted from February to May 2015.
In this moment, I am going to express my thanks and sincere my appreciation to Dr Ir Sugiarto MSi as my advisor, Dr Ir Muslich, MSi and Dr Farah Fatma, STP, MT for the guidance to finish this research. Secondly I am very grateful to laboratory assistants (Bu Ega, Bu Rini, Bu Sri, Pak Nurwanto, Bu Dyah, and Pak Gunawan) who have given me services and suggestions during this research. Furthermore I said my thanks to all friends who have helped me to conduct this thesis. Last but not the least, I said thank you so much to my family for their support and wishes.
I wish this thesis will be useful for any interest.
Bogor, August 2015
CONTENTS
LIST OF TABLES ix
LIST OF FIGURES x
LIST OF APPENDIXES x
INTRODUCTION 1
Background 1
Objective 1
METHODS 2
Materials 2
Edible Coating Preparation 2
Edible Coating Characterization 2
Edible Coating Application 3
Fruit Quality Parameters 4
Statistical Analysis 6
RESULT AND DISCUSSION 6
Preliminary Research 6
Aloe Vera Edible Coating Character 7
Aloe Vera Edible Coating and Storage Temperature Effects on Salak Quality 8
CONCLUSION AND SUGGESTION 14
Conclusion 14
Suggestion 14
REFERENCES 14
APPENDIXES 18
BIOGRAPHY OF AUTHOR 25
LIST OF TABLES
Maltodextrin formulation 6
Edible coating characteristics 8
The effect of edible coating on change rate of salak parameters in different storage
temperature 9
Physical change and damage rate 13
LIST OF FIGURES
Aloe vera solution preparations 3
Edible coating preparations 4
Edible coating applications 5
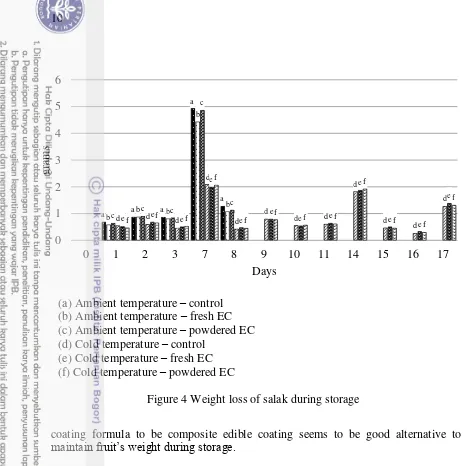
Weight loss of salak during storage 10
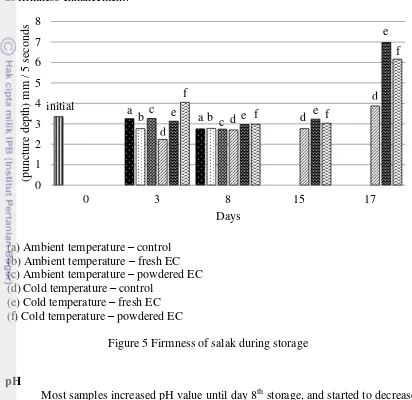
Firmness of salak during storage 11
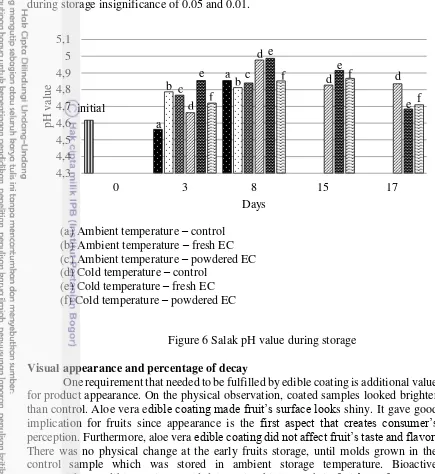
Salak pH value during storage 12
LIST OF APPENDIXES
Time series sample documentation 18
Analysis methods 19
Analysis of salak’s pH during storage 20
Analysis of salak’s firmness during storage 21
Analysis of percentage of decay 22
INTRODUCTION
Background
Perishable is the major charracteristic that followed fruits and vegetable (Ščetar et al. 2010), including minimally processed salak pondoh (Salacca edulis
Reinw.). Thus people are pursuing alternatives to extend the shelf life with high quality. A very common alternative that is used by most people is storage temperature manipulation. Storage temperature is well known to maintain fruit’s quality since temperature affects respiration of fruits during storage (Mahajan et al. 2008). It is believed that the decreasing of temperature decreases respiration rate, transpiration rate, and chemical reaction on fruit. In contrary, different fruits have different response to temperature.
Application of edible coating is also believed to have good impact on fruit shelf life as it has been being developed in some studies (Dobrucka and Cierpiszewski 2014). Furthermore, Ščetar et al. (2010) said that the development of edible coating aligns with environmental issues because of high number of conventional plastics contamination. Briefly, edible coating is a material that can form thin layer of barrier on food product surface, such as fruits and vegetables (Ciolacu et al. 2014; Winarti et al. 2012; Krochta and Mulder-Johnson 1997) and meat (Cagri et al. 2004; Krochta and Mulder-Johnson 1997). Edible coating protects fruits from oxygen and water vapor (Debeaufort and Voilley 1997), microorganisms (Brody et al. 2002), and mechanical scratch so fruits perform longer shelf life.
Edible coating application has taken public interest along with the awareness on food safety. A major requirement that needs to be fulfilled as edible coating are good barrier to damage factors, does not affect products flavor, has a good mechanical strength, good biochemical and physicochemical stability, safe, cheap, and applicable (Diab et al. 2001). Three main sources of edible coating are polysaccharides (starch, pectin, cellulose, alginate, and carrageenan), proteins (gelatin, casein, gluten, and zein), and lipids (stearic acid, wax, fatty acid esters) (Sothornvit and Krochta 2001; Vargas
et al. 2008).
Application of aloe vera as edible coating has been studied on grape (Castillo
et al. 2010), minimally processed apple slice (Chauhan et al. 2011), salak (Rahmawati
2012), peach and plum (Guillén et al. 2013), kiwi (Benitez et al. 2013), pomegranate arils (Martínez-Romero et al. 2013), and raspberry (Hassanpour 2015). Aloe vera is a polysaccharide source that can form film. Aloe vera does not change fruit’s color since its film is transparent. It does not change flavor and users-environmentally friendly (Reynold and Dweck 1999). Furthermore, aloe vera contains bioactive compounds that give good implication on fruit preservations. Those compounds are acemannan, glucomannan, pectin, and Aloeride (Ahlawat and Khatkar 2011; Ramachandra and Rao 2008).
Objective
2
Reinw.). Furtheremore, this research aimed to know the effect of spray drying process on Aloe vera edible coating characteristics and its effectiveness to maintain minimally processed salak pondoh.
METHODS
Materials
Salak pondoh (Salacca edulis Reinw.) fruit was harvested from farm in Parung, Bogor, while aloe vera (Aloe veraL.) was harvested from IPB’s farm, Bogor.
Sodium hypochlorite 200 ppm was used to sanitize salak fruit before it was coated. The edible coating was made from polysaccharide, such as aloe vera, Carboxy Methyl Cellulose (CMC) and maltodextrin, and glycerol as plasticizer.
The analysis materials were iodine solution, starch indicator, NaOH solution 0.1 N, and phenolphthalein (PP) indicator.
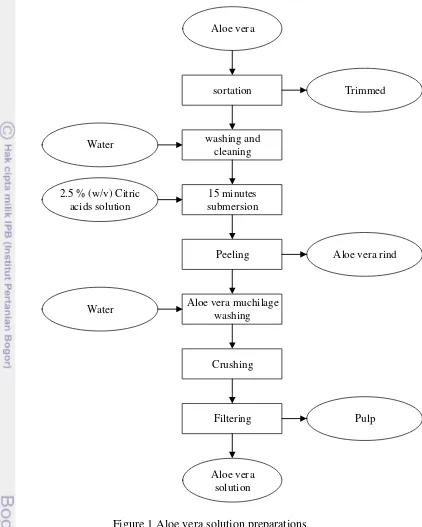
Edible Coating Preparation
The aloe vera solution was extracted by peeling and trimming, crushing, and filtering the aloe vera (Figure 1). Preliminary research was conducted to get percentage of CMC and maltodextrin on edible coating formula that could be dried by using spray dryer. The initial percentage of CMC (m/v) were 0.1%, 0.2%, 0.3%, 0.4%, 0.5%, while maltodextrin (m/v) were 5%, 10%, and 15%. The most suitable percentage of CMC and maltodextrin that were obtained on the preliminary research was then used in the main research.
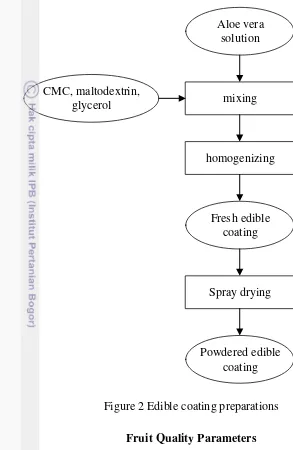
Aloe vera solution, CMC, maltodextrin, and glycerol then homogenized to get the best substances distribution. Powdered aloe vera based edible coating was obtained by spray drying method using spray dryer BUCHI 190 in pilot plant laboratory SEAFAST. Spray drying method is chosen in the drying process since it is the common method to dehydrate aloe vera solution for cosmetic need. Spray drying is also common method to make food in powder form. The flow process chart of edible coating preparation is shown at Figure 2.
Edible Coating Characterization
3
Aloe vera
sortation
washing and cleaning
15 minutes submersion
Peeling
Aloe vera muchilage washing
Crushing
Filtering
Aloe vera solution
Trimmed
Water
2.5 % (w/v) Citric acids solution
Aloe vera rind
Water
Pulp
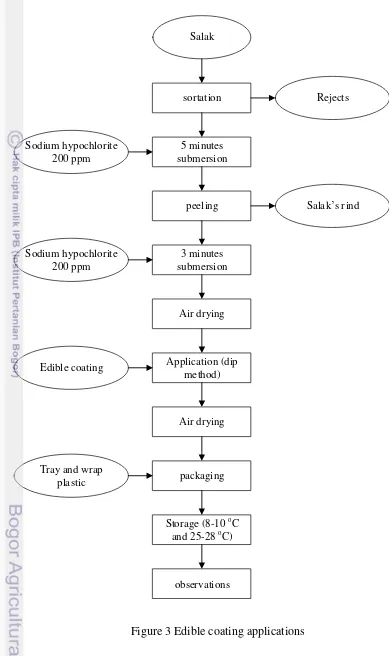
Figure 1 Aloe vera solution preparations Edible Coating Application
4
Samples were stored at different temperature to know the effect of temperature in maintaining the sample and effectiveness of edible coating.
Aloe vera solution
mixing
homogenizing
Spray drying
Powdered edible coating CMC, maltodextrin,
glycerol
Fresh edible coating
Figure 2 Edible coating preparations Fruit Quality Parameters
Fruits parameter that was observed in this research were weight loss, firmness, pH, visual appearance, and percentage of decay. Weight loss of fruit was observed everyday using gravimetric method (AOAC 2005). Salak solution was tested pH value using pH meter at 22-23 oC (AOAC 2005).
5
Salak
sortation
5 minutes submersion
peeling
3 minutes submersion
Air drying
Application (dip method)
Rejects
Salak’s rind Sodium hypochlorite
200 ppm
Sodium hypochlorite 200 ppm
Edible coating
Air drying
packaging Tray and wrap
plastic
Storage (8-10 oC and 25-28 oC)
observations
6
Statistical Analysis
This research used Completely Randomized Design as statistical analysis. Factor for this research was edible coating treatment and storage temperature. There were 3 degrees of edible coating; these are control, fresh edible coating, and powdered edible coating, while storage temperature has two degrees; these are cold and ambient temperatureEach treatment was conducted in two replications. Mathematical model on the statistical analysis used was:
Yij = + Ai +Bj + ABij + εij,
Yij was response for each parameter, was average value, Ai was effect of storage temperature degree-i (i = 1, 2), Bj was effect of edible coating treatment degree-j (j = 1, 2, 3), Abij was the interaction between edible coating and storage temperature, and εij was error.
The data for statistical analysis was the change rate of response variable. The change rate of the response variable was obtained by slope of time series response value. The response variables that were statistically analyzed on this research were firmness, pH, weight loss, and percent of decay.
RESULT AND DISCUSSION
Preliminary Research
This research tried to make aloe vera edible coating’s formula that was adopted from Rahmawati (2012), which contains Aloe vera solution, CMC 0.5% (m/v), and glycerol 1% (v/v). Unfortunately, spray drying of this edible coating resulted few yields that was less than 2 grams from 300 ml solution of edible coating. There might be two main reasons that affected this low yield, it were low soluble solids content and high viscosity.
Table 1 Maltodextrin formulation
Maltodextrin (%) CMC (%) TSS (oBrix) Film characteristic
0 0.5 2 Flexible and not hard
5 0.5 7 Flexible and not hard
10 0.5 13 Crackly and hard
15 0.5 19 Crackly and hard
This formula has low content of soluble solids since 98% of aloe vera is water (Nindo et al. 2010; Rahmawati 2012; Hendrawati 2015) and little percentage of CMC on the edible coating formula. Filler that is commonly used to increase content of soluble solids on food product is maltodextrin. Furthermore, maltodextrin has been being used as additional material on aloe vera solution before it is dried (Nindo et al.
7
maltodextrin formed crackly film, while 5% formed better film that did not too hard and more flexible. So in this step, addition of 5% maltodextrin was determined to be used in main research.
This edible coating was polysaccharide based, so the high viscosity was affected by hydrocolloids characteristic of polysaccharide that was used (Skurtys et al.
2010), especially CMC content. High edible coating viscosity caused the difficulties on spray drying process. Based on spray drying trials, basically all solution 0.1-0.4% CMC (m/v) and maltodextrin 5% (m/v) could be sprayed. Brown crust was formed on the drying chamber and some solution piled up in the bottom of drying chamber. Nozzle on spray dryer tends to spray bigger droplets for more viscous solution (BETE 2005). Water content was also trapped stronger on the droplets so not all droplets were evaporated. This condition is the reason why some solution was not dried properly on the spray drying process. So in this step, addition of 0.4% CMC was determined to be used in main research.
Besides spray drying, there are two drying processes to produce powdered edible coating. Those methods are dry mixing process and foam-mat drying. Dry mixing means mix all formulation in dry or powder form. So in dry mixing method, solution of aloe vera, maltodextrin, and glycerol is sample to be spray dried. Powdered aloe vera and CMC are mixed to be powdered aloe vera edible coating. While foam-mat drying does not use spray drying but oven. In this method, tween is added to aloe vera edible coating solution then is dried by using oven. Those drying method might be perform better drying process than that was implemented in this research as those do not have viscosity problem in drying process.
Aloe Vera Edible Coating Character
In general, there was much change from fresh edible coating to powdered edible coating. Water content of fresh aloe vera edible coating was 93.99%, while powdered aloe vera edible coating was 4.27%. Little water content on powdered edible coating surely will delay microbial growth on the powder that is the major factor of aloe vera edible coating decay. The water content of powdered aloe vera edible coating is equal to 0.2-0.3 of water activity (aw). This aw could delay edible coating decay that was caused by microbial activities. At least 0.6 of aw (water content 15-20%) is required by microbes to grow on food products (Dilbaghi and Sharma 2007).
Based on aloe vera edible coating characterization (Table 2), there was dramatically change on the powdered aloe vera edible coating that has been diluted on distilled water. This change was because of shear and high temperature during spray drying process. Aligned with Nindo et al. (2010) who said that solution viscosity and bioactive compounds on aloe vera was decreasing because shear force during spraying on nozzle and high temperature. Those condition breakdown polysaccharide chain on solution.
8
while Aloenin (B) dan Aloenoside A dan B remained in a very small amount. The rest remained bioactive compound on the powdered aloe vera was Aloesin. The pH value (Table 2) of both edible coating also clarified the bioactive compounds loss. Bioactive compound loss affected the decrease of titratable acidity, and then pH value increased. Table 2 Edible coating characteristics
Characters Fresh edible
Color smooth green yellowish
Aloe vera edible coating solution changed to be yellow from fresh smooth green. This condition indicated that there was browning reaction on the aloe vera edible coating solution. Browning reaction can be affected by enzymatic and non-enzymatic reaction. Enzymatic browning mostly happens in agricultural produce, i.e. fruits and vegetables. Enzyme polyphenol oxidase catalyzes polyphenol compound on fruits and vegetables to quinones, which then polymerize to dark melanin pigments (Friedman 1996). Non-enzymatic browning reactions on food product are maillard reaction and charamelization. Maillard reaction happens when there is a chemical reaction between amino acids and reducing sugars. Charamelization happens during the heating of sugars (Latifah and Apriliawan 2009). Remembering the spray drying condition and protein content on aloe vera solution, charamelization is the browning factor which likely happened on the powdered aloe vera edible coating.
In the application, both aloe vera edible coating’s difference did not affect salak’s visual appearance and flavor. The aloe vera edible coating solution formed transparent and thin layer on the product surface so both edible coating difference did not give any implication on sample’s appearance and flavor.
Aloe Vera Edible Coating and Storage Temperature Effects on Salak Quality
9
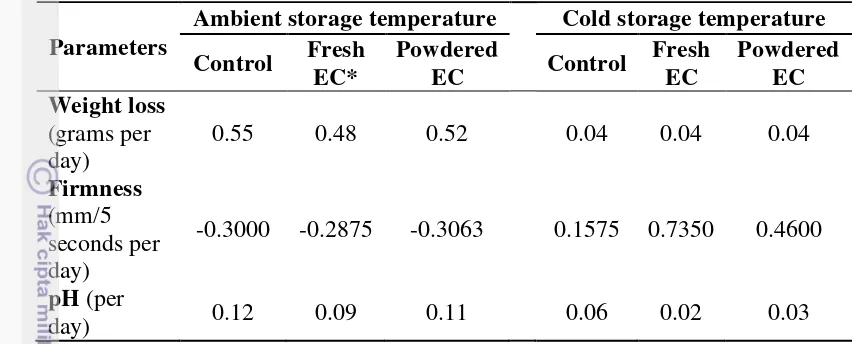
Table 3 The effect of edible coating on change rate of salak parameters in different storage temperature
Parameters
Ambient storage temperature Cold storage temperature
Control Fresh
*EC referred to Edible coating
Weight loss
Weight loss of fruits was the result of transpiration (Rahman 2007; Valero and Serrano 2010; Robertson 2012), since transpiration still happens on fruits besides respiration. Rahman (2007) said that transpiration is a process of mass transfer in which the water vapors from the surface of the produce to the surrounding atmosphere. This water loss makes fruits wilt and decrease its weight.
Figure 4 shows that samples which were stored in ambient temperature had higher weight loss than cold storage did. The rate of weight loss (Table 3) supported that temperature storage affected fruit weight loss. Statistical analysis also showed that storage temperature significantly affected fruit weight loss and both temperatures significantly different (p<0.01). This might be affected by different transpiration and respiration rate on both samples. Transpiration rate of fruits is affected by temperature, humidity, and air flow on the atmosphere (Mahajan et al. 2008), and the ratio of surface area and volume (Robertson 2012). Higher temperature let higher transpiration rate, so more water on ambient temperature samples evaporated.
The effect of aloe vera edible coating in preventing weight loss was higher in ambient temperature than in cold storage. Samples that were coated by aloe vera edible coating showed less weight loss in ambient temperature storage, while samples in cold storage temperature did not show less weight loss. This might be due to low temperature of cold storage gave more effect than aloe vera edible coating treatment did. Based on statistical analysis, aloe vera edible coating treatment did not significantly affect weight loss rate.
10
coating formula to be composite edible coating seems to be good alternative to maintain fruit’s weight during storage.
Firmness of Salak
Based on samples measurement (Figure 5), firmness of salak was not change dramatically along the storage period, and then it decreased at the end of storage time (days 17 after storage). This condition showed that salak ripened slowly after it had harvested. Fruits soften during ripening. This softening could arise due to turgor loss, starch degradation, and cell wall breakdown (Tucker 1993). In most fruits, Tucker (1993) continued, cell wall degradation during ripening is the main factor of fruit’s texture change. Carbohydrate polymers were the most constituent (about 90-95%) of fruit’s cell wall, which are cellulose, hemicellulose, and pectin, and the rest are hydroxyproline-rich glycoprotein. Those constituents are held together by a variety of covalent and non-covalent bonds (Fry 1986) and during ripening the bonds are hydrolyzed to be more simple sugars (DellaPenna et al. 1989) by enzymes activity, such as pectinesterase, polygalacturonase, cellulase or β-(1-4) glucanase, and β -galactosidase (Tucker 1993).
During storage, samples in ambient temperature showed firmness enhancement. It was expected as the result of transpiration that leaded to water content loss. Referred to weight loss of sample (Figure 4) which were samples in ambient temperature met more weight loss than cold storage did. The statistical analysis from data (Table 3) resulted aloe vera edible coating treatment did not affect the rate of fruit firmness (a) Ambient temperature – control
(b) Ambient temperature – fresh EC (c) Ambient temperature – powdered EC (d) Cold temperature – control
(e) Cold temperature – fresh EC (f) Cold temperature – powdered EC
11
change with F value was 1.63 and P value was 5.14 (α=0.05), while storage temperature affected the rate of fruit firmness change with F value was 31.58 at α 0.01. Higher storage temperature accelerate transpiration rate than lower does (Mahajan et al. 2008). It seemed that transpiration rate in ambient temperature is faster than cell wall degradation during ripening. This condition caused fruit withering and expressed as firmness enhancement.
pH
Most samples increased pH value until day 8th storage, and started to decrease at day 15th. Sample on cold storage with powdered aloe vera edible coating treatment was the only one which increased pH value until day 15th (Figure 6). During ripening, pH value of fruit is increasing. The increasing of pH value is because of the increasing of sugar content.
In the statistical analysis, F value of aloe vera edible coating was 1.54 with P value 5.14 (α=0.05) which meant aloe vera edible coating did not affect the rate of pH value change in significance of 0.05. Both storage temperature affected rate of pH value change. This research resulted that rate of pH value change in cold storage temperature was slower than sample in ambient storage temperature did. It verified that temperature delays respiration rate of fruit during storage. In the statistical analysis, F value of temperature was 24.83 and P value was 5.99 (α=0.05) and 13.75 (α=0.01).
0
(a) Ambient temperature – control (b) Ambient temperature – fresh EC (c) Ambient temperature – powdered EC (d) Cold temperature – control
(e) Cold temperature – fresh EC (f) Cold temperature – powdered EC
12
This could be conclude that storage temperature affected the rate of pH value change during storage insignificance of 0.05 and 0.01.
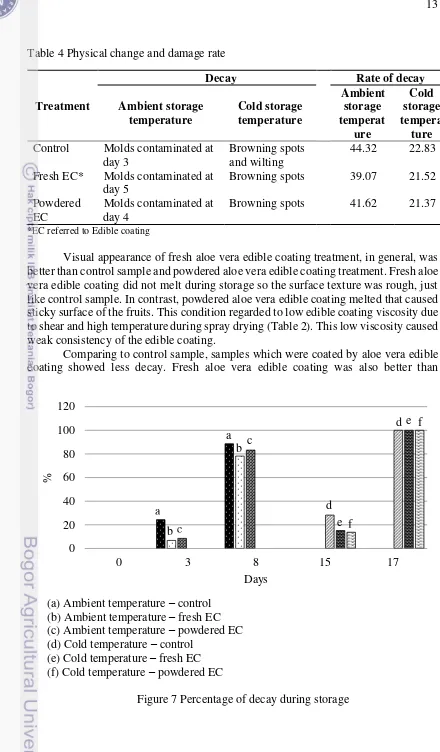
Visual appearance and percentage of decay
One requirement that needed to be fulfilled by edible coating is additional value for product appearance. On the physical observation, coated samples looked brighter than control. Aloe vera edible coating made fruit’s surface looks shiny. It gave good implication for fruits since appearance is the first aspect that creates consumer’s perception. Furthermore, aloe vera edible coating did not affect fruit’s taste and flavor. There was no physical change at the early fruits storage, until molds grown in the control sample which was stored in ambient storage temperature. Bioactive compounds on edible coating could delay microbial growth in fruit’s surface (Putra 2011).
Samples that stored for longer duration shown more decay resulted by molds for samples in ambient temperature storage. Molds contamination continued and decay most samples in ambient temperature until storage day 8. This condition was the reason why collected data for samples in ambient temperature storage stopped at day 8.
As it is shown in Figure 7, fruits in ambient temperature storage started to decay at day 3rd and most samples decayed at day 8th (because of molds), while samples in cold storage started to decay at day 15th and 17th. Different from samples in ambient storage temperature, decay that happened in samples which were store in cold storage temperature was browning. All samples in cold storage temperature started to browning reaction at day 15th, and control sample were the most. In addition, control sample was also wilting.
(a) Ambient temperature – control (b) Ambient temperature – fresh EC (c) Ambient temperature – powdered EC (d) Cold temperature – control
(e) Cold temperature – fresh EC (f) Cold temperature – powdered EC
13
Table 4 Physical change and damage rate
Treatment Control Molds contaminated at
day 3
Browning spots and wilting
44.32 22.83 Fresh EC* Molds contaminated at
day 5
Browning spots 39.07 21.52 Powdered
EC
Molds contaminated at day 4
Browning spots 41.62 21.37
*EC referred to Edible coating
Visual appearance of fresh aloe vera edible coating treatment, in general, was better than control sample and powdered aloe vera edible coating treatment. Fresh aloe vera edible coating did not melt during storage so the surface texture was rough, just like control sample. In contrast, powdered aloe vera edible coating melted that caused sticky surface of the fruits. This condition regarded to low edible coating viscosity due to shear and high temperature during spray drying (Table 2). This low viscosity caused weak consistency of the edible coating.
Comparing to control sample, samples which were coated by aloe vera edible coating showed less decay. Fresh aloe vera edible coating was also better than
(a) Ambient temperature – control (b) Ambient temperature – fresh EC (c) Ambient temperature – powdered EC (d) Cold temperature – control
(e) Cold temperature – fresh EC (f) Cold temperature – powdered EC
14
powdered aloe vera edible coating in delaying fruits decay. This might be result of bioactive compounds loss on edible coating solution during spray dryer (Table 2).
The statistical analysis for percentage of decay (Table 4) showed that F value of temperature was 91.93 and P value was 5.99 (α=0.05) and 13.75 (α=0.01). The P value was lower than F value so it was significantly affected the percentage of decay in 0.01. Statistical analysis on edible coating treatment showed the opposite respond as storage temperature. The F value of edible coating treatment was 0.86 and P value was 5.14 (α=0.05) which meant not significantly affected percentage of decay.
CONCLUSION AND SUGGESTION
Conclusion
Spray drying produced aloe vera edible coating powder form with water content 4.27% from 93.99%. Shear and high air temperature during spray drying affected aloe vera edible coating characteristics, which were titratable acidity, viscosity, TSS, and pH. Titratable acidity of Fresh edible coating decreased from 129.45 ml NaOH 0.1N/100 grams sample to 39.74 ml NaOH 0.1N/100 grams sample. Its viscosity also decreased from 77.92 cP to 20.03 cP. Aloe vera edible coating showed total soluble solid decrease, from 6.30 oBrix to 4.40 oBrix, as the result of the decreasing of titratable acidity and bioactive compounds. Edible coating seemed to have browning reaction that caused color change to yellow from smooth green.
Storage temperature affected the rate of weight loss, firmness change, pH change, and percentage of decay in significantly 0.01. In contrast, aloe vera edible coating treatment did not affect those parameters.
Suggestion
Application of composite edible coating (add lipids and or proteins) in the edible coating formulation might improve the effectiveness to maintain salak pondoh. In addition, there are two alternatives to make edible coating aloe vera powder, these are dry mixing method and foam-mat drying method. In dry mixing method, aloe vera solution and maltodextrin is spray dried then the powder will be mixed with CMC. So there will be no problem in spray drying due to solution viscosity.
REFERENCES
Ahlawat KS, Khatkar BS. 2011. Processing, food applications and safety of Aloe vera
products: a review. J Food Sci Technol. 48(5):525–533.doi: 10.1007/s13197-011-0229-z.
[AOAC] Association of Official Analytical Chemists. 2005. Official Method of
Analysis. Washington DC (US): Association of Official Analytical Chemists Inc.
Baldwin EA, Hagenmaier R, Bai J. 2012. Edible Coatings and Films to Improve Food
Quality 2nd edition. Boca Raton: CRC Press.
15
Benitez S, Achaerandio I, Sepulcre F, Pujola M. 2013. Aloe vera based edible coatings improve the quality of minimally processed ‘Hayward’ kiwifruit. Postharvest Biol
Technol. 81:29-36.doi: 10.1016/j.postharvbio.2013.02.009.
Brody AL, Strupinsky ER, Kline LR. 2002. Active Packaging for Food Applications. Boca Raton: CRC Press.
Cagri A, Ustunol Z, Ryser ET. 2004. Antimicrobial edible films and coatings. J Food Prot. 67(4):833–848.
Castillo S, Navarro D, Zapata PJ, Guillén F, Valero D, Serrano M, Martínez-Romero D. 2010. Antifungal efficacy of Aloe vera in vitro and its use as a preharvest treatment to maintain postharvest table grape quality. Postharvest Biol Technol.
57:183-188.doi: 10.1016/j.postharvbio.2010.04.006.
Cervantes-Martínez CV, Medina-Torres L, González-Laredo RF, Calderas F, Sánchez-Olivares G, Herrera-Valencia EE, Infante JAG, Rocha-Guzman JE, Rodríguez-Ramírez J. 2014. Study of spray drying of the Aloe vera mucilage (Aloe
verabarbadensis Miller) as a function of its rheological properties. Food Technol.
55(2014):426-435.doi: 10.1016_j.lwt.2013.09.026.
Chauhan OP, Raju PS, Singh A, Bawa AS. 2011. Shellac and aloe-gel-based surface coatings for maintaining keeping quality of apple slices. Food Chemist. 126:961-966.doi: 10.1016/j.foodchem.2010.11.095.
Ciolacu L, Nicolau AI, Hoorfar J. 2014. Edible coatings for fresh and minimally processed fruits and vegetables. Woodhead Publishing Limited.doi: 10.1533/9781782420279.3.233.
Debeaufort F, Voilley A. 1997. Methylcellulose-based edible films and coatings: 2. Mechanical and thermal properties as a function of plasticizer content. J Agric Food
Chemist. 45:685-689 (in) Fakhoury FM, Martelli SM, Bertan LC, Yamashita F, Mei
LHI, Queiroz FPC. 2014. Edible films made from blends of manioc starch and gelatin – Influence of different types of plasticizer and different levels of macromolecules on their properties. Food Sci Technol. 49(1):149-154.doi: 10.1016%2Fj.lwt.2012.04.017.
DellaPenna D, Lincoln JE, Fischer RL, Bennett AB. 1989. Transcriptional analysis of polygalacturonase and other ripening associated genes in Rutgers, rin, nor, and Nr tomato fruit. Plant Physiol. 90: 1372–1377.
Diab T, Biliaderis C, Gerasopoulos D, Sfakiotakis E. 2001. Physicochemical properties and application of pullulan edible films and coatings in fruit preservation.
J Sci Food Agric. 81:988–1000.doi: 10.1002/jsfa.883.
Dilbaghi N, Sharma S. 2007. Food spoilage, food infections and intoxications caused by microorganisms and methods for their detection. Food and Industrial Microbiology.
Dobrucka R, Cierpiszewski R. 2014. Active and intelligent packaging food – research and development–a review. Pol J Food Nutr Sci. 64(1):7-15.doi: 10.2478/v10222– 012–0091–3.
Friedman M. 1996. Food browning and food preservation: a review. J Agri Food Chem. 44(3): 631-653.
Fry SC. 1986. Cross-linking of matrix polymers in the growing cell walls of angiosperms. Annual Review of Plant Physiology. 37:165-186.
16
Hassanpour H. 2015. Effect of Aloe vera gel coating on antioxidant capacity, antioxidant enzyme activities and decay in raspberry fruit. Food Sci Technol. 60:495-501.doi: 10.1016/j.lwt.2014.07.049.
Hendrawati TY. 2015. Aloe vera powder properties produced from aloe chinensis baker, pontianak, indonesia. J Eng Sci Technol. Special Issue on SOMCHE 2014 Conference: 47-59.
Krochta JM, Mulder-Johnson C. 1997. Edible and biodegradable polymer films: challenges and opportunities. Food Technol. 52:61-74. (in) Kokoszka S, Lenart A. 2007. Edible coatings – formation, characteristics and use – a review. Pol J Food
Nutr. Sci. 57(4):399-404.
Latifah, Apriliawan A. 2009. Pembuatan tepung lidah buaya dengan berbagai macam metoda pengeringan. J Teknol Pangan: 70-80.
Mahajan PV, Oliveira FAR, Macedo I. 2008. Effect of temperature and humidity on the transpiration rate of the whole mushambients. J Food Eng. 84(2008):281– 288.doi: 10.1016/j.jfoodeng.2007.05.021.
Martínez-Romero D, Castillo S, Guillén F, Díaz-Mula HM, Zapata PJ, Valero D, Serrano M. 2013. Aloe vera gel coating maintains quality and safety of ready-to-eat pomegranate. Postharvest Biol Technol. 86: 107-112. doi: 10.1016/j.postharvbio.2013.06.022.
Nindo CI, Powers JR, Tang J. 2010. Thermal Properties of aloe vera powder and rheology of reconstituted gels. American Society of Agricultural and Biological Engineers ISSN 2151-0032. 53(4):1193-1200.
Pavlath AE, Orts W. 2009. Edible films and coatings: why, what, and how?. Springer Science+Business Media. Doi: 10.1007/978-0-387-92824-1.
Putra BS. 2011. Kajian Pelapisan dan Suhu Penyimpanan untuk Mencegah Busuk Buah pada Salak Pondoh (Salacca edulis Reinw.). [thesis]. Bogor (ID): Institut Pertanian Bogor.
Rahman MS. 2007. Handbook of Food Preservation, Second Edition. CRC Press: Boca raton.
Rahmawati N. 2012. Formulasi dan aplikasi pelapis gel lidah buaya pada buah salak pondoh (Salacca edulis Reinw.) [thesis]. Bogor (ID): Institut Pertanian Bogor. Ramachandra CT, Rao PS. 2008. Processing of Aloe vera leaf gel: a review. Am J
Agric Biol Sci. 3(2):502–510.
Reynolds T, Dweck AC. 1999. Aloe vera leaf gel: a review update. J
Ethnopharmacology. 68:3-37.doi:10.1016%2Fs0378-8741%2899%2900085-9.
Robertson GL. 2012. Food Packaging: Principles and Practice, Third Edition. Boca Raton: CRC Press.
Ščetar M, Kurek M, Galić K. 2010. Trends in fruit and vegetable packaging – a review.
Croatian J Food Technol, Biotech, Nutr. 5(3-4):69-86.
Skurtys O, Acevedo C, Pedreschi F, Enrione J, Osorio F, and Aguilera JM. 2010. Food hydrocolloid edible films and coatings. Department of Food Science and Technology, Universidad de Santiago de Chile.
Sothornvit R, Krochta J M. 2001. Plasticizer effect on mechanical properties of b-lactoglobulin films. J Food Eng. 50(2001):149-155. (in) Chiumarelli M, Hubinger MD. 2014. Evaluation of edible films and coatings formulated with cassava starch, glycerol, carnauba wax and stearic acid. J Food Hydrocolloids. 38(2014):20-27. Tucker GA. 1993. Biochemistry of Fruit Ripening. Seymour GB, Taylor JE, Tucker
17
Valero D, Serrano M. 2010. Postharvest Biology and Technology for Preserving Fruit Quality. Boca Raton: CRC Press.
Vargas M, Pastor C, Chiralt A, McClements D J, González-Martínez C. 2008. Recent advances in edible coatings for fresh and minimally processed fruits. Critical Reviews in Food Science and Nutrition. 48:496-511. (in) Chiumarelli M, Hubinger MD. 2014. Evaluation of edible films and coatings formulated with cassava starch, glycerol, carnauba wax and stearic acid. J Food Hydrocolloids. 38(2008):20-27. Winarti C, Miskiyah, Widaningrum. 2012. Teknologi produksi dan aplikasi pengemas
18
Appendix 1 Time series sample documentation
C1 = Control, C2 = Fresh edible coating, C3 = Powdered edible coating
8-10 oC Ambient temperature
C1 C1
C3 C2 C3 C2
Day 0
19
Appendix 2 Analysis methods
1. Weight loss and percentage of decay (AOAC 2005)
Weight loss was determined by gravimetric, which compare the gap of weight before storage and after storage. Weight loss during storage can be obtained by:
Weight loss = (Initial weight – Final weight) x 100% Final weight
2. Firmness of fruit (Penetrometer manual)
Fruit firmness was analyzed by using penetrometer. Water balance indicator in water pass is set to be in the center point to make sure it was on the precise level. Then sample is put on the needle tip so the needle will not pierce salak’s seed. The needle was inserted at 8 points of the fruit base and 4 adjacent values were used on statistical analysis. The penetrometer needle pierced for 5 seconds and puncture depth is shown in units of millimeter. The data on analysis was expressed as mm/5 seconds.
3. Value of pH (AOAC 2005)
Value of pH analysis was determined by using pH meter. It is basically analyzing the activity of ion hydrogen in potentiometric/electrophotometric. Before analysis, pH meter is calibrated by using buffer solution pH 7, then electrode is dried by using tissue. Electrode is rinsed by sample solution, and then it is put in the sample solution until digital in pH meter shows fixed scale.
4. Titratable Acidity (AOAC 2005)
Titratable acidity was determined by using iodometri method. The 5-10 grams sample is titrated by NaOH 0.1N with 2-3 drops of amilum solution 1% as indicator. Titration is stopped when pink color formed.
�� � � ( � ) =� , � �
5. Viscosity (AOAC 2005)
Viscosity was determined by using Ostwald viscometer. Distilled water 10 ml is inserted to Ostwald pipe, then it is sucked until upper red sign by using balb. Unplug bulb then distilled water fall to under red sign. Duration for distilled water to reach under red sign from upper red sign is expressed as t water. Sample is treated like distilled water.
20
Appendix 3 Analysis of salak’s pH during storage
Repetition 1 Repetition 2
T1C
Temperature repetition Coating
uncoating fresh powder
ambient 1 0.1400 0.0925 0.1450
2 0.0975 0.1025 0.0775
cold 1 0.0570 0.0195 0.0485
2 0.0630 0.0195 0.0180
Temperature repetition Coating Total
uncoating fresh powder
21
Appendix 4 Analysis of salak’s firmness during storage
Repetition 1 Repetition 2
T1C
Rate of salak firmness change
Temperature repetition Coating
uncoating fresh powder
ambient 1 -0.275 -0.1875 -0.5625
2 -0.325 -0.3875 -0.05
cold 1 0.0525 0.8825 0.335
2 0.2625 0.5875 0.585
Temperature repetition Coating Total
uncoating fresh powder
22
Appendix 5 Analysis of percentage of decay
Repetition 1 Repetition 2
T1C1 T1C2 T1C3 T2C1 T2C2 T2C3 T1C1 T1C2 T1C3 T2C1 T2C2 T2C3
0 0 0 0 0 0 0 0 0 0 0 0 0
3 17.75 13.58 16.96 0 0 0 31.02 0 0 0 0 0
8 89.43 66.7 82.09 0 0 0 87.87 89.57 84.38 0 0 0
15 44.81 30.34 12.13 11.7 0 15.31
17 100 100 100 100 100 100
Rate of decay
Temperature repetition Coating
uncoating fresh powder
ambient 1 44.714 33.349 41.046
2 43.933 44.785 42.191
cold 1 24.481 23.034 21.213
2 21.17 20 21.531
Temperature repetition Coating Total
uncoating fresh powder
ambient 1 44.714 33.349 41.046 119.109
2 43.933 44.785 42.191 130.909 Subtotal 88.647 78.134 83.237 250.018
cold 1 24.481 23.034 21.213 68.728
2 21.17 20 21.531 62.701
Subtotal 45.651 43.034 42.744 131.429 Total 134.298 121.168 125.981 381.447
FK 12125.15
ANOVA
Source SS df MS F P
5% 1%
P 1202.148 5 240.4297 18.86067 4.39 8.75
A (Temperature) 1171.946 1 1171.946 91.9341 5.99 13.75 B (Coating) 22.0612 2 11.0306 0.865303 5.14 10.92
A*B 8.141356 2 4.070678 0.319327 5.14 10.92
Error 76.48604 6 12.74767
23
Appendix 6 Analysis of salak’s weight loss
Repetition 1 Repetition 2
T1C1 T1C2 T1C3 T2C1 T2C2 T2C3 T1C1 T1C2 T1C3 T2C1 T2C2 T2C3 0 0.00 0.00 0.00 0.00 0.00 0.00 0.00 0.00 0.00 0.00 0.00 0.00 1 0.65 0.61 0.61 0.60 0.46 0.51 0.71 0.56 0.66 0.50 0.56 0.44 2 0.85 0.86 0.90 0.58 0.71 0.62 0.88 0.88 0.90 0.60 0.64 0.68 3 0.82 0.80 0.82 0.48 0.48 0.45 0.91 0.81 0.87 0.46 0.52 0.61 7 4.71 4.53 4.59 1.93 1.90 2.19 5.15 4.33 5.12 2.24 2.06 1.94 8 1.18 1.10 1.15 0.40 0.42 0.46 1.36 1.06 1.12 0.44 0.53 0.44
9 0.83 0.74 0.74 0.75 0.84 0.80
10 0.58 0.51 0.57 0.54 0.56 0.58
11 0.57 0.62 0.58 0.63 0.66 0.65
14 1.75 1.77 1.76 1.90 1.97 2.09
15 0.42 0.47 0.45 0.51 0.53 0.47
16 0.28 0.23 0.23 0.24 0.42 0.37
17 1.29 1.43 1.35 1.25 1.32 1.27
Rate of weight loss
Temperature repetition Coating
uncoating fresh powder
ambient 1 0.5148 0.4909 0.5025
2 0.5752 0.4737 0.5407
cold 1 0.0374 0.0432 0.0375
2 0.0387 0.0458 0.0462
Temperature repetition Coating Total
uncoating fresh powder
ambient 1 0.5148 0.4909 0.5025 1.5082
2 0.5752 0.4737 0.5407 1.5896
Subtotal 1.09 0.9646 1.0432 3.0978
cold 1 0.0374 0.0432 0.0375 0.1181
2 0.0387 0.0458 0.0462 0.1307
Subtotal 0.0761 0.089 0.0837 0.2488
Total 1.1661 1.0536 1.1269 3.3466
24
ANOVA
Source SS df MS F P
5% 1%
P 0.680458 5 0.136092 297.6099 4.39 8.75
A (Temperature) 0.6764 1 0.6764 1479.176 5.99 13.75 B (Coating) 0.00163 2 0.000815 1.782798 5.14 10.92
A*B 0.002427 2 0.001214 2.653858 5.14 10.92
G 0.002744 6 0.000457
25
BIOGRAPHY OF AUTHOR
The author was born in Banyuwangi, East Java, on November 20th 1992. He is the last son of the three children of Pak Kurmen and
Bu Romelah. He has finished his junior high school at SMP Negeri 2 Genteng in 2008, and then continued at SMA Negeri 1 Genteng and has graduated in 2011. He continued his study at Department of Agroindustial Technology, Institut Pertanian Bogor (IPB).