@Indonesian National Institute of Aeronautics and Space (LAPAN) and
DERIVING INHERENT OPTICAL PROPERTIES FROM MERIS IMAGERY AND IN SITU MEASUREMENT USING QUASI-ANALYTICAL ALGORITHM
Wiwin Ambarwulan1*, Widiatmaka2, and Syarif Budhiman3
1
Geospatial Information Agency, Cibinong, Indonesia
2
Dept. of Soil Science, Bogor Agricultural University, Bogor, Indonesia
3
National Institute of Aeronautics and Space, Jakarta, Indonesia
*
e-mail: [email protected]; [email protected]
Abstract. The paper describes inherent optical properties (IOP) of the Berau coastal waters derived from in situ measurements and Medium Resolution Imaging Spectrometer (MERIS) satellite data. Field measurements of optical water, total suspended matter (TSM), and chlorophyll-a (Chl-a) concentrations were carried out during the dry season of 2007. During this periode, only four MERIS data were coincided with in situ measurements on 31 August 2007. The MERIS top-of-atmosphere radiances were atmospherically corrected using the MODTRAN radiative transfer model. The in situ
optical measurement have been processed into apparent optical properties (AOP) and sub surface irradiance. The remote sensing reflectance ofin situmeasurement as well as MERIS data were inverted into the IOP using quasi-analytical algorithm (QAA). The result indicated that coefficient of determination (R2) of backscattering coefficients of suspended particles (bbp) increased with increasing wavelength, however the R2 of absorption spectra of phytoplankton (aph) decreased with increasing wavelength.
Keywords: QAA, MODTRAN, MERIS, Remote sensing reflectance, Berau estuary water
1 INTRODUCTION
The Berau estuary, East Kalimantan, is a high biodiversity site in Indonesia that has been declared as a Marine Protected Area (MPA) by the Indonesian government. Mapping of suspended sediment concentration and water transparency are essential for monitoring the health of the ecosystem and especially of coral reefs. In this study area, the coral reef ecosystem is located at 40 to 100 km from the mouth of the Berau river. Water quality monitoring in this environment becomes increasingly important because there are enhanced anthropogenic activities in the Berau catchment such as coal mining and deforestation whichhave increased the load of suspended sediment, chemicals, and nutrients into the estuary. Mapping of total suspended matter distribution as well as Chl-a concentration using an accurate methodology will help the coastal manager to arrange the plan of environmental protection in order to sustain the MPA program.
Remotely sensed imageries play an important role in coastal area management,
by providing the synoptic view of landscape. Such view is practically impossible to be obtained by conventional in situ
measurements. Ocean color remote sensing applications utilize the spectral characteristics and variations of radiometric data to derive information about some of the constituents of the water. Techniques for water constituent retrieval have evolved from an empirical to the semi-analytical approach. The empirical algorithms (Gordon & Morel, 1983) only capable retrieving a single constituent concentration. The semi-analytical method is capable in retrieving three water constituents simultaneously.
2 International Journal of Remote Sensing and Earth Sciences Vol.10 No.1 June 2013 clear indications of changes in water
characteristics. The apparent optical properties (AOPs), are those optical properties that are influenced by the angular distribution of the light field, as well as by the nature and quantity of substances present in the medium. The AOPs parameters are diffuse attenuation coefficients (Kd), as well as subsurface irradiance reflectance R(0-), remote sensing reflectance (Rrs). Various models have been developed to relate IOPs and AOPs (IOCCG, 2006). Salama et al.
(2009) developed an algorithm, modified from the GSM semi-analytical model, for deriving bio-optical properties such as IOPs in inland waters. Ambarwulan et al. (2011) studied the specific inherent optical properties of Berau water using Bio-Optical Model Inversion.
The total absorption coefficient a(λ) and total backscattering coefficient bb(λ) are the basic IOPs in ocean color remote sensing, which are the key to connect AOPs from the remote sensor and the concentration of water component. Multi-band quasi-analytical algorithm (QAA) developed by Lee et al.
(2002) to retrieve absorption and backscattering coefficients, as well as absorption coefficient of phytoplankton pigments and CDOM have been used in this study. The main idea of QAA was to calculate optical properties in a level-by-level
scheme. Firstly, the values of total absorption and backscattering coefficients were analytically calculated from values of remote-sensing reflectance. Then, phytoplankton and CDOM coefficients were decomposed from the total absorption coefficients. The goal of this research was to retrieve IOPs from MERIS data using QAA and Case-2 Regional Algorithm.
2 MATERIALS AND METHODS
2.1 The study area
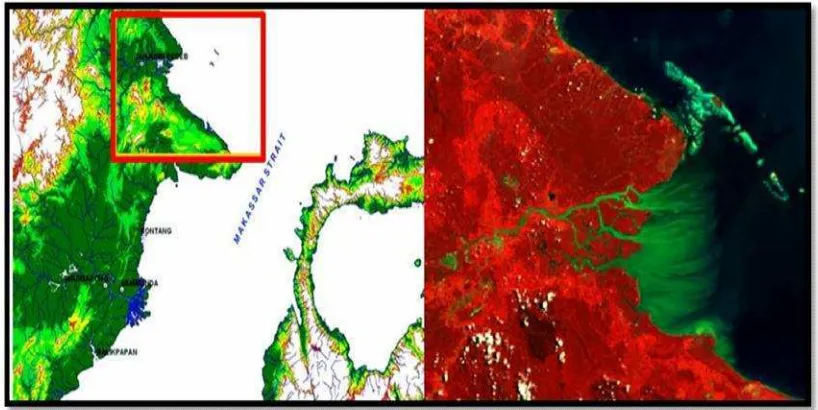
[image:2.595.92.501.532.737.2]The study area is Berau Estuary waters, situated in east Kalimantan and the northern Makassar straits affected by the Indonesian Through-Flow (ITF) (Figure 1). The ITF affects the predominant along-shore current in East Kalimantan coastal waters in southward direction through the Makassar straits. The area is also influenced by tidal (semi-diurnal), seasonal (monsoon), and intra-annual effects. The Berau coral reef and atolls system are distributed north from the Berau delta. From the land side, the Berau river accounts for a substantial amount of annual fresh water and sediment input into the coastal zone. Thus, studying the coastal dynamics in the Berau estuary is very interesting due to its relative small area, but it is composed of a complex ecosystem and processes.
2.2 In situ observations
The in situ observations involved water sampling, in-water radiometer measurements (using Ocean Optic Spectrometer - USB4000), and Secchi disk depth measurement for transparency of light. Bio-geophysical parameters were also measured using a Horiba U10 water quality multi-sensor probe forconductivity, temperature, pH, turbidity, dissolved oxygen, and salinity. The observations were carried out during August - September 2007. From each station, water sample was collected. Under and above water radiometric measurements were carried out using the Ocean Optic Spectrometer USB4000. Spectra of subsurface irradiance were measured at three depths of 10, 30 and 50 cm. The subsurface irradiance reflectance R(0-), was then calculated from the measured subsurface irradiance spectra at 10, 30, and 50 cm depth. The water sampling and radiometer observations were always conducted from the area where the was no shadow of the boat.
2.3 The AOP generated through water sample analysis
The above surface remote sensing reflectance (Rrs) was an input on the estimation IOP using QAA. The Rrs ofin situ optical measurement obtained from the subsurface irradiance reflectance R(λ,0-) at
each wavelength (λ) was calculated. TheR(0-)
was one of AOP parameters as the ratio of upward (Eu) and downward (Ed) irradiance (μWcm-2nm-1) just beneath the water surface (Mobley, 1994). The subsurface remote sensing reflectance was calculated as ratio between the subsurface irradiance reflectance and Q (geometric anisotropy factor of the underwater light field). It was usually taken as Q = 5 sr (Gege, 2005). From the subsurface remote sensing reflectance, the above surface remote sensing reflectance was calculated by multiple Rrs(0-)
with 0.544 (Bhattiet al.,2009).
2.4 The AOP retrieved from MERIS imagery
The remotely sensed imagery used in this study was Medium Resolution Imaging
Spectrometer (MERIS). The MERIS Level 1b (L1b) and Level 2 (L2) were provided by the European Space Agency (ESA). The MERIS recorded on August 31, 2007 was used in this study. The above surface remote sensing reflectance Rrs(0+) of MERIS data was derived with different atmospheric correction methods. A radiative transfer models MODerate spectral resolution atmospheric TRANsmittance (MODTRAN) for atmospheric simulation and correction was applied in this study (Berk et al.,2000). The Case-2 Regional algorithm processor (C2R) (Doerffer and Schiller, 2007) and the Free University of Berlin algorithm processor (FUB) (Schroeder and Schaale, 2005) were Case-2 plug-in algorithms in BEAM Visat, and they were based on an artificial neural network trained on the basis of radiative transfer model calculations. The main task of these algorithms was to retrieve the water (TOW) reflectance from the top-of-atmosphere (TOA) reflectance derived from the radiance measured by the satellite sensor.
2.5 Deriving inherent optical properties from model inversion
The IOPs of Berau estuary waters were derived using QAA. The Rrs in situ measurement and Rrs MERIS were input in the QAA. The subsurface remote sensing reflectance (rrs) in this study was calculated based on a function of rrs(λ) = Rrs(λ)/(0.52 + 1.7Rrs(λ)) (Lee at al., 2002). A full
description of the QAA was presented by Lee
et al. (2002) and IOCCG (2006) and Lee et al. (2010). Briefly, the QAA employs a series of analytical, semi-analytical and empirical algorithms to convertrrs(λ)toa(λ),andbb(λ).
4 International Journal of Remote Sensing and Earth Sciences Vol.10 No.1 June 2013 QAA includea(λ), bbp(λ), aph(λ), andadg(λ) of
wavelengths rrsvalues at 410, 440, 490, 510,
555, and 670 nm.
3 RESULTS AND DISCUSSION
3.1 Retrieving IOPs using QAA
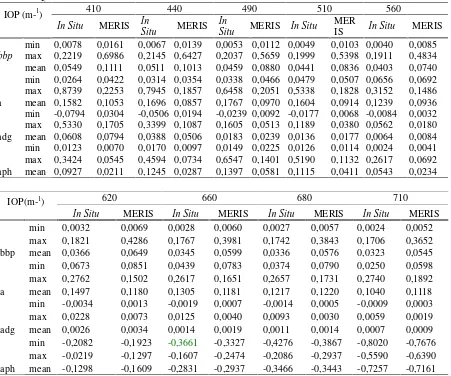
The QAA algorithms steps to retrieve IOPs fromRrswere applied to thein situdata sets and MERIS data set. The IOPs retrieved using QAA fromRrs in situmeasurement and Rrs MERIS data was displayed in Table 1. In general, derived values ofbbpwater are in the range found by previous study. Ambarwulan
et al. (2011) found the backscattering of suspended sediment (bbp) of the Berau estuary water using Bio-optical model inversion ranged at the value from clear to turbid water (bbp=0,019 - 0,604 m-1).
The backscattering coefficients of suspended particles bbp of Rrs of in situ measurement and Rrs MERIS data showed that the highest value of thebbp was obtained in the short wavelength and continually decreases with increasing wavelength (Table 1). Thebbp derived fromRrsMERIS data was higher compared to the bbp derived from Rrs in situ measurement. The difference between
[image:4.595.76.527.379.755.2]in situ measurement and MERIS data could also be due to the within-pixel heterogeneity. The in situ measurements were obtained at point locations that represent a very small homogenous water footprint, while the MERIS sensor records the signal over a much larger 1.44 km2water surface area (1.2 km resolution RR data).
Table 1. The IOPs of the Berau Estuary waters retrieval from in situ and MERIS data using QAA.
IOP (m-1) 410 440 490 510 560
In Situ MERIS In
Situ MERIS In
Situ MERIS In Situ
MER
IS In Situ MERIS
bbp
min 0,0078 0,0161 0,0067 0,0139 0,0053 0,0112 0,0049 0,0103 0,0040 0,0085 max 0,2219 0,6986 0,2145 0,6427 0,2037 0,5659 0,1999 0,5398 0,1911 0,4834 mean 0,0549 0,1111 0,0511 0,1013 0,0459 0,0880 0,0441 0,0836 0,0403 0,0740 a
min 0,0264 0,0422 0,0314 0,0354 0,0338 0,0466 0,0479 0,0507 0,0656 0,0692 max 0,8739 0,2253 0,7945 0,1857 0,6458 0,2051 0,5338 0,1828 0,3152 0,1486 mean 0,1582 0,1053 0,1696 0,0857 0,1767 0,0970 0,1604 0,0914 0,1239 0,0936 adg
min -0,0794 0,0304 -0,0506 0,0194 -0,0239 0,0092 -0,0177 0,0068 -0,0084 0,0032 max 0,5330 0,1705 0,3399 0,1087 0,1605 0,0513 0,1189 0,0380 0,0562 0,0180 mean 0,0608 0,0794 0,0388 0,0506 0,0183 0,0239 0,0136 0,0177 0,0064 0,0084 aph
min 0,0123 0,0070 0,0170 0,0097 0,0149 0,0225 0,0126 0,0114 0,0024 0,0041 max 0,3424 0,0545 0,4594 0,0734 0,6547 0,1401 0,5190 0,1132 0,2617 0,0692 mean 0,0927 0,0211 0,1245 0,0287 0,1397 0,0581 0,1115 0,0411 0,0543 0,0234
IOP(m-1) 620 660 680 710
In Situ MERIS In Situ MERIS In Situ MERIS In Situ MERIS
bbp
min 0,0032 0,0069 0,0028 0,0060 0,0027 0,0057 0,0024 0,0052 max 0,1821 0,4286 0,1767 0,3981 0,1742 0,3843 0,1706 0,3652 mean 0,0366 0,0649 0,0345 0,0599 0,0336 0,0576 0,0323 0,0545
a
min 0,0673 0,0851 0,0439 0,0783 0,0374 0,0790 0,0250 0,0598 max 0,2762 0,1502 0,2617 0,1651 0,2657 0,1731 0,2740 0,1892 mean 0,1497 0,1180 0,1305 0,1181 0,1217 0,1220 0,1040 0,1118
adg
min -0,0034 0,0013 -0,0019 0,0007 -0,0014 0,0005 -0,0009 0,0003 max 0,0228 0,0073 0,0125 0,0040 0,0093 0,0030 0,0059 0,0019 mean 0,0026 0,0034 0,0014 0,0019 0,0011 0,0014 0,0007 0,0009
aph
The total absorption coefficient (a) of the Berau estuary waters from previous study (Ambarwulan et al., 2011) found the absorptiom of chlorophyll-a (Chl-a) was between 0,037 to 0,108 (m-1). The aph was higher in short wavelength decreased with increasing wavelength. In other hand, the absorption coefficient of the combined absorption of colored detritus and dissolved material, adg derived from Rrs in situ measurement was lower compared to the Rrs MERIS derived data. The aph decrease with increasing wavelength and started at wavelength 620 nm were negative value.
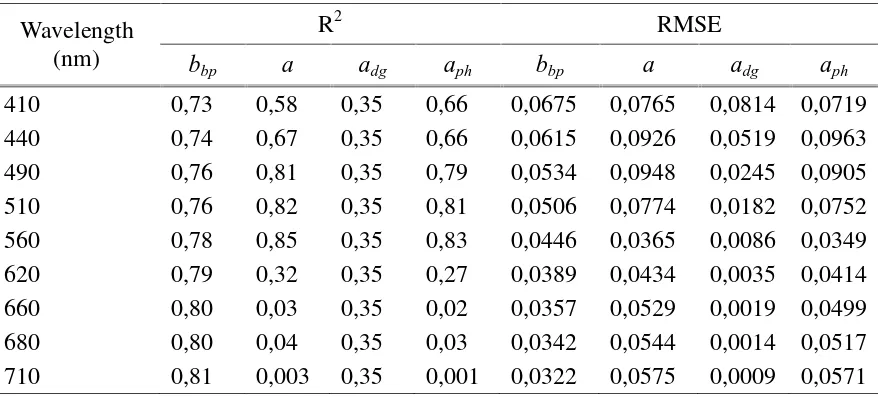
In order to understand between both data sets, the coefficient of determination (R2) and root mean square error (RMSE) were calculated and were displayed in Table 2. The RMSE was used to express the differences between IOPs of Rrs measured and Rrs derived from MERIS data. The R2 ofbbpwas the highest compare to the total absorption (a) as well as adgand aph. The R2 of the bbp increased with increasing wavelengths. The RMSE of the bbp was also the lowest one compare to the others and decrease the RMSE with increasing the wavelength.This can be explained due to the backscattering of particle more sensitive in the high wavelength. However the R2 of total absorption coefficient (a) decrease with
increasing wavelength. The magnitude of RSME of a was decreased with increasing the wavelength. In this study the adg on all wavelengths were similar (R2=0,35), however the RMSE decreased with increasing the wavelength. The absorptionof Phytoplankton (aph) has similar trend withbbp which is decreased with increasing wavelength. This result can be explained due to the absorption is more sensitive in the short wavelength (blue and green band).
3.2 Retrieving IOPs using C2R
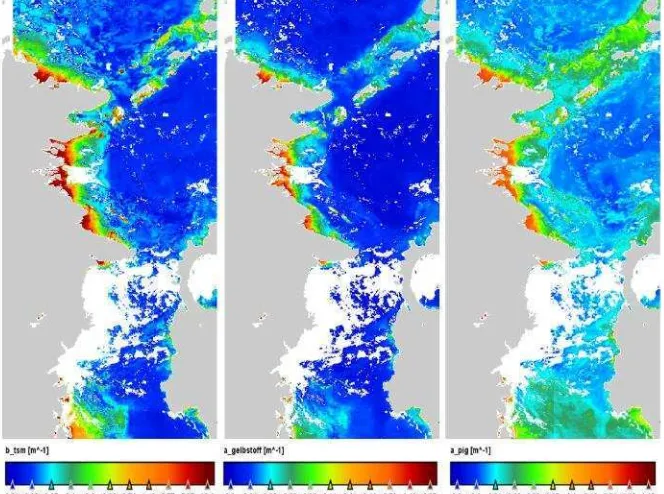
[image:5.595.74.513.560.759.2]The Case 2 Regional algorithm developed by Doeffer (2007) plug-in on the Beam Visat derived some parameters of the water body such as IOPs (adg, TSM concentration, Chlorophyll_a concentration and AOP reflectance). The distribution of IOPs of the Berau estuary derived from MERIS data using C2R processor algorithm is displayed in Figure 2. It clearly shows that the study area, which is located in a tropical region, was usually covered by clouds. It was difficult to find MERIS data with low cloud cover, as shown clearly in Figures 2. High IOPs were found at the location close to the river mouth and they decrease when going into the outer shelve.
Table 2. Inter-comparison between IOPs of Rrs derived from in situ measurement and Rrs of MERIS after MODTRAN Atmospheric correction.
Wavelength (nm)
R2 RMSE
bbp a adg aph bbp a adg aph
410 0,73 0,58 0,35 0,66 0,0675 0,0765 0,0814 0,0719
440 0,74 0,67 0,35 0,66 0,0615 0,0926 0,0519 0,0963
490 0,76 0,81 0,35 0,79 0,0534 0,0948 0,0245 0,0905
510 0,76 0,82 0,35 0,81 0,0506 0,0774 0,0182 0,0752
560 0,78 0,85 0,35 0,83 0,0446 0,0365 0,0086 0,0349
620 0,79 0,32 0,35 0,27 0,0389 0,0434 0,0035 0,0414
660 0,80 0,03 0,35 0,02 0,0357 0,0529 0,0019 0,0499
680 0,80 0,04 0,35 0,03 0,0342 0,0544 0,0014 0,0517
6 International Journal of Remote Sensing and Earth Sciences Vol.10 No.1 June 2013 The inter-comparison between IOPs
derived using QAA and using C2R of MERIS data August 31, 2007 displays in Figure 3. The results showed a large discrepancy between the backsacttering coeffcient of particles (bbp) at wavelength 440 nm derived from MERIS data using C2R
[image:6.595.133.465.182.429.2]and QAA, indicating by a relatively low correlation (R2=0.57) and the relatively high RMSE (RMSE=0.891). The insufficient atmospheric correction achieved in the C2R processor algorithms and MODTRAN at the blue wavelength domain may be responsible for this.
[image:6.595.150.446.480.724.2]Figure 2. IOPs of the Berau Estuary waters derived from MERIS RR (August 31, 2007) using C2R algorithm.
In the case of absorption, the total absorption (a) showed a relatively better correlation between both algorithms (R2=0,66). However, the decomposition of a
intio adg and aph at the same wavelength produced relatively low correlation (R2=0.59). The descrepancy between both algorithm could be explained by three reasons (Ambarwulan, et al., 2010): (i) large error induced by atmospheric correction in cloud-shadowed (Matthew et al., 2000) and hazy regions which prevailed off shore the Berau estuary; (ii) large error induced by model parameterization and inversion in turbid waters; and (iii) large error induced by model parameterization and inversion in clear area affected by bottom reflectance.
4 CONCLUSION
In the equatorial coastal zone, the MERIS RR data permitted to derive inherent optical properties (IOPs) with a reasonable accuracy. The QAA proved robust for estimation IOPs from in situ measurement and MERIS data. The inter-comparison between IOPs retrieved from Rrsin situ measurement and RrsMERIS data found that the backscattering coefficient (bbp) was the best correlation (R2>73) compare to the absorption coefficient (a, adg, aph). This study also evaluated the IOPs derived from MERIS data using QAA algorithm and C2R processor algorithm. The inter-comparison of IOPs ( bbp, a, adg and aph) on wavelength 440 nm found that the absortion coefficient, a, was the highest R2 compare to others. However in term of RMSE, the bbp was the highest RMSE value the compare to the RMSE of absorption coefficient.
ACKNOWLEDGMENT
The financial support for this research was provided under the East Kalimantan Project financed by the Foundation for the Advancement of Tropical Research (WOTRO) Royal Netherlands Academy of Arts and Sciences (KNAW). The authors would like to thank the European Space Agency for providing the MERIS data.
Acknowledgement also to Prof. Dr Ing Wouter Verhoef, Dr C.M. Mannaerts, Dr. M.S. Salama, and Dr. H.J. van der Woerd for the invaluable advice and assistance.
REFERENCES
Ambarwulan, W., M.S. Salama, C.M. Mannaerts, W. Verhoef, 2011, Estimating the specific inherent optical properties of tropical coastal water using bio-optical model inversion in the Berau Coastal Waters, Indonesia.
Hydrobiology Journal, 658:197–211 DOI 10.1007/s10750-010-0473-7. Ambarwulan, W., 2010, Remote sensing of
tropical coastal waters: case study of the Berau Estuary - East Kalimantan, Indonesia. PhD Dissertation. University of Twente - International Institute for Geo-information Science and Earth Observation, Enschede, The Netherlands. 153p. Berk, A., G.P. Anderson, P.K. Acharya, J.H. Chetwynd, L.S. Bernstein, E.P. Shettle, M.W. Matthew, and S.M. Adler-Golden, 2000, MODTRAN4 USER’s
MANUAL. Hanscom AFB: Air Force Research Laboratory, Space Vehicles Directorate, Air Force Materiel Command, MA 01731–3010, 97p. Bhatti, A.M., D. Rundquist, J. Schalles, L.
Ramirez, and S. Nasu, 2009, A comparison between above-water surface and subsurface spectral reflectances collected over inland waters.Geocarto Int., 24:133–141. Doerffer, R. H. Schiller, 2007, The MERIS
case 2 water algorithm. Int. J. Remote Sens., 28:517–535.
Gege, P., 2005, The water colour simulator WASI, User manual for Version 3. DLR Internal Report IB 564-01/05. 83p.
Gordon, H.R. and A.Y. Morel, 1983, Remote assessment of ocean color for interpretation of satellite visible imagery: a review. Springer Press, New York.
8 International Journal of Remote Sensing and Earth Sciences Vol.10 No.1 June 2013 of algorithms, and applications. Lee,
Z.P. (ed.), Reports of the International Ocean-Colour Coordinating Group, No. 5, IOCCG, Dartmouth, Canada. Lee, Z.P., R. Arnone, C. Hu, P. J. Werdell,
B.Lubac, 2010, Uncertainties of optical parameters and their propagations in an analytical ocean color inversion algorithm, Appl. Opt.(49) No. 3, 369-481.
Lee, Z.P., K.L. Carder, and R. Arnone, 2002, Deriving inherent optical properties from water color: a multiband quasi-analytical algorithm for optically deep waters,Appl. Opt., 41:5755–5772. Matthew, M.W., S.M. Adler-Golden, A. Berk,
S.C. Richtsmeier, R.Y. Levine, L.S. Bernstein, P.K. Acharya, G.P. Anderson, G.W. Felde, M.P. Hoke, A. Ratkowski, H-H. Burke, R.D. Kaiser, D. P. Miller, 2000, Status of atmospheric correction using a MODTRAN4-based algorithm. SPIE Proceeding, Algorithms for Multispectral, Hyperspectral, and Ultraspectral Imagery VI, Volume 4049.
Mobley, C.D., 1994, Light and water -radiative transfer in natural waters. Academic Press, San Diego.
Nelson, N.B. and D.A. Siegel, 2002, Chromophoric DOM in the open ocean.
In: Biogeochemistry of marine dissolved organic matter. Hansell, D.A., and Carlson, C.A. (eds), Academic Press, San Diego, 774p.
Nelson, N.B., D.A. Siegel, and A.F. Michaels, 1998, Seasonal dynamics of colored dissolved material in the Sargasso Sea. Deep-Sea Res., 45:931-957.
Preisendorfer, R.W., 1976, Hydrologic optics. U.S. Department of Commerce, National Oceanic and Atmospheric Administration, Environmental Research Laboratories, Pacific Marine Environmental Laboratory.
Salama, M.S., A. Dekker, Z. Su, C.M. Mannaerts, and W. Verhoef, 2009, Deriving inherent optical properties and associated inversion-uncertainties in the Dutch Lakes, Hydrology and Earth System Sciences, 13:1113-1121. Schroeder, T. and M. Schaale, 2005, MERIS