http://dx.doi.org/10.12988/ijma.2014.45139
A Hybrid Model for Improving
Malaysian Gold Forecast Accuracy
Maizah Hura Ahmad1, Pung Yean Ping2 , Siti Roslindar Yazir3 andNor Hamizah Miswan4
1,2
Department of Mathematical Sciences, Faculty of Science Universiti Teknologi Malaysia,
81310 UTM Skudai, Johor, Malaysia
3
Faculty of Industrial Sciences & Technology, Universiti Malaysia Pahang, Malaysia
4
Fakulti Teknologi Kejuruteraan, Universiti Teknikal Malaysia Melaka, Malaysia
Copyright © 2014 Maizah Hura Ahmad et al. This is an open access article distributed under the Creative Commons Attribution License, which permits unrestricted use, distribution, and reproduction in any medium, provided the original work is properly cited.
Abstract
A hybrid model has been considered an effective way to improve forecast accuracy. This paper proposes the hybrid model of the linear autoregressive moving average (ARIMA) and the non-linear generalized autoregressive conditional heteroscedasticity (GARCH) in modeling and forecasting. Malaysian gold price is used to present the development of the hybrid model. The goodness of fit of the model is measured using Akaike information criteria (AIC) while the forecasting performance is assessed using bias, variance proportion, covariance proportion and mean absolute percentage error (MAPE).
1 Introduction
A popular precious metal for investment is gold. In Malaysia, one of the highest gold investment demand is for its own gold bullion coins called Kijang Emas. The coins which come in three different sizes of 1 oz, ½ oz and ¼ oz are minted by the Royal Mint of Malaysia. The daily selling and buying prices of these coins are important to investors in order to make an investment decision.
Autoregressive integrated moving average (ARIMA) models have been used for forecasting different types of time series to capture the long term trend. In the case of financial time series that have been shown to have volatility clustering where large changes in the data tend to cluster together and resulting in persistence of the amplitudes of the changes, ARCH based models have been used. In the context of Malaysian gold, the selling price of the 1 oz coins was modelled and forecast using ARIMA and GARCH models [1] [2]. While the models produced a good fit of the data with the GARCH being more superior, a hybrid of those two models is proposed to be able to improve forecasting accuracy [3].
In the current study, a selected series of Malaysian gold is modelled and forecast using the hybrid of ARIMA-GARCH.Akaike information criterion (AIC) is used to assess the goodness of fit. Bias, variance proportion, covariance proportion and mean absolute percentage error (MAPE) are used to evaluate the forecasting performances. All analyses are carried out using a software called E-views.
The paper is organized into 4 sections. Section 2 presents the methodology of the study. Section 3 presents the data analysis. The study is concluded in Section 4.
2 Methodology
Hybrid ARIMA-GARCH Models
ARIMA models are the most general class of models for forecasting a time series, applied in cases where data show evidence of non-stationarity [4]. Non-stationarity in mean can be removed by transformations such as differencing, while non-stationary in variance can be removed by a proper variance stabilizing transformation introduced by Box and Cox [3]. The ARIMA(p,d,q) can be written as
t q t
d
p B B y B
( )(1 ) ( )
q q
q B B B
( )1 1 ... is the moving average operator of order q; (1B) d
is
the dth difference; B is backward shift operator; and t is the error term at time t. The orders are identified through the autocorrelation function (ACF) and the partial autocorrelation function (PACF) of the sample data. The error terms are generally assumed to be independent identically distributed random variables (i.i.d.) sampled from a normal distribution with zero mean, that is t ~ N(0,σ2) where σ2 is the variance. At this point, the model can be used for forecasting.
However, some time series errors do not satisfy the assumption of common variance. The variances are time-varying and conditional. The autoregressive conditional heteroskedasticity (ARCH) class of models pioneered by Engle in 1982 and generalized by Bollerslev in 1986 are popular class of econometric models for describing a series with time-varying conditional variance [5]. The generalized autoregressive conditional heteroskedasticity (GARCH) family models were developed to capture volatility clustering or the periods of fluctuations, and predict volatilities in the future [6]. Past variances and past variance forecasts are used to forecast future variances. The GARCH (p, q) model is
where ut tt2 t ht , t ~N(0,1)
where , , for stationarity;
p is the order of the GARCH terms 2 , which is the last period forecast variance. q is the order of the ARCH terms 2, which is the information about volatility from the previous period measured as the lag of squared residual from the mean equation.
Augmented Dickey-Fuller (ADF)
ADF is one of the widely used unit-root tests to determine stationarity. The testing procedure is applied to the model
Breusch-Godfrey Lagrange Multiplier Test (BG-LM)
BG-LM is a test for autocorrelation. The null hypothesis states that there is no serial correlation of any order up to a certain order lag.
ARCH Lagrange Multiplier Test (ARCH-LM)
ARCH-LM is used to test the presence of heterocedasticity. Let be the residual series. The squared series, is used to check the
presence of ARCH effects where it is defined as follows,
where p is the length of ARCH lags and t is the residual of the series. Test statistic for LM test is the usual F statistics for the squared residuals regression. Rejection of the null hypothesis implies that ARCH effect exists.
Akaike Information Criterion (AIC)
AIC is used to assess the goodness of fit of a model. It is defined as AIC = 2k 2 ln (L)
where L is the maximized value of the likelihood function for the estimated model and k is the number of free and independent parameters in the model.
Mean Absolute Percentage Error (MAPE)
MAPE measures the accuracy of forecast in terms of percentage. The
3 Data Analysis and Results
1,000 2,000 3,000 4,000 5,000 6,000 7,000
500 1000 1500 2000 2500 3000
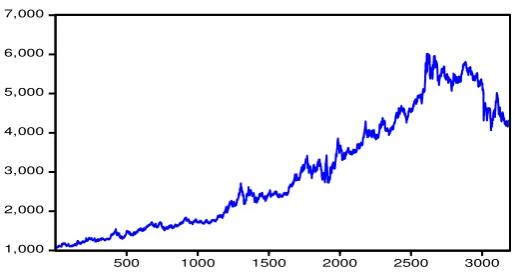
Figure 1: Daily 1 oz Malaysian Gold Prices from 18th Jul 2001 to 15th Sept 2014
An upward trend exists in the gold price data. Let {yt} be the time series of the daily gold price. The return on the tth day is defined as rt = ln(yt)ln(yt-1).
Figure 2 shows the plot of the returns which appears to be stationary. Most of the data are located around the mean of zero.
-.08 -.04 .00 .04 .08 .12 .16
500 1000 1500 2000 2500
Figure 2: Plot of the Returns
The stationarity of the returns is confirmed by the ADF unit-root test as illustrated in Table 1. Based on the table, the null hypothesis that the returns are non-stationary is rejected.
Table 1: Unit Root Test of the Returns
Null Hypothesis: DLN has a unit root Exogenous: None
Lag Length: 0 (Automatic based on SIC, MAXLAG=27)
t-Statistic Prob.*
Augmented Dickey-Fuller test statistic -56.48802 0.0001 Test critical values: 1% level -2.565767
5% level -1.940934 10% level -1.616625
Using ordinary least squares method to estimate the parameters, the most appropriate ARIMA model for this series is ARIMA(1,1,1) with an AIC value of 10.08545 and MAPE value for in-sample forecast of 0.812356 [7]. The model is checked for serial correlation using Breusch-Godfrey Serial Correlation LM Test. The results are shown in Table 2, which indicate that with significance level of 5%, the developed model does not suffer from serial correlation up to lag 5.
Table 2: Breusch-Godfrey Serial Correlation LM Test
F-statistic 2.918448 Prob. F(5,2865) 0.0124 Obs*R-squared 14.55872 Prob. Chi-Square(5) 0.0124
The descriptive statistics and plot of the residuals of the model are presented in Figure 3 and Figure 4 respectively. As presented in Figure 3, the residuals have excess kurtosis and a mean which is very close to zero. From the Jarque-Bera statistic, the null hypothesis of residuals following the normal distribution is rejected.
Figure 3: Descriptive Statistics of the Residuals for ARIMA(1, 1, 1)
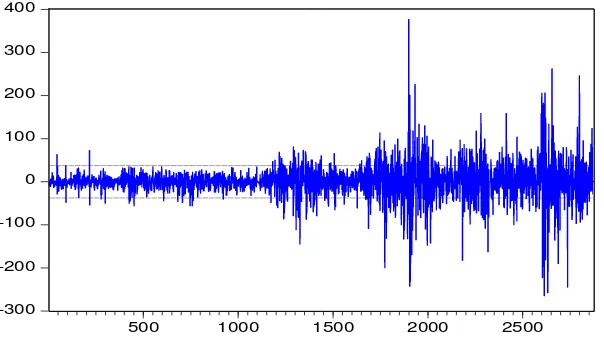
-300
As plotted in Figure 4, there are volatility clustering in the residuals. The residuals of the ARIMA are tested for ARCH effects using the ARCH- LM test. The results are presented in Table 3. From the table, with significance level of 5%, the null hypothesis of ARCH effects do not exist is rejected.
Table 3: Heteroskedasticity Test for ARIMA(1, 1, 1)
F-statistic 120.8169 Prob. F(1,2870) 0.0000 Obs*R-squared 116.0172 Prob. Chi-Square(1) 0.0000
Thus, although the hypothesis of no serial correlation in the model is not rejected, the presence of volatility clustering in the residuals and the results of the ARCH LM test show that the model is not a good fit. Hence, it is necessary to develop a better modelfor Malaysian gold price. A GARCH model is proposed to handle heteroscedasticity in the series. Table 4 presents the estimation results for the hybrid ARIMA (1, 1, 1)-GARCH(2, 1) model as applied to the Malaysian gold price.
Table 4: Estimation Result for ARIMA(1, 1, 1)-GARCH (2, 1)
Variance Equation
C 1.744212 0.487440 3.578313 0.0003 RESID(-1)^2 0.104766 0.022469 4.662635 0.0000 RESID(-2)^2 0.048091 0.023100 -2.081865 0.0374 GARCH(-1) 0.940387 0.006248 150.5098 0.0000
R-squared 0.003390 Mean dependent var 1.624782 Adjusted R-squared 0.002695 S.D. dependent var 37.52772 S.E. of regression 37.47711 Akaike info criterion 9.285385 Sum squared resid 4031012. Schwarz criterion 9.299914 Log likelihood -13331.46 Hannan-Quinn criter. 9.290622 F-statistic 1.627001 Durbin-Watson stat 1.995463 Prob(F-statistic) 0.135481
In Table 4, with significance level of 5%, both the ARCH and GARCH effects are significant. They are the internal causes of volatility in the residuals. The AIC value of the hybrid model is 9.299914 with MAPE value for in-sample forecast of 0.808684. The residuals of the ARIMA-GARCH are tested for ARCH effects using the ARCH- LM test. The results are presented in Table 5.
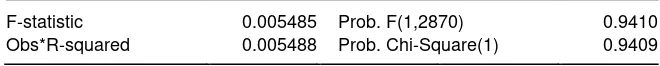
Table 5: Heteroskedasticity Test for ARIMA (1, 1, 1)-GARCH (2, 1)
The results in Table 5 indicate that at significance level of 5%, the null hypothesis of no ARCH effects cannot be rejected. The hybrid model is then tested for serial correlation as presented in Table 6.
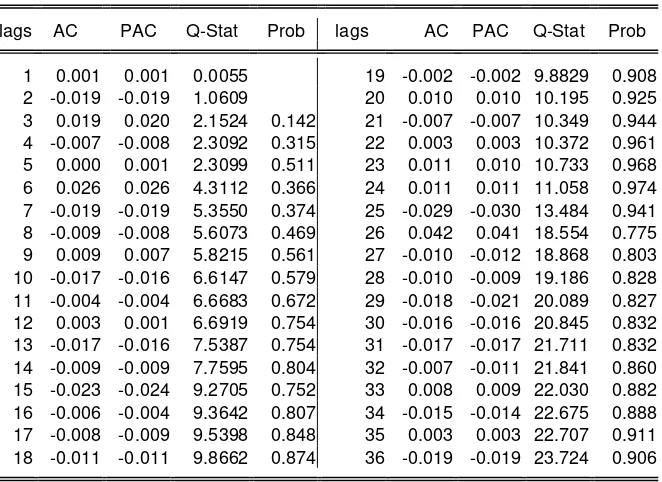
Table 6: Ljung-Box Q-statistics on squared residuals for ARIMA(1,1,1)-GARCH(2,1)
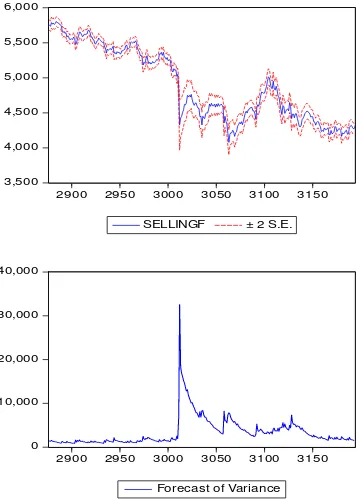
From the Jarque-Bera statistic in Figure 5, the residuals are not normally distributed. However, the hybrid model is used for forecasting. The results of out-sample forecasting are presented in Figure 6.
3,500
2900 2950 3000 3050 3100 3150
SELLINGF ± 2 S.E.
Forecast: SELLINGF Actual: SELLING
Forecast sample: 2876 3194 Included observations: 319
Root Mean Squared Error 59.18209
Mean Absolute Error 39.06320
Mean Abs. Percent Error 0.827670
Theil Inequality Coefficient 0.006023 Bias Proportion 0.020026
2900 2950 3000 3050 3100 3150 Forecas t of Variance
Figure 6: Forecasting Results of ARIMA (1, 1, 1)-GARCH (2, 1)
For comparison purposes, the out-sample forecasts for ARIMA(1, 1, 1) are plotted in Figure 7.
2900 2950 3000 3050 3100 3150
SELLINGF ± 2 S.E.
Forecast: SELLINGF Actual: SELLING
Forecast sample: 2876 3194 Included observations: 319
Root Mean Squared Error 59.59525
Mean Absolute Error 39.19383
Mean Abs. Percent Error 0.830665
Theil Inequality Coefficient 0.006063
Bias Proportion 0.034607
Variance Proportion 0.000627
Covariance Proportion 0.964766
Conclusion
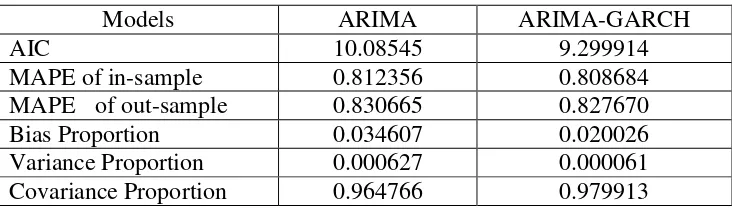
Table 7 presents some results of modelling and forecasting of the daily prices of 1 oz Malaysian gold recorded from 18th July 2001 until 15th April 2014. Two models were used, namely ARIMA and ARIMA-GARCH.
Table 7: Modelling and Forecasting Results
Models ARIMA ARIMA-GARCH
AIC 10.08545 9.299914
MAPE of in-sample 0.812356 0.808684 MAPE of out-sample 0.830665 0.827670
Bias Proportion 0.034607 0.020026
Variance Proportion 0.000627 0.000061 Covariance Proportion 0.964766 0.979913
Some information will always be lost due to using one of the candidate models. Based on the AIC values, the model that minimizes the estimated information loss more is ARIMA-GARCH. ARIMA is 0.46 times as probable as ARIMA-GARCH to minimize the information loss. The bias proportion, the variance proportion, and the covariance proportion sum up to 1. While the bias proportion measures how far the mean of the forecast is from the mean of the actual series, the variance proportion measures how far the variation of the forecast is from the variation of the actual series. The remaining unsystematic forecasting errors are measured by the covariance proportion measures. Based on Table 7, the forecasts produced by ARIMA-GARCH are better since the bias and variance proportions are lower than those produced by ARIMA. Furthermore, MAPE values for in-sample and out-sample forecasts for ARIMA-GARCH are lower than those for ARIMA. It can be concluded that in the case of the selling prices of 1 oz Malaysian gold, the hybrid model of ARIMA-GARCH can be an effective way to improve forecasting accuracy achieved by using ARIMA only.
Acknowledgement
This work was supported by RUG Vot No: Q.J130000.2526.08H46. The authors would like to thank Universiti Teknologi Malaysia (UTM) for providing the funds and facilities.
References
[2] Maizah Hura Ahmad and Pung Yean Ping, Modelling Malaysian Gold Using Symmetric and Asymmetric GARCH Models, Applied Mathematical Sciences, 8 (17), 2014, 817-822.
[3] S.R. Yaziz, N.A. Azizan, R. Zakaria and M.H. Ahmad, The Performance of Hybrid ARIMA GARCH Modeling, In: 20th International Congress on Modelling & Simulation 2013 (MODSIM2013), 1-6 December 2013, Adelaide, Australia.
[4] G.E.P. Box, G.M. Jenkins, Time Series Analysis, Forecasting and Control, Holden-Day, San Francisco, 1970.
[5] R. F. Engle, An Introduction to the Use of ARCH/GARCH models in Applied Econometrics, Journal of Business, New York (1982).
[6] T. Bollerslev, Generalized Autorregressive Conditional Heteroskedasticity, Journal of Econometrics, 31 (1986), 307-327.
[7] Nor Hamizah Miswan, Pung Yean Ping and Maizah Hura Ahmad, On Parameter Estimation for Malaysian Gold Prices Modelling and Forecasting, International Journal of Math Analysis, 7(22), 2013, 1059-1068.