NITROGEN FIXATION IN LEGUME TREES :
MEASUREMENT BASED ON 15N TECHNIQUES
Elsje L. Sisworo *, Havid Rasjid *, Widjang H. Sisworo*, Soleh Solahuddin**, and Johannis Wemay*
ABSTRACT
NITROGEN FIXATION IN LEGUME TREES MEASUREMENT BASED ON
15
N TECHNIQUES. A field experiment has been conducted to measure the N2-fixation in six
legume trees, namely Gliricidia sepium (F1), Sesbania sesban (F2), Caliandra tetragona (F3),
Flemengia conges-7ta (F4), Acacia mangium (F5), and Leucena leucocephala (F6), using 15N techniques, e.g. the isotope dilution method. For this technique a reference tree, that is a non N2-fixing tree has to be used. In this experiment three reference trees were planted, but only
one was used, which above ground growth was equal to the legume trees. The reference tree chosen was Eucalyptus alba (R1). Data obtained from this experiment show that in general the legume trees have growth then the reference trees expreesed, in dray weight of various plant
parts and plants and total-N uptake (TN). At harvest some of the legume and reference tree have reached a 2.5m height. The percentage of N2-fixation (%-Fix) ranged from
50 to 70%. The highest %N-Fix was shown by Leucena leucocephala (F6) (70%N-Fix). Hight %N-Fix does not necessarily mean high N-Fix uptake (gn/tree) too. The N-Fix appears to be determined by the TN (gn/tree). The highest N-Fix was contributed by the leaves, which also has the highest percentage of total –N (%TN) compared to the orther plant parts, i.e. roots, stem, and branches.
INTRODUCTION
In tropical crop production the approach to correct soil fertility problems was in the past emphasized on changing the soil condition to the plant needs. Meaning that soil fertility factor such as, pH and nutrient avaibility, were conditioned to meet optimum levels for a certain crop [1]. They [1] further stated that this high-input approach while successful in many temperate regions by obtaining high yields, has created difficulties even failures in tropical and sub-tropical regions. Such regions are usually
characterized by soil of adverse chemical condition needing high costs improve [2]. For such areas including areas in Indonesia, a need to
change to a more low-input technology, where plants are chosen to be adaptable to marginal soil conditions especiality in upland soils has been recognized [3,4,5].
Although most trees can fulfil the above function, nitrogen fixing trees especially legume appears to be the most suitable. Why? This is due to their ability to fix N2 from the atmosphere. With this ability legume trees are capable to grow on infertile soils. To obtain maximum benefit of fixing trees, it is essential to select plant genotypes which have superior N2-fixing power
*
Centre for the Application of Isotopes and Radiation (CAIR) - BATAN **
and to determine enviromental conditions which are needed to enhance nitrogen fixation. To reach these objectives suitable methodologies for assessing N2-fixation are needed.
The strength and weakness of various methods to measure N2-fixation have been discussed in many reviews [6,7,8,9]. Although none the methods is fully satisfactory under all conditions, the 15N technique appears to be widely accepted and have the greatest potential for measuring N2-fixation, where there would be no complications due to uptake of N from the soil [10]. Contrary to the grain and pasture legumes, the 15N technique has been rarely used for legume trees. This is due to several factors. Including limited knowledges of plant parts to be sampled, problems faced by the massive size of trees, their parennial growth habit, which make the selections of reference (non N2-fixing) trees difficult. The most important factor in the use of 15N technique for assessing N2-fixation of legume trees is the selection of a proper reference tree or the so called standard tree. This reference tree has to be a non N2-fixing tree and has to have nearly the same rooting depth as the N2-fixing trees. Another requirement is that of the above ground growth, which has to be nearly equal. But when the N2-fixation capability of the legume trees are high, the criteria needed for the reference trees could be less rigid [11]. Where only N2-fixation rate of several trees are to be determined, no reference tree is needed [10].
This paper reported the use of 15N-labelled ammonium sulphate (AS) to assess the fixing ability of six legume trees in the field using one reference tree.
Obtaining data of N2-fixation capability of legume trees, could be used for choosing a suitable legume tree as an N-Source.
Location
The experiment was conducted at the field station of the Centre for the Application of Isotopes and Radiation, Pasar Jumat, Jakarta, which soil is a red latosol type.
The physical and chemical properties of the soil are as follows Sand . . . 0.7 % S i l t . . . 30.3 % C l a y . . . 69.0 % PH (H2O) . . . 5.4 (KCl ) . . . 4.3
CEC/100g . . . 27 me P2O5 (Olsen) . . . 9 ppm K2O . . . 11 ppm
Organic matter
C . . . 1.25 % N . . . 0.14 % C/N . . . 9 %
Plant matterial
The plants used in this experiment are as follows,
Legume trees (N2-fixing)
Scientific name Local name
F1 ……… F2 ……… F3 ……… F4 ……… F5 ……… F6 ………
Reference trees (non N2-fixing)
R1 ……… R2 ……… R3 ………
Gliricia sepium ……….. Sesbania sesban ……… Caliandra tetragona …. Flemengia congesta ….. Acacia Mangium ……... Leucena leucocephala ..
Eucalyptus alba Swietenia mahagoni Carica papaya
Gliricidia Sesbania Kaliandra Flemengia
Akasia Lamtoro gung
Kayu putih Mahoni
Papaya
After evaluation the above ground growth of the reference trees,
R1 (Eucalyptus alba) was chosen to be used as a reference tree. The two
other reference trees were too small, especially in height compared to the legume trees. All the trees used in this experiment were grown from seeds.
Experimental plots
The design used in this experiment was a randomized block design (RDB) with four replications.
Each experimental plot has a size of 10m x 10m planted at random with a total 100 trees of legume and reference tress, using a planting distance of 1m x 1m. In the middle of the plot a plot with a size of 6m x 6m used to be applied with 15N-labelled ammonium sulphate (AS) with 9.634% atom excess (%a.c). This plot is called an isotope plot. Surrounding the isotopes plot a trench was dug to a depth of 2m. Into the trench a polyethelene sheet was inserted, so that the isotope plot was surrounded by the sheet. The purpose to surround the isotope plot with a polyethelene sheet was to prevent the roots of the trees in the isotope plots to cross out side the plots and vice versa. In the isotope plots 18 legume and 18 reference trees were planted, as shown in Fig. 1.
Application of fertilizer
15
N-labelled AS was used in the isotope plots, while for the rest of the trees non-labelled AS was applied. AS was applied by broadcasting around cach tree. P and K were applied at a rate of 0.1 kg TSP and 0.1 kg KCl per
tree respectively, and were broadcasted around the tree. The rate of 15
N-labelled AS and non-labelled AS applied was 12g AS/tree, which was about 25 kg N/ha or 0.25 kg N/100m2.
This amount was applied in three splits. The first N application was three months after transplanting, the second and third application were done at a one month interval after the first application. The dates of planting and fertilizers application were as follow,
12 June 1995
16 July 1995
16 August 1995
27 December 1995
30 January 1996
4 March 1996
8 April 1996
Seeds planted in PVC containers filled with clean sand
Seedlings transplanted to polyethelene bags filled with 1 kg soil from the experimental site and mixed with 100 g mahure
Plants from polyethelene bags transplanted the field
First application of 15N-labelled and non-labelled AS (3.5 g N/tree), P and K fertilizers
Second application of 15N-labelled and non-labelled AS (3.5g N/tree)
Third application of 15N-labelled and non labelled AS (5g N/tree)
Tree harvest
The whole plant including the roots of the legume and reference trees were harvest. Each plant part, e.g. roots, stem, branches, and leaves were analyzed separately. Measurement of percentage of total –N (%TN) was done by the Kyeldahl method. The percentage of atom excess (%a.e) of each plant part was determined by an emission spectrophotometer, YASCO N-151. The calculation of percentage of N-derived from fertilizer (%NF) and percentage of N-derived fixation (%NFix) is presented in the attachment.
Parameter observed
Parameter observed in this experiment are,
- dry weight of roots, stem, branch, leaves, and plants (roots + stem + branches + leaves)
- percentage of total-N (%TN), percentage of atom excess (%a.e), percentage of N derived from fertilizer (%NF), and percentage derived from N2-fixation (%NFix) were determined for each plant part.
- Total N uptake (TN), N-uptake from fertilizer (NF), and N-uptake from N2-fixation (NFix) of the various plant parts and plants, the %NFix and NFix are expressed only for the whole plant (roots + stem + branches + leaves)
RESULTS AND DISCUSSION
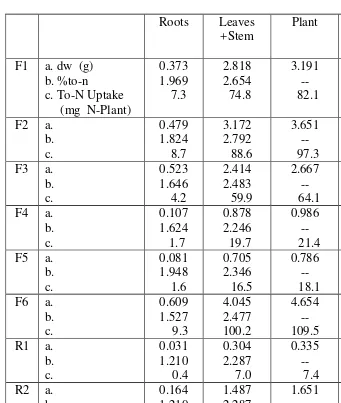
At harvest most of the trees were about 2m to 2.5m heigh. Data in Table 1 show the plant condition at transplanting of seedling into the fields. For legume tree it was shown, that nodules were formed on the roots although Rhyzobium innoculation was not carried out. Apparently the soil has indigenous rhizobia which were able to infect the root of the legume
trees. For the reference trees no nodules were found at all on the roots. At transplanting the reference trees R2 and R3 have better growth expressed
in dry weigh of various plant parts and plants compared to R1 (Table 1) but in the field R1’s growth surpassed R2 and R3 (Table 2). Due to this R1 was choosen to be used as a reference trece to assess the N2-fixation of the legume trees by the 15N method.
High dry weight of the legume trees were found in F1, F2, F3, and F6, while F4 and F5 showed the lowest dry weight (Table 2). In general it could be mention that the legume trees have better growth than the reference trees if expressed in dry weight of various plant parts and dry weight of the plants (Table 2) Looking at the dry weight of the various plant parts, it appears that
for the legume and reference trees the roots have the lowest dry weight. At harvest when digging out the roots, it was observed that the roots were
heavy rains caused heigh water tables and this was able to restrict the root growth to a certain depth. Further it appears that root growth restriction caused low dry weight, and this is obviously the reason why the weight of roots were less than the other plant parts.
An other facts to be mentioned is that the fresh and dry weight of the legume and reference trees showed high CV (Coefficient of Variation). This appear
to be due the different plant species used as mentioned by SANGINGA et al [12]. Apparently in this experiment the high CV obtained due to the
different species in the same block (replication) as well as the differences between blocks.
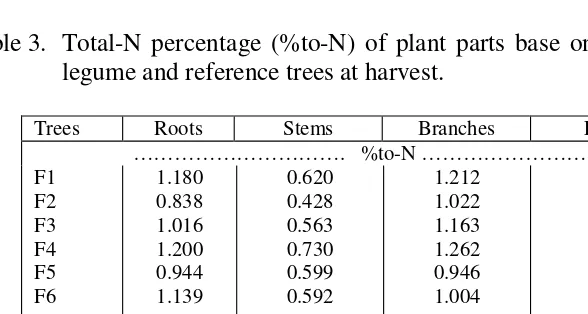
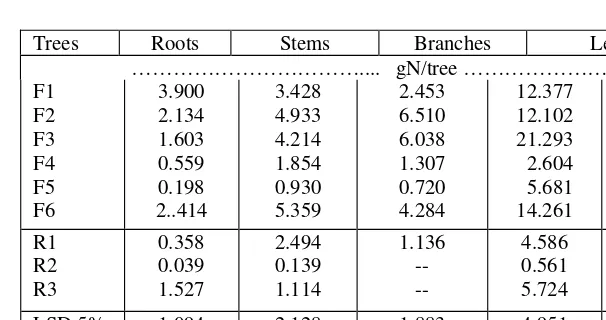
For the legume trees the highest percentage of total-N (%TN) was found in the leaves, followed by the %TN of branches, roots, and stem respectively (Table 3). Like in legume trees, the highest %TN for reference trees were in the leaves followed by the roots and lowest was for the stem (Table 3). While for the branches there was only one value that was for R1, R2 and R3 were considered to have no branches. Having higher dry weight (Table 2) and higher %TN resulted in higher total-N uptake (TN) of the legume trees compared to that of the reference trees, especially for F1, F2, F3, and F6 (Table 4). Field observations and results of fresh and dry weight showed that F4 and F5 are slow growers compared to the other legume trees even compared to R1.
The most important data to be used to measure percentage N-derived from fixation (%NFix) is the percentage of atom exess (%a.e) of the verious plant parts. It was obtained in this experiment that the reference trees have
higher % a.e in their various plant parts than the legume trees (Table 5). If this is due to better growth of the legume trees expressed in higher dry
weight and TN causing higher dilution of the N-fertilizer, Making the %NF of the legume trees lower than the reference trees (Tables 2, 4, and 5). But for legume trees with the low dry weight and TN this is not the case, they still have low %NF theoriti cally they should have high %TN due to lower dilution of N-fertilizer (Tables 2 and 4 : F4, F5 vs R1, R2, R3). Based on these data it could be suggested that the legume trees has another N source beside N from soil and N form fertilizer which dilute the N-fertilizer,
resulting in lower %NF in legume trees than in the reference trees. This source is the N2-fixed from the atmosphere.
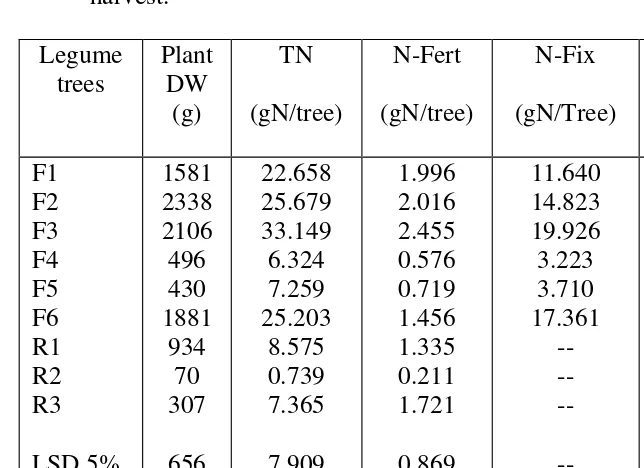
To assess the ability of N2-fixation (%N-Fix) of the legume trees, the %N-Fix is expressed for the whole plant and not for the various plant parts. The calculation of this is presented in the attachment. Based on this calculation the N-Fix of the legume trees range from 50-70% (Table 6). Such a range of various legume trees has been obtained by other research workers as quoted by [12] where the values range from 33 to 78% using the same isotope dilution technique as employed in this experiment. Table 6 furher shows that the tree with the highest %N-Fix does not
It appears that high N-fixation uptake values is determined by the TN of the tree, which is a total of TN of each various plant parts (Table 4) and here it show that the highest TN for F3 was found in the leaves (Table 4, F3 vs F6). From this experiment it looks that the highest TN is derived from the leaves for all the legume trees (Table 4). This high TN in leaves is derived from high dry weight and %TN (Tables 2 and 3). In short it could be suggested that when choosing a tree legume to be used a nitrogen source for other crops several parameters have to be taken into consideration. The %N-fixation alone would not be enough to be the base for choosing a legume tree as a source of N. Other parameters such as %TN. Dry weight of various plant parts have to be considered too. As well known any tree which would be used as an N-source need to have plenty biomass and if possible have also a high %TN. In this experiment it appears that dry weight and %TN of the leaves are the tree`s part which could be the highest N source.
Data from this experiment show that there were differences in the ability of N2-fixation by different legume trees. Here it was found that the legume tree with the highest N2-fixation ability expressed in %N-Fix is F6 (leucena
leucocephala), followed in order by F3 (Caliandra tetragona), F2 (Sesbania
sesban), F1 (Gliricidia sepium), F5 (Acacia mangium), and F4 (Flemengia
congesta) (Table 6).But as mentioned before, the %N-Fix alone is not enough
to consider a legume tree to be a good source of nitrogen which could be used for other crops, but other parameters needed to be taken into consideration, such as high weight and high %TN of biomass
CONCLUSIONS
Several conclusions could be taken from the experiment carried out. The conclusions are as described below,
1. Ammonium sulphate labelled with 10% 15N could be used to obtain detectable percentage of atom excess ( %a.e) in various tree parts.
2. In general it appears that legume trees have better growth than non legume trees. This might be due to the ability of the legume trees to fix N2 from the air, resulting in higher N available for growth compared to the non legume trees (standard trees). In this experiment growth is expressed in dry weight of several plant parts and total dry weight of plants.
3. Using the 15N technique it was found that the highest N2-fixation (%N-Fix) was obtain by F1 (Leucena leucocephala), followed by F3
(Caliandra tetragona), F2 (Sesbania sesban), F1 (Gliricidia sepium), F5
(Acacia mangium), and F4 (Flemengia congesta).
ACKNOWLEDGEMENT
The authors want to express their gratitute to all the technicians of the Soil Plant Nutrition Group, Div. Of Agriculture, Centre for the Application of Isotope and Radiation, who were involved in this experiment, doing the field and the plant analysis work.
REFERENCES
1. K.O. AWONAIKE, G. HADARSON, and K.S. KUMARSINGHE, “Biological Nitrogen Fixation of Gliricidia Sepium/Rhyzobium Symbiosis as Influenced by Plant Genotype, Bacterial Strain and their Interactions”, Trop. Agric (Trinidad) 69 (4) (1992) 381-385
2. C.C. WEBSTER, and P.N. WILSON, “Agriculture in the Tropics, 2nd Edition”, London and New York, Longman (1980) 640
3. B.W. OKIGBO, “Plants and Agroforestry in Land use System in West Africa. In: Plant Research in Agroforestry (Huxley, P.A. Eds),
International Council for Research in Agroforestry (ICRAF), Nairobi (1983)
4. ILCA (International Livestock Centre for Africa), “Livestock Development in Sub-Saharan Africa”, Boulder Colorado, Westview Press (1984)
5. A.N. ATTAH-KRAH, J.E. SUMBERG and R. REYNOLDS, “Leguminous Fodder tree in farming System, In: Potential of Forage
Legumes in Farming System in Sub-Saharan Africa (Eds. Haque, I., Jutzi, S., and Neafe, P.H.)”, Addis Ababa, Ethophia, International
Livestock Center for Africa (ILCA) (1986)
6. P.M. CHALK, “Estimation of N2-fixation by isotopes dilution: An Appraisal of techniques involving N enrichment and their application, Soil Biol. Biochem 17 (1985) 289-410
7. S.K.A. DANSO, G. HADARSON, AND F. ZAPATA, “Assessment of dinitrogen fixation of forage legume with 15N technique, In: Potential of legume in Farming System in Sub-Saharan Africa (Eds. Haque, I., Jutzi, S, and Neafe, P.H.), Addis Ababa, International Livestock Center for Africa (ILCA) (1986) 26-57
9. R.J. RENNIE, D.A.Y. RENNIE, “Technique for quantifying N2 fixation in association with non-legume, under field and greenhouse conditions” Can. J. Microbial 29; (1981) 1022-1035
10. S.K.A. DANSO, F. ZAPATA, G.D. BOWEN and N. SANGINGA, “Application of 15N methods for measuring nitrogen fixation in trees, In; Stable Isotope in Plant Nutrition, Soil Fertility and Environmental Studies”, Proceedings of a Symposium, Vienna 1-5 October 1990, Jointly Organized by IAEA-FAO, International Atomic Energy Agency (1991) 155-168
11. G. HADARSON, S.K.A. DANSO and F. ZAPATA, “ Dinitrogen fixation measurement in alfa-ryegrass sward using nitrogen 15 and influence of the reference crop”, Crop. Sci. 28 (1988) 101-105
Table 1. Dry weight, %total-N Uptake, of roots, system + leaves, plants, and number of nodules at transplanting.
Roots Leaves
+Stem
Plant Number Of
nodules F1 a. dw (g)
b. %to-n c. To-N Uptake (mg N-Plant)
Table 2. Fresh Weight (FW), and Dry Weight (DW) of plant parts and plants of various legume and reference trees at harvest.
Roots Stem Branches Leaves Plant
Tre es
FW DW FW DW FW DW FW DW FW DW
……….. g/tree ………. F1 F2 F3 F4 F5 F6 R1 R2 R3 LSD 5% 1% CV (%) 1021 704 356 116 64 477 158 16 429 322 436 59.6 339 257 156 45 21 205 65 6 43 112 152 61.0 1575 2713 1925 613 400 2263 1075 63 1750 880 1192 43.5 557 1149 769 258 155 879 403 28 115 350 474 50.0 947 1793 1448 384 279 1255 528 -- -- 442 606 31.4 247 624 417 107 78 425 224 -- -- 161 221 34.2 2011 1511 2051 448 821 1493 766 112 1131 594 805 35.4 438 3807 664 86 175 371 241 36 149 156 212 39.0 5548 6720 5780 1560 1564 5150 2528 200 3310 2032 2754 38.7 1581 2338 2106 496 430 1881 934 70 307 656 889 39.8
Notes : each values is an average of 4 replicates FW : Fresh Weight
W : Dry Weight
Height of the tree range from 0.8 – 2.5 m
Table 3. Total-N percentage (%to-N) of plant parts base on dry of various legume and reference trees at harvest.
Trees Roots Stems Branches Leaves ………. %to-N ………
[image:11.595.71.365.380.537.2]Table 4. Total-N uptake of plant parts and plants of various legume and reference trees at harvest.
Trees Roots Stems Branches Leaves
……….... gN/tree ……… F1 F2 F3 F4 F5 F6 3.900 2.134 1.603 0.559 0.198 2..414 3.428 4.933 4.214 1.854 0.930 5.359 2.453 6.510 6.038 1.307 0.720 4.284 12.377 12.102 21.293 2.604 5.681 14.261 22.658 25.679 33.147 6.324 7.529 25.203 R1 R2 R3 0.358 0.039 1.527 2.494 0.139 1.114 1.136 -- -- 4.586 0.561 5.724 8.575 0.739 7.365 LSD 5% 1% CV (%) 1.094 1.482 57.5 2.128 2.884 53.6 1.883 2.580 39.5 4.951 6.710 38.6 7.909 10.717 35.5
Table 5. Percentage of 15N atom excess (%a.c) and percentage devired from fertilizer (%NF) of various plants of legume trees at harvest.
Trees Roots Stems Branches Leaves
%a.e %NF %a.e %NF %a.e %NF %a.e %NF
Table 6. Dry weight (DW), total N-uptake (TN), N-fertilizer uptake (NF), N2-fixation (%N-Fix) of various legume and reference trees at harvest.
Legume trees
Plant DW
(g)
TN
(gN/tree)
N-Fert
(gN/tree)
N-Fix
(gN/Tree)
%N-Fix
F1 F2 F3 F4 F5 F6 R1 R2 R3
LSD 5% 1% CV (%)
1581 2338 2106 496 430 1881
934 70 307
656 889 39.8
22.658 25.679 33.149 6.324 7.259 25.203
8.575 0.739 7.365
7.909 10.717
35.5
1.996 2.016 2.455 0.576 0.719 1.456 1.335 0.211 1.721
0.869 0.911 34.40
11.640 14.823 19.926 3.223 3.710 17.361
-- -- --
-- -- --
52.44 57.48 59.48 51.05 52.05 70.03
-- -- --
-- -- --
Attachment
Calculation of %N-Fix and N-Fix uptake using the 15N technique for legume and reference trees :
%N-derived from fertilizer (%NF) = 100%
% %
x fertilizer of
excess atom
sample plant of excess atom
Example : %a.e. plant sample = 0.670% %a.e. fertilizer = 9.634%
%NF plant sample = 100% 20% 634
. 9
670 .
0 =
Dry weight (DW) (g)
%NT NT-uptake Gn/DW
%NF NF-uptake Gn/NT uptake
Legum tree: Roots Branches Stems Leaves Plants
Reference tree: Roots
Stems Branches Leaves plants
340 560 250 440 1590
70 410 240 240 940
1.2 0.9 1.2 2.9 --
0.7 0.6 0.5 2.0 --
4.1 5.0 3.0 12.8 24.9
0.5 2.5 1.1 4.8 8.9
9.3 7.3 8.9 9.6
16.9 15.7 18.7 20.3 --
0.38 0.37 0.27 1.23 2.25
0.11 0.39 0.21 0.98 1.69
NT uptake = %N x DW ; NF uptake = %NT uptake Legume treee %NF (plant) : 2.25/24.9 x 100% = 9.04% Reference tree %NF (plant) : 1.69/8.9 x 100% = 18.99% %N Soil Reference tree = 100% -18.99% = 81.01%
reference Nsoil
NF legume
soil N
NF
% % %
%
=
reference legume
soil
N 81.01
99 . 18 %
04 . 9
=
%N Soil legume = 9.04 38.56 %
01 . 81
= x soil N
% Fif-legume (whole plant) = 100% - 38.56% - 9.04% = 52%
F3 R3 F1 F2 F4 F5 F6 R2 F1 F5
F2 F5 F3 F5 F3 R1 F1 F6 F2 F4
R2 F3 *F5 R1 F5 R2 F3 R3* F6 F5
F3 F2 R2 F1 R2 F4 R1 F2 F1 R2
R3 F4 F4 R2 F2 R1 F4 R3 R1 F6
F4 F5 R3 F3 R2 F5 R2 F6 F4 F2
F1 R2 F2 R1 F1 R3 F6 R2 F1 F3
F5 F6 *R2 F1 R1 F6 R2 F3* F5 F2
F5 F1 F3 F6 F4 R3 F6 F2 F4 F1
F3 F4 F6 F2 F1 F3 F4 R2 F2 F6
* Isotope plot : 6 m x 6 m F : Legume tree
R. : Reference tree
Figure 1. Layout of an experimental plot ( replicate I ). 10 m