accredited by DGHE (DIKTI), Decree No: 51/Dikti/Kep/2010 331
Lung Nodule Detection in CT Images using Neuro
Fuzzy Classifier
Anam Tariq1, M. Usman Akram2
1
College of E&ME, National University of sciences & Technology, Pakistan
2
Bahria University, Islamabad, Pakistan
e-mail: [email protected], [email protected]
Abstrak
Deteksi kanker paru-paru secara atomatis dengan bantuan komputer merupakan bidang penting pada aplikasi klinis. Dengan kenyatan bahwa deteksi bintil paru-paru secara manual membutuhkan waktu yang lama disamping biayanya tinggi, maka sebuah sistem deteksi terkomputerisasi akan sangat membantu. Pada paper ini, kami menyajikan sebuah sistem deteksi bintil paru-paru pada citra hasil CT Scan secara terkomputerisasi. Sistem ini terdiri dari dua tahapan, yaitu segmantasi citra paru-paru dan peningkatan kulitas citra dilanjutkan dengan operasi ekstraksi ciri dan klasifikasi. Proses segmentasi akan menghasilkan citra jaringan paru-paru yang terpisah dari citra lainnya dan hanya citra paru-paru ini yang akan digunakan pada proses pemeriksaan adanya bintil pada paru. Vektor ciri untuk dbagian paru-paru yang tidak normal dihitung dan diklasifikasikan dengan sebuah neuro fuzzy classifier. Ini adalah sebuah sistem yang sepenuhnya otomatis sehingga tidak membutuhkan campur tangan manusia pada prosesnya, serta hasil percobaan telah menunjukkan tingkat validitas dari sistem ini.
Kata Kunci:kanker paru-paru, citra CT Images, neuro fuzzy, nodul
Abstract
Automated lung cancer detection using computer aided diagnosis (CAD) is an important area in clinical applications. As the manual nodule detection is very time consuming and costly so computerized systems can be helpful for this purpose. In this paper, we propose a computerized system for lung nodule detection in CT scan images. The automated system consists of two stages i.e. lung segmentation and enhancement, feature extraction and classification. The segmentation process will result in separating lung tissue from rest of the image, and only the lung tissues under examination are considered as candidate regions for detecting malignant nodules in lung portion. A feature vector for possible abnormal regions is calculated and regions are classified using neuro fuzzy classifier. It is a fully automatic system that does not require any manual intervention and experimental results show the validity of our system.
Keywords: lung cancer, CT Images, neuro fuzzy, nodules
1. Introduction
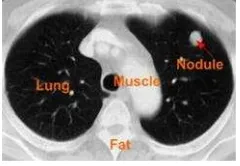
Lung cancer is the leading cause of death in the world mainly because patients with lung cancer often do not develop symptoms until the cancer is in an advanced stage [1]. Periodic screening tests of populations at risk for lung cancer could dramatically reduce the death rate [2][3]. Automated systems can be useful for this purpose and can provide and time and cost efficient solution. However, a major problem in the automated screening using Computed Tomography (CT) for lung cancer is that the desired objects to recognize in the image slices, such as nodules, blood vessels and bronchi, often have similar characteristics in terms of density, shape and size. A pulmonary nodule is defined as a round, nearly round, or oval density that is relatively sharply marginated. It is at least partially surrounded by lung, which means it can be characterized as a parenchymal process. By definition, nodules are endings of 3 cm or less. Larger spherical, well-defined opacities are referred to as masses and are far more likely to be malignant. Figure 1 shows the lung CT image and its different regions.
network based approach [2], sequential CT images [3], genetic cellular neural network and 3D template matching technique [4], mass screening with mobile spiral CT scanner [5], low dose CT scan images [6], model based detection in CT scan images [7], lung nodule classification approach in CT scan images [8], lung nodule detection using profile matching and back-propagation neural network techniques [9], accuracy of positron emission tomography for nodule detection [10], local density algorithm [11] and template matching technique on helical CT scan images [12]. These methods correctly detect the nodules in images but some are robust against noise and small nodules in an image can be detected by few and if detected then blood vessels are also detected by them along with the nodules. The evaluation of an incidental nodule to determine whether it reects malignant disease can lead to a long and costly workup. The efforts to detect early lung cancer have led to lung cancer screening with CT in at-risk populations, which is associated with the discovery of even larger numbers of nodules.
Figure 1. Lung CT scan Image
In this paper, computer-aided diagnosis (CAD) system for automated detection of pulmonary nodules in computed tomography (CT) images is proposed. The automated system consists of different phases such as lung segmentation, post processing enhancement, formulation of feature vector and neuro fuzzy based classification.
The paper is organized in five sections. In section 2 proposed model for this computerized system is explained step by step. In section 3 experimental results are discussed followed by conclusion in section 4.
2. Proposed Method
The systematic overview of the computerized system is shown in figure 2. In summary, the system takes lung CT image is as an input and applies segmentation on this image to remove background and extracts the nodules from image. The enhancement phase applies post processing to remove as many false regions as possible. The remaining candidate nodules are classified based on their properties which are extracted in feature extraction phase.
2.1 Lung CT Image Segmentation
Segmentation of an image involves the separation of lung nodule from other part of the CT scan images and then enhancement of the resultant image to get details. This process includes series of steps which are:
1. First of all CT scan image is converted to gray scale image and we apply median filter to remove any noise if present.
2. In CT image the difference between foreground and background is quite prominent and gradient operator has high values for boundary pixels. Here in this system, we have used gradient mean and variance based method for extraction of background.
3. After the background removal threshold segmentation is done on the basis of optimal thresholding. In optimal thresholding, a threshold value Ti is selected that is statistically optimal, based on the content of the image. Initially threshold value is the mean gray level and next threshold value Ti + 1 is the average of the body and non-body pixels. This procedure ends when the convergence will reach. Figure 3 shows the original image, background eliminated image and segmented image.
2.2 Post processing Enhancement
Post processing enhancement is done so that the lung image will become clearer in order to detect nodules. The series of steps evolved in enhancement after segmentation are: 1. Morphological opening is applied on threshold image for the enhancement. This operation
eliminates the small objects inside and outside the lungs.
2. Morphological closing is then applied on the image. It enhances borders and fills the gaps in the border.
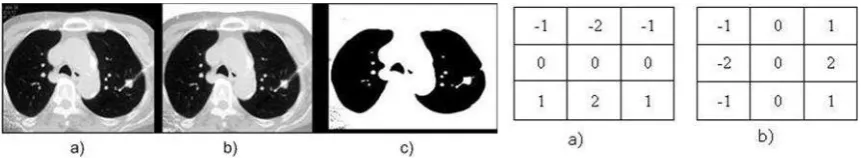
3. After Morphological operations boundary of the enhanced image is detected. Image borders, have mostly areas with high contrast. Sobel operator uses the gradient of the intensity information in both the horizontal and vertical directions, and tracking contours by following high gradient magnitudes from one neighborhood to another in the gradient direction using the masks in Figure 4.
Figure 3. Segmentation: (a). Original Image, (b). Background removed Image, (c). Threshold Image
Figure 4. Sobel Filter (a). vertical, (b). horizontal
4. Morphological thinning is then applied on the boundary extracted image.
5. After the thinning process the area of the image representing pulmonary lobes is identified. Throughout the image, the two longest border chains are chosen as pulmonary lobes. 6. Border reconstruction is applied on the above detected image by computing the Euclidian
distance d1 and minimum distance between two pixels d2. Then the ratio d2=d1 is computed: if the ratio is greater than a given threshold the two points are candidates for a possible reconstruction.
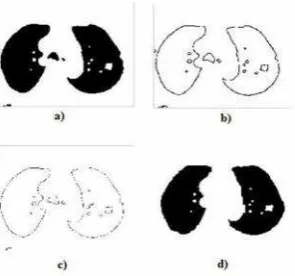
Figure 5. Post processing Enhancement: (a). Morphological Operations, (b). Border Detected Image, (c). Border Thinned Image, (d). Filled Image
2.3 Lung Nodule Feature Extraction and Classification
The most difficult step in computerized lung cancer detection system is the lung nodule detection. Actually, in CT images of lungs, firstly the lung nodules are mostly attached to blood vessels or to the pleura; secondly the grey level of blood vessels is almost similar to nodules. Hence we are considering varying features for the lung nodule detection and the feature vector which we have formulated is FV = {F1, F2, F3, F4, F5, F6}. These features are;
1. Area (F1) is a total number of pixels within a nodule. This feature helps to isolate small objects.
2. Energy (F2) is used to describe measure of information in an image and is represented in equation 1.
( ) = ( ) (1)
3. Eccentricity (F3) is a measure of circularness inside a candidate object.
4. Entropy (F4) is a statistical measure of randomness that can be used to characterize the texture of the candidate region. Entropy is defined in equation 2.
= ( × ( )) (2)
Where p contains the histogram count.
5. Mean and standard deviation (std) of gray levels within a Candidate Region (F5) and (F6), the mean intensity value indicates the average intensity value of all the pixels that belong to the same region while std is a measure of how much that gray levels differ from mean. Mean and standard deviation are calculated using equation 3 and 4 respectively.
( ) = ( ) (3)
( ) = ( ( ) ( )) (4)
3. Experimental Results
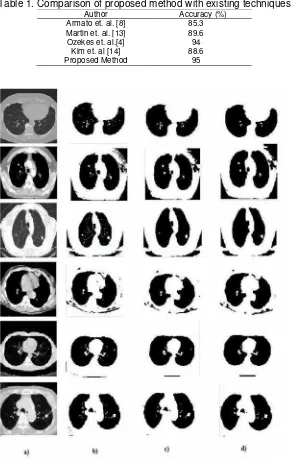
The tests of proposed technique are performed with respect to the lung nodule detection accuracy using 100 CT images of different patients. The images are of size 512x512 pixels, eight bits per color channel. In order to check the accuracy of computerized lung nodule detection system, lung nodules from all images are extracted manually by the oncologist. The manually segmented images are used as ground truth. Table 1 shows the comparison of our technique with previously proposed techniques. Figure 6 shows the experimental results for different lung CT images. It shows that proposed method have extracted the lung nodules accurately. Figure 3. ROC curves for STARE and DRIVE databases for proposed method Figure 4, 5 and 6 illustrates the blood vessel segmentation results for proposed method for DRIVE, STARE and DIARETDB1 databases respectively. Figure 7 shows a comparison for blood vessel segmentation between Hoover et al. [28] technique and the proposed method. It is clear from this section that proposed system has outperformed already published methods.
Table 1. Comparison of proposed method with existing techniques
Author Accuracy (%)
Armato et. al. [8] 85.3
Martin et. al. [13] 89.6
Ozekes et. al.[4] 94
Kim et. al [14] 88.6
Proposed Method 95
4. Conclusion
In this paper, lung segmentation is done and lung nodules are detected by using the neuro fuzzy based classifier. The system removes background region from foreground and then extracts possible regions with nodules by applying post processing phase. A detailed feature set containing different properties along with hybrid neuro fuzzy classifier has successfully detected. Experimental results have shown that this system is accurate and effective which also facilitates the detection of small nodules along with the developed one which lead to early diagnosis of lung cancer.
References
[1] MN Gurcan, B Sahiner, N Petrick, HP Chan, EA Kazerooni, PN Cascade, L Hadjiiski. Lung nodule detection on thoracic computed tomography images: Preliminary evaluation of a computer aided diagnosis system. Proceedings of Medical Physics. 2002; 29(11): 2552-2558.
[2] MG Nedo, MJ Carreira, A Mosquera, D Cabello. Computer Aided Diagnosis: A neural-network-based approach to lung nodule detection.IEEE Transactions on Medical Imaging. 1998; 17(6): 872-880. [3] H Hong, J Lee, Y Yim.Automatic lung nodiule matching on sequential CT scan images. Proceddings
of Computers in biology and medicine. 2008; 38(5): 623- 634.
[4] S Ozekes, O Osman, ON Ucan. Nodule detection in lungs region that’s segmented using genetic cellular neural networks and 3D template matching with fuzzy rule based thresholding. 2008; 9(1): 1-9. [5] S Sone, S Takashima, F Li, Z Yang, T Honda, Y Maruyama, M Hasegawa, T Yamanda, K Kubo, K Hanamura, K Asakura. Mass screening for lung cancer with mobile spiral computed tomography scanner,The Lancet. 1998; 351: 1242-1245.
[6] T Nawa, T Nakagawa, S Kusano, Y Kawasaki, Y Sugawara, H Nakata. Lung cancer screening using low-dose spiral CT: results of baseline and 1-year follow-up studies.Chest. 2002; 122(1): 15-20. [7] CC McCulloch, R A Kaucic, PR Mendona, DJ Walter, RS Avila. Model-based detection of lung
nodules in computed tomography exams: Thoracic computer-aided diagnosis.Journal of Academic Radiology. 2004; 11(3): 258-66.
[8] SG Armato, M B Altman, J Wilkie, S Sone, F Li, K Doi, A S Roy. Automated lung nodule classification following automated nodule detection on CT: A serial approach. Med. Physics. 2003; 30(6):1188-1197.
[9] SC Lo, Freedman, JS Lin, SK Mun. Automatic lung nodule detection using pro_le matching and back-propagation neural network techniques.Digital Imaging, SpringerLink. 1993; 6(1): 48-54.
[10] M K Gould, C C Maclean, W G Kuschner, C E Rydzak, D K Owens. Accuracy of Positron Emission Tomography for Diagnosis of Pulmonary Nodules and Mass Lesions: A Meta-analysis.JAMA, 2001; 285(7): 914-924.
[11] B Zhao, G Gamsu, M S Ginsberg, L Jiang, L H Schwartz. Automatic detection of small lung nodules on CT utilizing a local density maximum algorithm.Journal of Applied Clinical Medical Physics. 2003; 4(3): 248-260.
[12] Y Lee, T Hara, H Fujita, S Itoh, T Ishigaki. Automated detection of pulmonary nodules in helical CT images based on an improved template-matching technique. IEEE Trans Med Imaging. 2001; 20: 595-604.
[13] M Dolejsi, J Kybic. Automatic two-step detection of pulmonary nodules. Proceedings of SPIE, ser. Medical Imaging 2007: Computer-Aided Diagnosis. 2007; 6514: 3j-1-3j-12.