EFFECTS OF TEMPERATURE CHANGE ON
ACTIVITY AND SURVIVAL OF SELECTED
TROPICAL OPHIUROIDEA (
Ophiomastix annulosa
,
Ophiarachna incrassata
,
Ophiocoma
cf.
dentata
)
AND ASTEROIDEA (
Fromia milleporella
)
DIAN RESPATI WIDIANARI
GRADUATE SCHOOL
BOGOR AGRICULTURAL UNIVERSITY
BOGOR
ISSUES RELATED TO THIS THESIS AND THE SOURCE OF
INFORMATION
With this I declare that this thesis with title “Effects of Temperature Change on Activity and Survival of Selected Tropical Ophiuroidea (Ophiomastix annulosa, Ophiarachna incrassata, Ophiocoma cf. dentata) and Asteroidea (Fromia milleporella)” is my own work under the direction of an advisory committee. It has not yet been presented in any form to any Education institution. The sources of information which is published or not yet published by other researchers have been mentioned and listed in the references of this thesis.
Bogor, February 2012
ABSTRAK
DIAN RESPATI WIDIANARI. Efek Perubahan Suhu Pada Aktifitas dan Ketahanan Hidup Ophiuroidea Tropis (Ophiomastix annulosa, Ophiarachna incrassata, Ophiocoma cf. dentata) dan Asteroidea Tropis (Fromia milleporella) yang Dipilih. Dibimbing oleh NEVIATY PUTRI ZAMANI dan KAREN VON JUTERZENKA
Seperti yang kita ketahui bahwa pemanasan global dan perubahan iklim terjadi pada 30 tahun terakhir hal tersebut ikut mengubah suhu di udara dan perairan laut. Organisme di seluruh area, khususnya organisme laut, merupakan hewan yang sensitif terhadap perubahan suhu. Mereka mempunyai kapasitas tertentu untuk menyesuaikan diri dengan perubahan lingkungan. Jika organisme ini tidak mampu beradaptasi dengan perubahan lingkungan, mereka bisa mati. Faktor stres utama yang digunakan pada penelitian adalah suhu, dan salinitas sebagai stres lainnya untuk perbandingan. Dengan menggunakan Echinodermata tropis yang dipilih, kapasitas suhu dan salinitas dari organisme ini diujikan melalui simulasi perubahan lingkungan di laboratorium. Tujuan dari penelitian ini adalah untuk mengidentifikasi batasan suhu (dibandingkan dengan batas bawah salinitas), aktifitas, dan memperkirakan dampak dari stres suhu dan salinitas pada Ophiuroidea tropis (Ophiomastix annulosa, Ophiarachna incrassata, Ophiocoma cf. dentata) dan Asteroidea tropis (Fromia milleporella). Kecepatan perubahan (meningkat atau menurun) suhu mungkin akan mempengaruhi tingkat ketahanan hidup organisme tersebut. Perbedaan kecepatan perubahan suhu (setiap jam dan setiap hari) diteliti untuk melihat apakah ada perbedaan batas suhu dimana organisme tersebut dapat hidup (kapasitas dan adaptasi) dan efeknya pada organisme tersebut (Ophiuroidea.dan Asteroidea). Penelitian ini dilaksanakan di “Marine Habitat Lab”, Fakultas Perikanan dan Ilmu Kelautan, Institut Pertanian Bogor; mulai bulan Desember 2010 sampai November 2011. Batas atas suhu (peningkatan setiap jam) untuk spesies Ophiomastix annulosa, Ophiarachna incrassata, Ophiocoma cf. dentata, dan Fromia milleporella adalah 36,5 0C and 37,0 0C, 37,2 0C, 40,5 0C, dan 35,8 0
C dan 35,0 0C (secara berurutan). Batas atas suhu (peningkatan setiap hari) untuk spesies Ophiomastix annulosa, Ophiarachna incrassata, dan Fromia milleporella adalah 35,0 0C, 34,0 0C, dan 33,0 0C (secara berurutan). Batas bawah suhu (penurunan setiap jam) untuk spesies Ophiomastix annulosa adalah 12,8 0C. Batas bawah salinitas (penurunan setiap jam) untuk spesies Ophiomastix annulosa dan Ophiocoma cf. dentata adalah 20.5 and 13 (secara berurutan). Jendela suhu (percobaan setiap jam) dari spesies ini adalah antara 12,8-37 0C. Dari hasil tersebut, dapat disumsikan bahwa spesies Ophiuroidea dan Asteroidea lebih dapat menyesuaikan diri dan bertahan hidup pada perubahan lingkungan yang cepat daripada pada perubahan lingkungan yang lambat; selama oksigen tersedia dalam jumlah yang cukup.
ABSTRACT
DIAN RESPATI WIDIANARI. Effects of Temperature Change on Activity and Survival of Selected Tropical Ophiuroidea (Ophiomastix annulosa, Ophiarachna incrassata, Ophiocoma cf. dentata) and Asteroidea (Fromia milleporella). Under direction of NEVIATY PUTRI ZAMANI and KAREN VON JUTERZENKA
It is widely accepted that global warming and climate change are have occured over the past 30 years and it changed the temperature in the air and in marine waters. Organisms in all areas, in this case in marine, are quite sensitive to temperature changes. They have a certain capacity to cope with the changing environment. If these organisms cannot adapt to environmental changes, they could die. The main stress factor that was being used in this research is temperature, and salinity as another stressor for comparison. Using selected tropical Echinoderms, the thermal and salinity capacity of these organisms was tested through simulation of environmental changes in lab. The objectives of this study are to identify the temperature limit (in comparison to lower salinity limit), activity, and assess the impact of temperature and salinity stress for selected tropical Ophiuroidea (Ophiomastix annulosa, Ophiarachna incrassata, Ophiocoma cf. dentata) and Asteroidea (Fromia milleporella). The velocity of changes (increase or decrease) in temperature might also affect the survival of the organisms. Different velocities (hourly and daily)of temperature change were investigated to see if there was any difference in temperature limit (the organisms’ capacity and adaptation) and the effects to these organisms (Ophiuroidea and Asteroidea). This experiment was conducted in Marine Habitat Lab, Faculty of Fisheries and Marine Sciences, Bogor Agricultural University (IPB); from December 2010-November 2011. The upper thermal limit (hourly increase) for Ophiomastix annulosa, Ophiarachna incrassata, Ophiocoma cf. dentata, and Fromia milleporella was 36.5 0C and 37 0C, 37.2 0C, 40.5 0C, and 35.8 0C and 35.0 0C (respectively). The upper thermal limit (daily increase) for Ophiomastix annulosa, Ophiarachna incrassata, and Fromia milleporella was 35.0 0C, 34.0 0C, and 33.0 0C (respectively). The lower thermal limit (hourly decrease) for Ophiomastix annulosa was 12.8 0C. Lower salinity limit (hourly decrease) for Ophiomastix annulosa and Ophiocoma cf. dentata was 20.5 and 13 (respectively). The thermal window for Ophiomastix annulosa (hourly experiment) was between 12.8-37.0 0C. From the result, it can be assumed that these ophiuroids and asteroids species can acclimatize and survive to more rapid changing environment than slow changing environment; as long as the oxygen is available in sufficient amount.
SUMMARY
DIAN RESPATI WIDIANARI. Effects Of Temperature Change On Activity and Survival of Selected Tropical Subtidal Ophiuroidea (Ophiomastix annulosa, Ophiarachna incrassata, Ophiocoma cf. dentata) and Asteroidea (Fromia milleporella). Under direction of NEVIATY PUTRI ZAMANI and KAREN VON JUTERZENKA.
It is widely known and accepted that global warming and climate change has happened during the last decades. One aspect that affected by global warming and climate change is temperature rise (warming) because of raised CO2 levels. This changing of temperature and climate, also affects the marine environment, where the temperature of seawater is rising. When this happens it could cause problems to marine organisms because the ability of each marine species or organisms to resist environmental change is different and geographically uneven. In order to assess the effects to marine organisms, we need to have collaborative research. The present study is conducted as part of a collaboration with British Antarctic Survey (BAS), for latitudinal comparison of marine invertebrates. Based on previous research, sea temperature in polar and tropic usually vary over 1-3 0C annually and tropical and polar ectotherms organisms showed similar sensitivity to temperature change.
Tropical areas, especially Indonesia, show very high biodiversity both in terrestrial and marine environment. Echinoderms species are found in all marine areas at all latitude. They live from intertidal to abyssal zones and from polar to tropics, so that it could fit in the frame project of British Antarctic Survey (BAS). There are many Echinoderms species in tropical marine environment. Echinoderms are spiny marine organisms, which consist of class Asteroidea, Echinoidea, Ophiuroidea, Holothuroidea, Crinoidea, and Concentricycloidea. Echinoderms in nature can act as scavenger, deposit feeder, suspension feeder, or predator.
This research will use selected tropical Ophiuroidea (Ophiomastix annulosa, Ophiarachna incrassata) from subtidal and ophiuroids from intertidal (Ophiocoma cf. dentata) and asteroids (Fromia milleporella) which live in subtidal areas and can be kept in the lab during acclimation periods and experiments. Subtidal environments are more stable area than intertidal areas in terms of condition and these ophiuroids and asteroids are possible to keep in the lab. The survival rate of the organisms in the lab or in environment depend on their sensitivity and ability to adapt with changing condition of the environment or new environment. The reason for choosing subtidal species is because in general, intertidal species are “tougher” (more tolerance) than subtidal species because intertidal species have to deal with a constantly changing environment. So, intertidal species are less suitable for this experiment and within the project‟s frame, but can still be use as comparison.
might also affect the survival of the organisms. Different velocities (hourly and daily) in temperature change were investigated to see if there was any difference
in temperature limit (the organisms‟ capacity and adaptation) and the effects to
these organisms (Ophiuroidea and Asteroidea).
This research was conducted in Marine Habitat Lab, Faculty of Fisheries and Marine Sciences, Bogor Agricultural University (FPIK-IPB) between December 2010-November 2011. The organisms and materials used were the organisms (selected tropical Ophiuroidea (Ophiomastix annulosa, Ophiarachna incrassata, Ophiocoma cf. dentata) and Asteroidea (Fromia milleporella)), seawater (from Teluk Jakarta and filtered in Gelanggang Samudera, Ancol, Jakarta), freshwater, data sheets, thermometer (alcohol and digital thermometer), refractometer, thermocycler with jacket tank (special designed by British Antarctic Survey (BAS)), fresh shrimps (as food), digital balance, caliper, camera, adjustable water heater, water filter, ammonia strips, pH strips, nitrite and nitrate strips.
To select the organisms, a trial was done with several selected tropical Echinoderms species from class Ophiuroidea, Asteroidea, Echinoidea, and Holothuroidea. The organisms were recieved from CV. Dinar and acclimated after arriving in the lab for about 5-10 days. The size of the organisms should be suitable to be put into the thermocycler (inner tank size 75 x 40 x 32 cm) and control tank (size 75 x 40 x 41 cm). The size of ophiuroids, it could be up to 5 cm for central disk diameter; asteroids, could be up to 10 cm in diameter; holothuroids, the length could be up to 10 cm (live specimen, measure underwater); echinoids, the disc diameter could be up to 3 cm (measuring method based on Peck et al., 2009a). The number of the organisms was between 3-20 organisms for each species. From the acclimation phase, the organisms that proved to be strong enough (low mortality, normal behavior) to be kept in the lab were organisms from class Ophiuroidea and Asteroidea. The number of the organisms that was being observed in these experiments were between 10-20 organisms for each species (total of organisms in experiment and control). Test of feeding and handling the organisms was done in this phase.
Species verification (identification) was done with frozen samples, since it was impossible to do identification with live specimens. Species identification was done to ensure that the species name was correct based on given information from CV. Dinar. Species were identified using stereomicroscope and identification key by Clark and Rowe (1971).
A pilot study was performed before the main experiment was conducted. The pilot study tested the response parameters (e.g. righting or turning response, activity), to determine how to measure when organisms were not responding anymore (for ophiuroids, the turning response; and for the asteroids, attachment capability and turning response) (Peck et.al., 2008; Peck et al., 2009a; Peck et al., 2009b). From the pilot study we tried to turn the organisms when they looked weak and were not attach to the tank wall (already at bottom of experimental tank). During upper thermal limit experiments, the ophiuroids loosened their arms and were weak; the asteroids lost their attachment capability. During lower thermal limit and salinity limit experiments, the ophiuroids curled their arms and became stiff (pers. obs.).
and asteroids) not responding anymore was the turning or righting response (Peck et.al., 2008). The wet weight and size (central disk size of ophiuroids and diameter of asteroids) of all the organisms was measured (from experiment and control) (Peck et al., 2009a). Repeat experiments verified that the upper thermal limit of these organisms were more or less at the same temperature limit and also to verify that the setting of this experiment was right. The repetition experiment was conducted to verify the first experiment or because the number of individuals was not enough in the first experiment.
The annual temperature in tropic is between 27-29 0C in surface layer (upper 10 m) (Stewart, 2008). The annual temperature in Antarctic (polar) seawater is between -1.8 0C and +1.8 0C (Peck et al., 2009b).The upper thermal limit (hourly increase) for Ophiomastix annulosa, Ophiarachna incrassata, Ophiocoma cf. dentata, and Fromia milleporella was 36.5 0C and 37 0C, 37.2 0C, 40.5 0C, and 35.8 0C and 35.0 0C (respectively). The upper thermal limit (daily increase) for Ophiomastix annulosa, Ophiarachna incrassata, and Fromia milleporella was 35.0 0C, 34.0 0C, and 33.0 0C (respectively). The lower thermal limit (hourly decrease) for Ophiomastix annulosa was 12.8 0C. Lower salinity limit (hourly decrease) for Ophiomastix annulosa and Ophiocoma cf. dentata was 20.5 and 13. The thermal window for Ophiomastix annulosa (hourly experiment) was between 12.8-37.0 0C. At the end of (a) upper thermal limit experiment (hourly
increase), the ophiuroid‟s arms were straight and loose; and the asteroids lost
their attachment capability; (b) upper thermal limit experiment (daily increase), the ophiuroids showed wounded discs, autotomy, and some of them were dead; the asteroids were showed white spot or wounded arm tips then died; (c) lower thermal limit experiments (hourly decrease) and lower salinity limits (hourly
Copyright © 2012 Bogor Agricultural University
Copyright is Protected by Law
It is a prohibited to cite all or part of this thesis without referring to and mentioning the source. Citation only permitted for the sake of education, research, scientific writing, report writing, critical writing, or reviewing scientific problem. Citation
doesn’t inflict the name and honor of Bogor Agricultural University.
EFFECTS OF TEMPERATURE CHANGE ON
ACTIVITY AND SURVIVAL OF SELECTED
TROPICAL OPHIUROIDEA (
Ophiomastix annulosa
,
Ophiarachna incrassata
,
Ophiocoma
cf.
dentata
)
AND ASTEROIDEA (
Fromia milleporella
)
DIAN RESPATI WIDIANARI
Thesis
as one of the requirements for achieving Master of Science degree in
Marine Science Program
GRADUATE SCHOOL
BOGOR AGRICULTURAL UNIVERSITY
BOGOR
Outside Committee Examiner on Thesis Examination:
Title : Effect of temperature change on activity and survival of selected tropical Ophiuroidea (Ophiarachna incrassata, Ophiomastix annulosa, Ophiocoma cf. dentata) and Asteroidea (Fromia milleporella)
Name : Dian Repati Widianari
NIM : C551090181
Approved by
Advisory Commiteee
Dr. Ir. Neviaty P. Zamani, M.Sc. (Head)
Dr. Karen von Juterzenka (Member)
Known by
Head of Marine Science Program
Dr. Ir. Neviaty P. Zamani, M.Sc.
Dean of Graduate School
Dr. Ir. Dahrul Syah, M.Sc.Agr.
Date of Examination:
January 17th 2012
Date of Graduation:
PREFACE
The ocean is occupying 70% of the earth „s surface. There are still lots of
mystery underwater that could be or need to be revealed one day by the scientist. Based on many journals, books, and studies, many scientists said that the global climate change is happening during the last decades. And it affects the entire world including the live organisms that live on earth (terrestrial and marine). The air, terrestrial, and marine area are connected to each other. Each of them try to keep adjusting to each other to make everything as balance as possible if something happen (e.g. global climate change or global warming). But there
might be something “gone and replace” if the imbalance happen for long duration.
For example, the animals from tropics move to higher latitude if the temperature in tropics is getting higher. The problem is what will happen to the polar animals. Where will they go?
Focus of this thesis is to identify some of the tropic marine species temperature limit and identify whether there is any difference in temperature limit if the temperature changing rapidly or in a slower rate in nature. As the result, the author hope that this study could give a glimpse of what will happen if the global climate change happen for the next years.
Hope thesis could be useful to give some pictures to keep our world a better place; and many parties and scientists could give positive advice and suggestions this imperfect thesis.
Bogor, February 2012
ACKNOWLEDGEMENT
The author want to say thank you to all the parties who supports and help, so that this research and thesis can be done.
1. Parents (Djarot Soedarsono and Sri Ulfah Hartati) and all the family who patiently supports, inspires, motivate, help, and pray for keep reminding to do the best, on time, always learn, humble, and work hard and smart for the better and the best to reach the goals.
2. Dr. Ir. Neviaty Putri Zamani, M.Sc. as the head of advisory committee and head of Marine Science Program who patiently give support, advice, help, and time through finishing of this thesis.
3. Dr. Karen Von Juterzenka as member of advisory committee who gave a lot of support, help, time, advice, new experience (for me), and share knowledge and fun through finishing of this thesis.
4. Dr. Simon Anthony Morley as project coordinator from British Antarctic Survey (BAS) who gave the opportunity to join their project and broaden my knowledge, experience, and network.
5.
Prof. Lloyd S. Peck
and
Dr. Melody S. Clark
as project funding from
British Antarctic Survey (BAS) that makes this project works.
6. Prof. Dr. Ir. Dedi Soedharma, DEA as outside examiner committee who help a lot giving advise thoroughly through this thesis so that this thesis can be better.
7. Dr. Ir. Etty Riani, M.Si. as seminar moderator and examiner who give time in supporting and positive comment during the seminar.
8. Friends in Marine Science Program class 2009 Bogor Agricultural University (Pak Johanis Lekalete, Bang Lumban Nauli Lumban Toruan, Pak Kapten Khoirol Iman Fatoni, Pak Ahmad Zamroni, Mbak Emmy Syafitri, Kaharudin, Mbak Anna Ida Sunaryo Purwiyanto (for all the listening, help, and many moments together), Yuliana Fitri Syamsuni (my running-mate), Heidi Retnoningtyas, Citra Satrya Utama Dewi, Yulianto Suteja, Mardiansyah (Yayan), Muhammad Reza Cordova (younger brother), Maria Ulfah (for all the logistic things you help to provide it), Muliari (Ayi), Wahyu Ai‟din Hidayat)
Bang Ramadian Bachtiar, Caroline Wendling, Mereike Huhn, Nurina Ayu, Rebecca Mueller, Giannina Hattich, Titan, Andhita Triwahyuni, Shelly Tutupoho, Dwito Indrawan, Olivier Yonathan, Fitriah Anggraeni, Fadilah Rahmawati (for helping and accompanying study and do the assignments)) thank you for all the good times, laugh, advise, critics, info, support, and help during we study together.
10. Yasser Ahmed and family, thank you for all the pray, help, time, support, energy, spirit, nice discussion you gave to help finishing this thesis and so many other things in life.
11. Dondy Arafat, thank you for helping in providing seawater to the lab.
12. CV. Dinar (Pak Dody, Mbak Desyi, Pak Ngurah, and all the crews), thank you for helping in providing marine organisms, some info about it, and handling marine organisms.
BIOGRAPHY
The author was born in Jakarta on December 8th 1983 as a single daughter from Djarot Soedarsono and Sri Ulfah Hartati. The elementary school was finished in Kuntum Wijaya Kusuma Elementary School, Jakarta, in 1995. Then the author continued to 102 Public Junior High School, Jakarta, and finished in 1998. The high school was finished in 2001 in Gonzaga College High School, Jakarta. After that, the author continued her study in Diponegoro University, Semarang, Central Java, from August 2001 until December 2006; and
do research titled “Pengaruh Keberadaan Substrat dan Ukuran Biota yang Berbeda Terhadap Konsumsi Oksigen Bintang Laut Protoreaster nodosus”. On March to June 2009, the author joined Marine Science and Technology (MST) training course held by Deutch Academischer Austauschdienst (DAAD) and Bogor Agricultural University (IPB) in Bogor Agricultural University (IPB). Then the author registered as Master degree student in Bogor Agricultural University (IPB) on August 2009.
During did and finishing the Master, the author was selected as project assistant in Thermal Limit Project by British Antarctic Survey (BAS). With this project the author, learn how to do research about thermal limit of marine organisms, using new equipments, and attending Association for Tropical Biology and Conservation (ATBC) conference in Bali on July 2010. To finish her Master
degree study, the author do a research and writing thesis titled “Effect of
xxv
CONTENTS
Page
LIST OF TABLES ... xxvii
LIST OF FIGURES ... xxix
LIST OF APPENDICES ... xxxiii
1. INTRODUCTION ... 1 1.1. Background ... 1 1.2. Hypothesis ... 2 1.3. Objectives ... 2
2. LITERATURE REVIEW ... 3 2.1. Climate Change and Variation ... 3 2.2. Role of Temperature and Salinity ... 4 2.3. Intertidal ... 5 2.4. Subtidal ... 5 2.5. Echinoderm ... 6 2.5.1. Ophiuroidea ... 6 2.5.1.1. Ophiomastix annulosa ... 6 2.5.1.2. Ophiarachna incrassata ... 8 2.5.1.3. Ophiocoma dentata ... 9 2.5.2. Asteroidea: Fromia milleporella ... 10
xxvi
3.3.8. Salinity stress experiment ... 20 3.3.8.1. General setup ... 20 3.3.8.2. Pilot study ... 21 3.3.8.3. Performance and control ... 22
4. RESULTS AND DISCUSSION ... 25 4.1. Results ... 25 4.1.1. Species verification ... 25 4.1.2. Thermal limit and salinity stress experiment... 25 4.1.2.1. Upper thermal limit (hourly increase) ... 26 4.1.2.1.1. Ophiomastix annulosa (red ophiuroid) ... 26 4.1.2.1.2. Ophiarachna incrassata (green ophiuroid) ... 30 4.1.2.1.3. Ophiocoma cf.dentata (black Ophiuroid) ... 32 4.1.2.1.4. Fromia milleporella (red starfish) ... 35 4.1.2.2. Upper thermal limit (daily increase) ... 38 4.1.2.2.1. Ophiomastix annulosa (red ophiuroid) ... 38 4.1.2.2.2. Ophiarachna incrassata (green Ophiuroids) ... 40 4.1.2.3. Lower thermal limit (hourly decrease) ... 44 4.1.2.4. Lower salinity limit (hourly decrease) ... 46 4.1.2.4.1. Ophiomastix annulosa (red opiuroids) ... 46 4.1.2.4.2. Ophiocoma cf.dentata (black ophiuroids) ... 50 4.2. Discussion ... 53 4.2.1. Thermal limit ... 53 4.2.2. Rate of changing temperature ... 54 4.2.3. Thermal window ... 58 4.2.4. Lower salinity limit (hourly decrease) ... 58 4.2.5. Condition of the organisms ... 59
5. SUMMARY AND SUGGESTION ... 65 5.1. Summary ... 65 5.2. Suggestion ... 65
REFERENCES ... 67
xxvii
LIST OF TABLES
Page 1. Materials that were used in this study. ... 13
2. Temperature and salinity limit of selected tropical Ophiuroidea (Ophiomastix annulosa, Ophiarachna incrassata, Ophiocoma cf.dentata) and Asteroidea (Fromia milleporella) ... 25
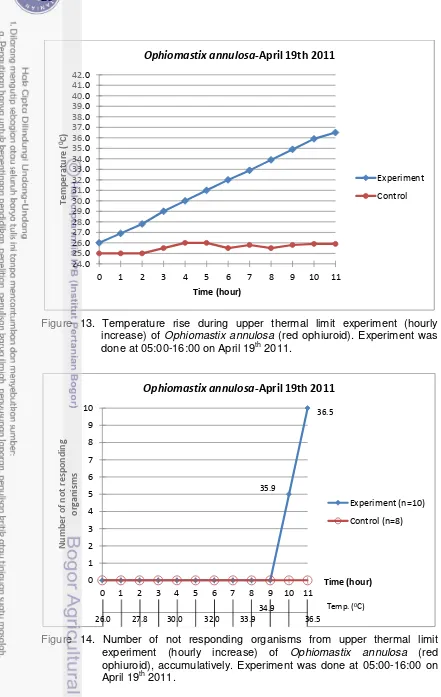
3. Data of upper thermal limit experiment (hourly increase) of Ophiomastix annulosa (red ophiuroid). Experiment was done at 05:00-16:00 on April 19th 2011. ... 27
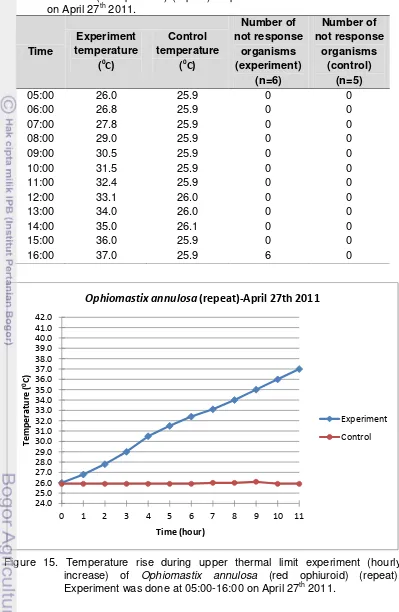
4. Data of upper thermal limit experiment (hourly increase) of Ophiomastix annulosa (red ophiuroid) (repeat). Experiment was done at 05:00-16:00 on April 27th 2011. ... 29
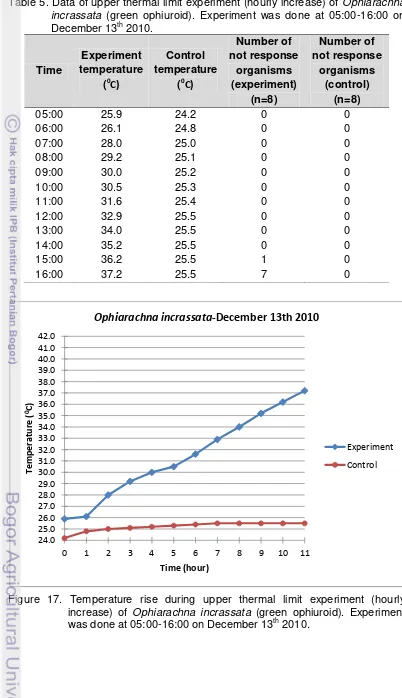
5. Data of upper thermal limit experiment (hourly increase) of Ophiarachna incrassata (green ophiuroid). Experiment was done at 05:00-16:00 on
December 13th 2010. ... 31
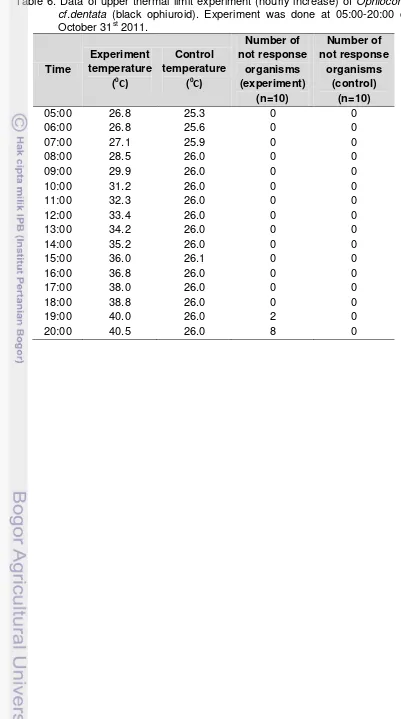
6. Data of upper thermal limit experiment (hourly increase) of Ophiocoma
cf.dentata (black ophiuroid). Experiment was done at 05:00-20:00 on October 31st 2011. ... 33
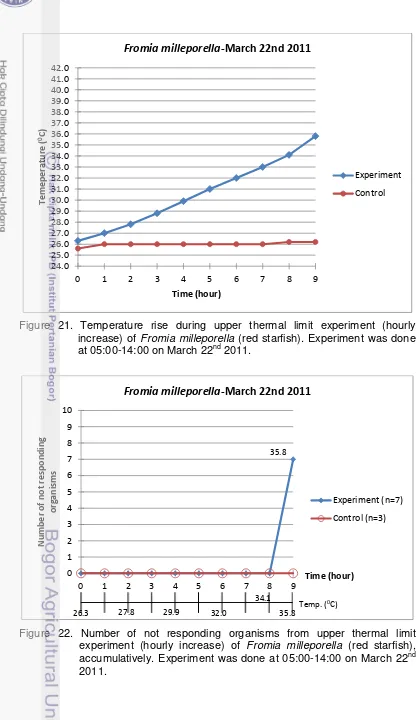
7. Data of upper thermal limit experiment (hourly increase) of Fromia milleporella (red starfish). Experiment was done at 05:00-14:00 on March 22nd 2011. .... 35
8. Data of upper thermal limit experiment (hourly increase) of Fromia milleporella (red starfish) (repeat). Experiment was done at 05:00-14:00 on May 4th 2011. ... 37
9. Data of upper thermal limit experiment (daily increase) of Ophiomastix
annulosa (red ophiuroid). Experiment was done on July 13th-22nd 2011. ... 39
10. Data of upper thermal limit experiment (daily increase) of Ophiarachna incrassata (green ophiuroid). Experiment was done on December 14th-22nd 2010. ... 41
11. Data of upper thermal limit experiment (daily increase) of Fromia milleporella (Red Starfish). Experiment was done on May 6th-12th 2011. ... 43
12. Data of lower thermal limit experiment (hourly decrease) of Ophiomastix annulosa (red ophiuroid). Experiment was done at 06:00-20:00 on September 22nd 2011. ... 45
13. Data of lower salinity limit experiment (hourly decrease) of Ophiomastix annulosa (Red Opiuroids). Experiment was done at 05:00-21:00 on
November 8th 2011. ... 47
xxviii
15. Data of thermal limit from other tropic species (Morley, Widianari, Juterzenka unpubl. and prep.). ... 54
xxix
LIST OF FIGURES
Page 1. Mean global temperature, 1886-1994 (Castro and Huber, 2007). ... 3 2. Mean global temperature relative to 1961-1990. Recent thermometer
measurements and past temperatures estimated from tree rings, ice cores, corals, and historical records. The light brown shading indicates the range of uncertainty. Even with this uncertainty, 1998 was the warmest year in a millennium (Castro and Huber, 2007). ... 4
3. The major subdivisions of the marine environment are based on distance from land, water depth, and whether the organisms are benthic or pelagic.
Description of subtidal zone (pink color) (modified from Castro and Huber, 2007). ... 5
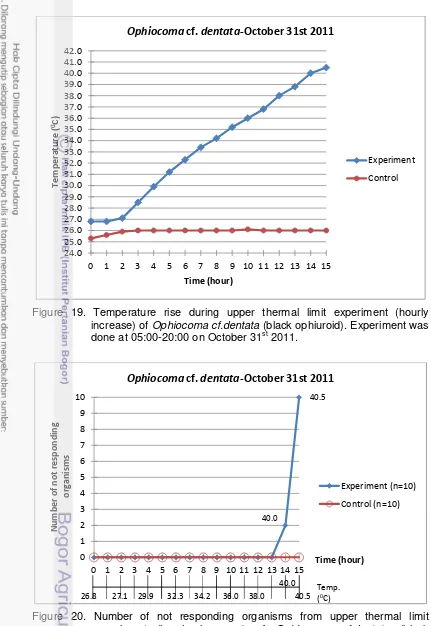
4. Picture of Ophiomastix annulosa (A: [7]; B: [3]; C: [1]). ... 7
5. Picture of Ophiarachna incrassata (A: [9]; B: [2]). ... 8
6. Picture of Ophiocoma dentata (A, B: [4]). ... 10
7. Eye spot dan tentacles on the arm tip of a starfish, Protoreaster nodosus (Pisano, 2004). ... 11
8. Picture of Fromia milleporella ([6]). ... 11
9. Methodology scheme. ... 16
10. Design of thermocycler tank for temperature limit experiment. ... 19
11. Condition in salinity decrease experiment tank. The ruler is attach to the wall inside the experiment tank. ... 21
12. Sketch of waterflow during trial with milk. Fixed line shows the surface
current; dashed line shows the bottom current; point 1-7 are the points where milk was dropped. The slowest current among 7 points was at point 3. The other points (point 1, 2, 4, 5, 6, 7) are faster than point 3... 22
13. Temperature rise during upper thermal limit experiment (hourly increase) of Ophiomastix annulosa (red ophiuroid). Experiment was done at 05:00-16:00 on April 19th 2011. ... 28
14. Number of not responding organisms from upper thermal limit experiment (hourly increase) of Ophiomastix annulosa (red ophiuroid), accumulatively. Experiment was done at 05:00-16:00 on April 19th 2011. ... 28
xxx
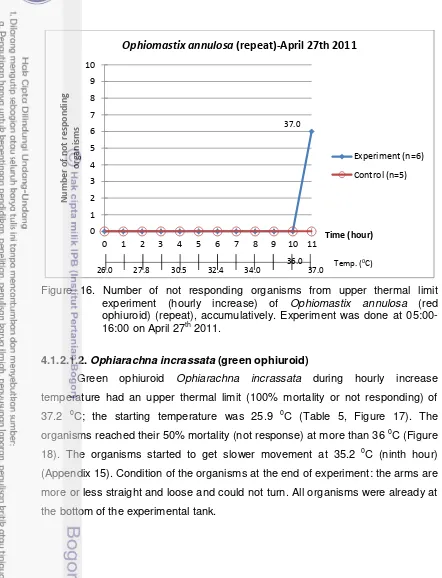
16. Number of not responding organisms from upper thermal limit experiment (hourly increase) of Ophiomastix annulosa (red ophiuroid) (repeat),
accumulatively. Experiment was done at 05:00-16:00 on April 27th 2011. ... 30
17. Temperature rise during upper thermal limit experiment (hourly increase) of Ophiarachna incrassata (green ophiuroid). Experiment was done at 05:00-16:00 on December 13th 2010. ... 31
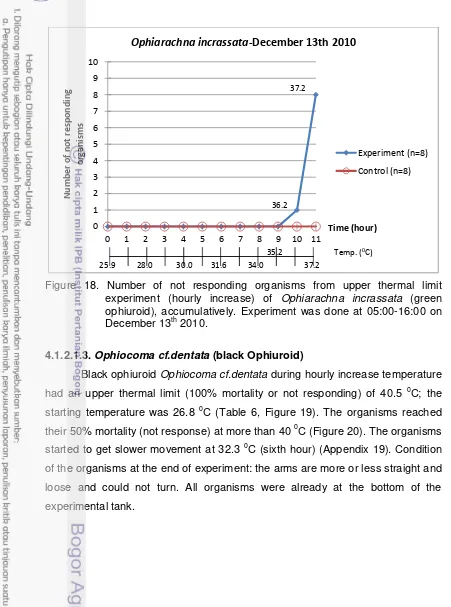
18. Number of not responding organisms from upper thermal limit experiment (hourly increase) of Ophiarachna incrassata (green ophiuroid),
accumulatively. Experiment was done at 05:00-16:00 on December 13th 2010. ... 32
19. Temperature rise during upper thermal limit experiment (hourly increase) of Ophiocoma cf.dentata (black ophiuroid). Experiment was done at 05:00-20:00 on October 31st 2011. ... 34
20. Number of not responding organisms from upper thermal limit experiment (hourly increase) of Ophiocoma cf.dentata (black ophiuroid), accumulatively. Experiment was done at 05:00-20:00 on October 31st 2011. ... 34
21. Temperature rise during upper thermal limit experiment (hourly increase) of Fromia milleporella (red starfish). Experiment was done at 05:00-14:00 on March 22nd 2011. ... 36
22. Number of not responding organisms from upper thermal limit experiment (hourly increase) of Fromia milleporella (red starfish), accumulatively.
Experiment was done at 05:00-14:00 on March 22nd 2011. ... 36
23. Temperature rise during upper thermal limit experiment (hourly increase) of Fromia milleporella (red starfish) (repeat). Experiment was done at 05:00-14:00 on May 4th 2011. ... 37
24. Number of not responding organisms from upper thermal limit experiment (hourly increase) of Fromia milleporella (red starfish) (repeat), accumulatively. Experiment was done at 05:00-14:00 on May 4th 2011. ... 38
25. Temperature rise during upper thermal limit experiment (daily increase) of Ophiomastix annulosa (red ophiuroid). Experiment was done on July 13th-22nd 2011. ... 39
26. Number of not responding organisms from upper thermal limit experiment (daily increase) of Ophiomastix annulosa (red ophiuroid), accumulatively. Experiment was done on July 13th-22nd 2011. ... 40
27. Temperature rise during upper thermal limit (daily increase) experiment of Ophiarachna incrassata (Green Ophiuroids). Experiment was done on
December 14th-22nd 2010. ... 41
xxxi
29. Temperature rise during upper thermal limit experiment (daily increase) of Fromia milleporella (red starfish). Experiment was done on May 6th-12th 2011. ... 43
30. Number of not responding organisms from upper thermal limit experiment (daily increase) of Fromia milleporella (red starfish), accumulatively.
Experiment was done on May 6th-12th 2011. ... 44
31. Temperature rise during lower thermal limit (hourly decrease) experiment of Ophiomastix annulosa (red ophiuroid). Experiment was done at 06:00-20:00 on September 22nd 2011. ... 45
32. Number of not responding organisms from lower thermal limit (hourly decrease) experiment of Ophiomastix annulosa (red ophiuroid),
accumulatively. Experiment was done at 06:00-20:00 on September 22nd 2011. ... 46
33. Lower salinity limit experiment (hourly decrease) of Ophiomastix annulosa (red opiuroid). Experiment was done at 05:00-21:00 on November 8th 2011. 48
34. Number of not response organisms from lower salinity limit experiment (hourly decrease) of Ophiomastix annulosa (red Opiuroid), accumulatively. Experiment was done at 05:00-21:00 on November 8th 2011. ... 49
35. Temperature during lower salinity limit experiment (hourly decrease) of Ophiomasxtix annulosa (red opiuroid). Experiment was done at 05:00-21:00 on November 8th 2011. ... 49
36. Lower salinity limit experiment (hourly decrease) of Ophiocoma cf.dentata (Black Opiuroids). Experiment was done at 05:00-04:00 (the next day) on November 10th-11th 2011. ... 51
37. Number of not responding organisms from lower salinity limit experiment (hourly decrease) of Ophiocoma cf.dentata (black opiuroids), accumulatively. Experiment was done at 05:00-04:00 (the next day) on November 10th-11th 2011. ... 52
38. Temperature during lower salinity limit experiment (hourly decrease) of Ophiocoma cf.dentata (black opiuroids). Experiment was done at 05:00-04:00 (the next day) on November 10th-11th 2011. ... 52
39. Temperature VS size of Ophiomastix annulosa in upper and lower thermal limit experiment (hourly and daily increase and hourly decrease). ... 56
40. Temperature VS size of Ophiarachna incrassata in upper thermal limit
experiment (hourly and daily increase). ... 57
41. Temperature VS size of Fromia milleporella in upper thermal limit experiment (hourly and daily increase). ... 57
42. Temperature VS size of Ophiocoma cf. dentata in upper thermal limit
xxxii
xxxiii
LIST OF APPENDICES
Page 1. Picture of material being used in this experiment ... 73
2. Protocol hourly thermal limit experiment (upper/lower) ... 79
3. Protocol daily thermal limit experiment (upper) ... 81
4. Protocol hourly salinity stress experiment (lower) ... 83
5. Protocol of upper thermal limit (hourly increase)-Ophiomastix annulosa ... 85
6. Sample data sheet of upper thermal limit (hourly increase)-Ophiomastix annulosa ... 87
7. Protocol of upper thermal limit (hourly increase)-Ophiomastix annulosa
(repeat) ... 88
8. Sample data sheet of upper thermal limit (hourly increase)-Ophiomastix annulosa (repeat) ... 90
9. Protocol of upper thermal limit (daily increase)-Ophiomastix annulosa ... 91
10. Sample data sheet of upper thermal limit (daily increase)-Ophiomastix
annulosa ... 94
11. Protocol of lower thermal limit (hourly decrease)-Ophiomastix annulosa ... 96
12. Sample data sheet of lower thermal limit (hourly decrease)-Ophiomastix annulosa ... 98
13. Protocol of lower salinity limit (hourly decrease)-Ophiomastix annulosa ... 99
14. Sample data sheet of lower salinity limit (hourly decrease)-Ophiomastix annulosa ... 107
15. Protocol of upper thermal limit (hourly increase)-Ophiarachna incrassata .. 108
16. Sample data sheet of upper thermal limit (hourly increase)-Ophiarachna incrassata ... 110
17. Protocol of upper thermal limit (daily increase)-Ophiarachna incrassata .... 110
18. Sample data sheet of upper thermal limit (daily increase)-Ophiarachna incrassata ... 112
19. Protocol of upper thermal limit (hourly increase)-Ophiocoma cf. dentata .... 113
20. Sample data sheet of upper thermal limit (hourly increase)-Ophiocoma cf. dentata ... 115
xxxiv
22. Sample data sheet of lower salinity limit (hourly decrease)-Ophiocoma cf. dentata ... 126
23. Protocol of upper thermal limit (hourly increase)-Fromia milleporella ... 127
24. Sample data sheet of upper thermal limit (hourly increase)-Fromia
milleporella ... 129
25. Protocol of upper thermal limit (hourly increase)-Fromia milleporella (repeat) ... 130
26. Sample data sheet of upper thermal limit (hourly increase)-Fromia
milleporella (repeat) ... 132
27. Protocol of upper thermal limit (daily increase)-Fromia milleporella ... 133
28. Sample data sheet of upper thermal limit (daily increase)-Fromia milleporella ... 137
1. INTRODUCTION
1.1. Background
It is widely accepted that global warming and climate change are happening (Hulme and Hadley Center and Climatic Research Unit, School of Environmental Science, UEA in Lovejoy and Hannah, 2005). One aspect that is affected by global warming and climate change is temperature rise, or warming due to increased CO2 levels. Lately many organisms, in this case marine, have shown effects that the temperature is rising and the climate pattern is changing (Barnes et al., 2010; Karl and Trenberth in Lovejoy and Hannah, 2005; Tewksbury et al., 2008). Changing of temperature and climate, also affects the marine environment, where the temperature of seawater is rising. When this happens, it could cause problems to marine organisms because the ability of each marine species or organisms to resist environmental change is different and geographically uneven (Barnes et al., 2010). In order to assess the effects to marine organisms, we need to have collaborative research (Parmesan in Lovejoy and Hannah, 2005). The present study is conducted as part of a collaboration with British Antarctic Survey (BAS), for latitudinal comparison on marine invertebrates. Based on previous research, sea temperature in Antarctic and tropic usually vary over 1-3 0C annually (Peck et al., 2010) and tropical and polar ectotherms organisms showed sensitivity to small temperature changes (Barnes et al., 2010).
Tropical areas, especially Indonesia, show very high biodiversity both in terrestrial and marine environment. Echinoderm species could be found in all marine areas. They live from intertidal to abyssal zones and from tropics to poles (Hyman, 1955), so that it could fit in the frame project of British Antarctic Survey (BAS). There are many echinoderm species in the tropical marine environment. Echinoderms are spiny marine organisms, which consist of the classes Asteroidea, Echinoidea, Ophiuroidea, Holothuroidea, Crinoidea, and Concentricycloidea (Ruppert and Barnes, 1994). Echinoderms can act as scavengers, grazers, deposit feeders, detritus feeders, suspension feeders, or predators (Barnes, 1966; Castro and Huber, 2007).
milleporella) which lives in subtidal area. The survival rate of organisms in the lab or in environment are depend on their sensitivity and ability to adapt with changing condition of the environment or new environment (Peck et al., 2009a). The reason for choosing subtidal species is because in general, intertidal species
are “tougher” than subtidal species. The intertidal species have higher tolerance to temperature and salinity (environmental condition) because they have to deal with a constantly changing environment in their habitat (Castro and Huber, 2007). So, intertidal species are less suitable within the project‟s frame, but can be used as comparison to subtidal species.
There are many stressors and factors in the marine environment, such as temperature, salinity, light, oxygen, food availability, competition, sediment load, etc. This warming experiment was measured in isolation from those factors, except temperature and/or salinity (Barnes et al., 2010). Temperature act as the main stressor in this experiment. Salinity is another stressor for comparison. Salinity stress experiment was done as a comparison to identify whether these organisms will be affected (in terms of activity and survival) or respond similarly to temperature changes or not.
1.2. Hypothesis
The hypothesis of this study are (1) thermal limit for each species might be different, compared to other studies; (2) thermal limits might be different with different rates of change.
1.3. Objectives
The objectives of this study are to identify the temperature limits of activity and survival for selected tropical ophiuroids from intertidal and subtidal) and asteroids, in comparison to reduce salinity limit.
2. LITERATURE REVIEW
2.1. Climate Change and Variation
Based on Liu et al., 2003 in Barnes et al., 2010, definition of climate is
“the sum of thermal variability over temporal scale that vary from hourly through multiyear and the effects of elevated temperature can be additive over time”.
Climate varies over seasonal scales to annual to ten years in duration (decadal). Climate change is defined as where the climate shows discontinuity,a jump, and/or trends compared to the previous century (Karl and Trenberth in Lovejoy and Hannah, 2005).
Climate change is usually related to temperature change and variation. Global average temperature from 1886-1994 can be seen in Figure 1. Mean global temperature relative to 1961-1990 can be seen in Figure 2.
Figure 1. Mean global temperature, 1886-1994 (Castro and Huber, 2007).
Species can become separated or new species can be formed when global climate changes. So, the diversity and compositions of communities could also be changed (Roy and Pandolfi in Lovejoy and Hannah, 2005).
Organisms in the ocean are responding to environmental changes in physical and chemical ways. The responses might be mild (the organisms adjust their physiological process, called acclimation), or acute, as organisms become sick or experiencing high mortality rate as the changes exceeds their limit. In the end, it might result in shifting genetic structure (called adaptation) and/or geographic changes in population range (Lovejoy and Hannah, 2005).
Figure 2. Mean global temperature relative to 1961-1990. Recent thermometer measurements and past temperatures estimated from tree rings, ice cores, corals, and historical records. The light brown shading indicates the range of uncertainty. Even with this uncertainty, 1998 was the warmest year in a millennium (Castro and Huber, 2007).
2.2. Role of Temperature and Salinity
Sea temperature is very important in influencing broad range of other critical features of marine environment (e.g. changing of the density of seawater or decreasing salinity) (Dickson and colleagues, 2002 in Lovejoy and Hannah, 2005). Overpeck et al. in Lovejoy and Hannah (2005) mentioned that if the world becomes warmer, increased precipitation is expected, and the ice in the poles will melt reducing salinity (e.g. ice melt in Greenland would reduce salinity in North Atlantic Ocean). This would weaken the North Atlantic thermohaline circulation (Manabe and Stouffer, 1994; Stocker and Schmittner, 1997; Rahmstorf, 2000 in Lovejoy and Hannah, 2005). Changing of salinity could have direct impacts to
marine organisms‟ health and functioning (Lovejoy and Hannah, 2005).
2.3. Intertidal
Intertidal zone is the area on the shallowest continental shelf (between land, sea, and tide) which is exposed to air during low tide and underwater during high tide (Figure 3) (Castro and Huber, 2007).
Figure 3. The major subdivisions of the marine environment are based on distance from land, water depth, and whether the organisms are benthic or pelagic. Description of subtidal zone (pink color) (modified from Castro and Huber, 2007).
2.4. Subtidal
shelf). The average depth of subtidal zones is around 150 m at shelf break (Figure 3). Water motion in subtidal zone sorts the particles by size and density, especially on the shallower parts of the shelf. On stronger waves and current, large-grained material (e.g. gravel and sand) settles out. Turbulence keeps the fine particles (e.g. silt and clay) in suspension, then they are deposited in quieter and deeper water when turbulence does not reach the bottom. (Castro and Huber, 2007)
2.5. Echinoderm
Echinoderms live as marine benthic organisms. They spread from the intertidal to subtidal zone, from shallow water to the deep sea, from tropics to polar waters. They also live on soft (e.g. mud, silt, clay) or hard bottom substrates (rocky, gravel, sand). Some of them are burrowing, some are epifauna.
Echinoderms‟ feeding habits vary, some are deposit feeders (“animals that feed on organic matters that settles in the sediment”), suspension feeders (“animals, including filter feeders, that feed on particles suspended in the water column”), scavengers (“animals that feed on dead animals”), or predators (“animals that feed on other animals”) (Hyman, 1955; Castro and Huber, 2007).
2.5.1. Ophiuroidea
Ophiuroidea is one of the classes from the phylum Echinoderm. They occur in all marine areas and at all latitude (tropics, polar, intertidal, subtidal, deep sea) (Hyman, 1955). There are many species in this class. They can live as grazers or scavengers. They detect food by their podia and arm tips. When they get a food item (prey), the food is transferred from podium to podium until it reaches the mouth (Erhart and Moosleitner, 1998). The mouth is located at the center of the oral side (Hyman, 1955).
2.5.1.1. Ophiomastix annulosa
hiding places to keep this organism in an aquarium (Erhardt and Moosleitner, 1998). Ophiomastix annulosa feed on small dead or living invertebrates (e.g. pieces of fish, earthworms, crustacean meat) (Barnes, 1966; Erhardt and Moosleitner, 1998). The color of the aboral surface is grey and red brownish. They have disc scales with scattered blunt spines on the arms. Aboral arm plates have light coloured edges [12]. The picture of Ophiomastix annulosa can be seen in Figure 4-A, 4-B, and 4-C.
A. B.
[image:41.595.112.513.121.615.2]C.
Figure 4. Picture of Ophiomastix annulosa (A: [7]; B: [3]; C: [1]).
The taxonomical name of Ophiomastix annulosa is: Kingdom : Animalia
Family : Ophiocomidae Subfamily : Ophiocominae Genus : Ophiomastix
Species : Ophiomastix annulosa (Clark and Rowe, 1971; [8]; [12])
2.5.1.2. Ophiarachna incrassata
Ophiarachna incrassata has the common name green ophiuroid and lives in subtidal, from 5-40 m. They can live on a wide variety of substrates, but mostly they can be found on coral gravel and/or coral sand substrates. They can live solitarily or in a small groups or aggregations. They like to live in the shade (not too much sunlight or nocturnal). It is suggested to provide hiding places to keep this organism in the aquarium. Ophiarachna incrassata feed on small invertebrates (e.g. pieces of fish, earthworms, crustacean meat). The disc diameter of Ophiarachna incrassata is one of the largest brittle stars, it can be up to 5 cm, and the length of arms could be up to 25 cm. The color of Ophiarachna incrassata is uniformly green and the spines have green or brown rings. There are numerous dots on the disc, colored black, green, or brown. Their optimum temperature to be kept in the aquarium is between 20-27 0C (Erhardt and Moosleitner, 1998). The picture of Ophiarachna incrassata can be seen in Figure 5-A and 5-B.
A. B.
Figure 5. Picture of Ophiarachna incrassata (A: [9]; B: [2]).
The taxonomical name of Ophiarachna incrassata is: Kingdom : Animalia
Subphylum : Asterozoa Class : Ophiuroidea Order : Ophiurida Suborder : Ophiurina Infaorder : Ophiudermatina Family : Ophiudermatidae Subfamily : Ophiarachninae Genus : Ophiarachna
Species : Ophiarachna incrassata
(Clark and Rowe, 1971; Erhardt and Moosleitner, 1998; [5]; [11])
2.5.1.3. Ophiocoma dentata
A. B.
Figure 6. Picture of Ophiocoma dentata (A, B: [4]).
The taxonomical name of Ophiocomadentata is: Kingdom : Animalia
Phylum : Echinodermata Subphylum : Asterozoa Class : Ophiuroidea Order : Ophiurida Suborder : Ophiurina Infaorder : Gnathophiurina Family : Ophiocomidae Subfamily : Ophiocominae Genus : Ophiocoma
Species : Ophiocomadentata
(Clark and Rowe, 1971; Erhardt and Moosleitner, 1998; [10])
2.5.2. Asteroidea: Fromia milleporella
Figure 7. Eye spot dan tentacles on the arm tip of a starfish, Protoreaster nodosus (Pisano, 2004).
Fromia milleporella has a common name of red starfish lives in subtidal, from1-15 m. They are found on live or dead corals of reef terraces and reef slopes. It is a diurnal species, so it is easily seen along the reefs. They are sometimes associated with amiable fish and some invertebrates (e.g. crustacean, anemones, corals). Fromia milleporella feed on detritus, microorganisms, or some leftovers (scavenging). The diameter of Fromia milleporella is around 7 cm. The color is mostly dark orange to light red and the arm tips are orange. It has numerous spots covering the entire aboral surface to mark individual pores. Their optimum temperature to be kept in the aquarium is between 24-28 0C (Erhardt and Moosleitner, 1998). The picture of Fromia milleporella can be seen in Figure 8.
Figure 8. Picture of Fromia milleporella ([6]).
The taxonomical name of Fromia milleporella is: Kingdom : Animalia
Phylum : Echinodermata Subphylum : Asterozoa
Class : Asteroidea Order : Valvatidae Suborder : Ophiurina Family : Ophidiasteridae Genus : Fromia
Species : Fromia milleporella
3. RESEARCH METHODS
3.1. Time and Location
This research was conducted in Marine Habitat Lab, Faculty of Fisheries and Marine Sciences, Bogor Agricultural University (FPIK-IPB) on December 2010-November 2011.
3.2. Materials
Materials that was being used in this study are shown in Table 1 and the pictures of materials are shown in Appendix 1.
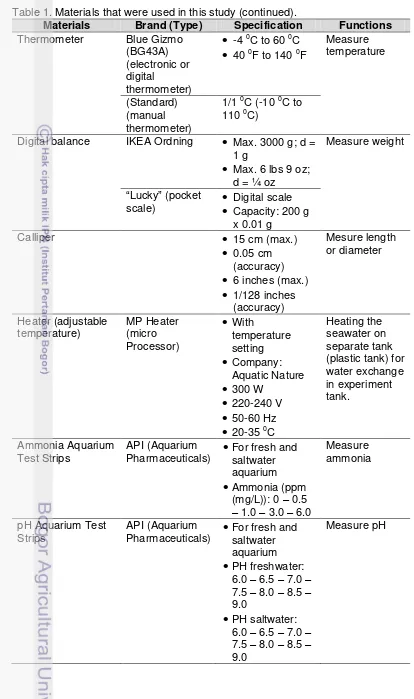
Table 1. Materials that were used in this study.
Materials Brand (Type) Specification Functions
Seawater Salinity: 33-35 ‰
From Teluk Jakarta, then filtered in Gelanggang Samudera & Seaworld, Ancol, Jakarta (Arafat, pers. comm., 2011)
Freshwater Aqua 1 galon = 19 L Reduce salinity
Food Fresh shrimp for
Ophiuroid. Shrimp pellet or small piece of fresh shrimps for starfish.
Feed the organisms
Refractometer Atago (S/Mill-E) (Hand-held refractometer, Made in Japan)
Salinity 0~100 ‰ Measure
salinity
Thermocycler with jacket tank
(customary
designed by British Antarctic Survey)
Grant (LTD20G)
-30 0C to 100 0C
2.3 KW
220-240 V
50-60 Hz
Tank dimension:-
Inner: 40 x 75x 31 cm
-
Outer: 54 x 90 x 39 cmIncrease or decrease temperature during experiment.
Table 1. Materials that were used in this study (continued).
Materials Brand (Type) Specification Functions
Thermometer Blue Gizmo
(BG43A) (electronic or digital
thermometer)
-4 0C to 60 0C
40 0F to 140 0FMeasure temperature
(Standard) (manual thermometer)
1/1 0C (-10 0C to 110 0C)
Digital balance IKEA Ordning
Max. 3000 g; d = 1 g
Max. 6 lbs 9 oz; d = ¼ ozMeasure weight
“Lucky” (pocket
scale)
Digital scaleCapacity: 200 g x 0.01 gCalliper
15 cm (max.)
0.05 cm (accuracy)
6 inches (max.)
1/128 inches (accuracy) Mesure length or diameter Heater (adjustable temperature) MP Heater (micro Processor)
With temperature setting
Company: Aquatic Nature
300 W
220-240 V
50-60 Hz
20-35 0CHeating the seawater on separate tank (plastic tank) for water exchange in experiment tank. Ammonia Aquarium Test Strips API (Aquarium
Pharmaceuticals)
For fresh and saltwater aquarium
Ammonia (ppm (mg/L)): 0 – 0.5– 1.0 – 3.0 – 6.0
Measure ammonia
pH Aquarium Test Strips
API (Aquarium
Pharmaceuticals)
For fresh and saltwater aquarium
PH freshwater: 6.0 – 6.5 – 7.0 – 7.5 – 8.0 – 8.5 – 9.0
PH saltwater: 6.0 – 6.5 – 7.0 – 7.5 – 8.0 – 8.5 – 9.0Table 1. Materials that were used in this study (continued).
Materials Brand (Type) Specification Functions
Nitrite and Nitrate Aquarium Test Strips
API (Aquarium
Pharmaceuticals)
For fresh and saltwater aquarium
Nitrite (NO2-): 0 – 0.5 – 1 – 3 – 5 – 10
Nitrate (NO3-): 0 – 20 – 40 – 80 – 160 – 200Measure nitrite and nitrate
Filter (for freshwater and seawater) and pump system had been provided by Marine Habitat Lab (as lab logistics).
Filtering and mixing freshwater and/or
seawater inside the tank.
Data sheet (see Appendix 2, 3, and 4)
Note all data during experiment
3.3. Methods
3.3.1. Selecting the organisms
There are some criteria to choose the organisms. First, the echinoderm organisms are from subtidal (several species), so that they could be compared with other latitudinal studies (e.g. Antarctic, Singapore) (e.g. studies from Peck et al., 2009a,b; Barnes et al., 2010; Nguyen et al., 2011). Subtidal area is assumed to have more stable condition than intertidal area, in terms of temperature (Peck et al., 2009a,b; Barnes et al., 2010) and salinity variability or stability are more stable (Castro and Huber 2007). Second, species from the intertidal, can be used as comparisons for subtidal species. Third, previous information suggests that
these organisms can be kept in the lab, in terms of size and “toughness” (low
underwater); for echinoids, the disc diameter could be up to 3 cm (measuring method based on Peck et al., 2009a).
Figure 9. Methodology scheme.
3.3.2. Receiving organisms and acclimation
The organisms selected for the trials were selected and received from CV. Dinar (Jl. Raya Dadap No. 30A, Kelurahan Dadap, Kecamatan Kosambi, Kabupaten Tangerang, Propinsi Banten, Indonesia 15211). CV. Dinar is a legal company which exports marine ornamental organisms, and it is a member of Indonesia Coral, Shell, and Ornamental Fish Association.
After receiving the organisms, the organisms were put in the lab for acclimation. In this acclimation phase, organisms showing high mortality and stress signs were dismissed from this study; and organisms showing low mortality with normal behavior were use as the object of this study. Several things were done during the acclimation phase, such as feeding tests, water quality
checking, water volume checking, observed and noted the organisms‟ habit and
behavior, and learnt how to handle the organisms.
starfish) from class asteroidea. These species were chosen also because they were available in sufficient abundance.
3.3.3. Feeding
During acclimation, organisms were fed every 2 days for the ophiuroids and asteroids. Later in the experiment, during hourly temperature increase or decrease and the salinity decrease experiment, specimens were not fed; and during daily temperature increase experiments, animals were also fed every 2 days.
3.3.4. Water quality control and water exchange
Seawater in the lab was taken and brought from Jakarta Bay, was then filtered in Gelanggang Samudera and Seaworld, Ancol, Jakarta; then transported to the lab in Bogor Agricultural University (IPB) (Arafat, pers. comm., 2011). When the seawater arrived in the lab, seawater was put in a big tank (brand: penguin, 1000 L) and filtered for at least 24 hours with the filter system in the laboratory. Then the seawater salinity and quality was checked using refractometer and seawater test strips to measure ammonia, pH, nitrite, and nitrate; before the through flow system was turned on to circulate the seawater in aquariums.
During acclimation, water exchange was done every day from the through flow system.
During daily increase temperature limit experiment, water exchange was done every 2 days to keep the water quality as similar as possible as in control tank. This reduced the additional stress for the organisms that might occur because of reduced water quality in the experiment tank due to increased ammonia or other substanced that the organisms produce.
3.3.5. Species verification
dorsal arm plate, ventral arm plate, oral plate, arm spines, furrow spines, ambulacral plate, papula, and other identifiable structures to identify the organisms (Clark and Rowe, 1971).
3.3.6. Preparation
Organisms were acclimated under lab condition for at least 5-10 days. Although this time varied between each experiment, depending on initial mortality and preparation time for the experiment setup. Then all the equipment was prepared and checked (e.g. thermocycler, thermometer, water filter, aeration, camera).
For each experiment, the thermocycler aquarium was filled with seawater, the filter was placed inside the thermocycler tank, turned it on, and left to filter for 1-2 days before the experiment (pilot and main study) to let the microflora inside the filter develop.
Before starting experiments, the control tank had to be prepared. Control tanks were in the through flow system and the size was 75 x 40 x 41 cm.
For daily increase temperature limit experiment, seawater was prepared in a separate tank (plastic tank), with adjustable heater, for water exchange. The exchanged water was pre-heated and adjusted to temperature in experiment tank before being put into experiment tank. This was done to prevent additional stress to the specimens.
For every experiment (temperature limit and salinity stress capacity), protocol sheets were prepared according to each experiment (examples in Appendix 2, 3, and 4).
3.3.7. Temperature limit experiments 3.3.7.1. General setup
experiment tank was raised 1 0C per day, organisms were fed every 2 days, and water exchanged every 2 days or everyday if the water looked murky and/or smelt bad. Water exchange was done every 2 days in experiment tank to make the water quality as similar to the control tank, because water exchange in the control tank done every day for approximately 30-60 minutes with through flow system. Water was exchanged everyday in the experimental tank when the quality of water in the experimental tank decreased because of the mortality or because organisms produced lots of feces or organic material. The changing temperature and the activity (Peck et al., 2008) and/or mortality of the organisms for the thermal limit experiments were noted.
The design of the equipment (thermocycler tank) can be seen in Figure 10 and Appendix 1.
Figure 10. Design of thermocycler tank for temperature limit experiment.
For daily thermal limit experiments, separate tanks (plastic tank) for water exchange were prepared. First, seawater was added into this plastic tank. Second, the filter, adjustable heater, and aeration were added and put inside the plastic tank. Third, the filter, aeration, and heater were turned on. Fourth, the temperature on the heater was adjusted to reach the target temperature, same as in the experimental tank when the exchange was done.
10-20 of each species were observed in this experiment (total of organisms in experiment and control).
Freshwater / cooling fluid
31 cm
3.3.7.2. Pilot study
The pilot and main experiment were done separately. The purpose of
doing the pilot study were: (1) to identify the parameters to indicate “not responsive” organisms. For the ophiuroids the turning response; and for the asteroids the turning response and attachment capability. (2) Knowing when to turn the specimen. It was when the specimens look weak and were not attached to the wall (already at the bottom of the experimental tank.
3.3.7.3. Performance and control
During the hourly experiment, the organisms were checked every hour and the temperature was checked every 20 minutes. During, daily experiments, the organisms were checked everyday at the same time as the experiment started. To check the organisms, first activity (movement) was monitored, whether their tube feet and tentacles were out, and if the arms and body were in normal condition (ophiuroids: arm tips were a little bit elevated and central disk were not swollen; asteroids: skin was not showing any white spots and the animal was still attached to the ground or wall) and not showing any abnormal condition. If they were showing any abnormalities (ophiuroids: arms curling or loosen, body color changing, central disk swelling, not attached to the wall anymore, or others; asteroids: not attached to the wall anymore or staying on the bottom, with white spots), the organisms were checked (ophiuroids and asteroids: turned over, to see whether they could turn over again).
During the experiment, activity of the specimens and the condition was noted. After the experiment, the weight and size of the specimens were measured, and it was noted if something had happened (e.g. any autotomy, condition of the arms (loosen or curling), condition of the body (stiff, wounded), etc.
3.3.8. Salinity stress experiment 3.3.8.1. General setup
Before the experiment, the tank size was measured to plan the seawater level inside the tank. The tank used in the salinity limit (stress capacity) experiment was the thermocycler tank, so that it would be comparable to the temperature limit experiments. The size of the tank (inside) was 40 x 75 x 32 cm. The water depth was 25 cm. So, the volume of water in the tank was 40 x 75 x 25 cm = 75,000 cm3 = 75 dm3 = 75 L. To measure the water level inside the tank, a ruler was put inside the tank and was stuck to the tank wall (Figure 11).
3.3.8.2. Pilot study
Before performing the hourly decrease salinity limit experiment, a trial was completed to test the flow of seawater after freshwater was added to the experiment tank. This trial was done to see the direction of flow of water inside the experimental tank to make sure that the water was mixed evenly during the experiment. For this trial, the experiment tank was filled with seawater and then the filter was put inside and turned it on. To measure the flow of the water, milk was used as an indicator. The flow of the water inside the experiment tank can be seen in Figure 12 and Appendix 5. After finishing this trial, the experimental tank was being cleaned again before being used for the real salinity decrease experiment.
Figure 11. Condition in salinity decrease experiment tank. The ruler is attach to the wall inside the experiment tank.
3.3.8.3. Performance and control
When the tank was set up and clean, the seawater was put into the experiment tank until it reached 25 cm (height). The water quality (ammonia, pH, nitrite, and nitrate) and salinity were measured before the experiment started. The experiment decreased the salinity at 1 per hour. The amount of freshwater added to experiment tank in 1 hour was noted. The next hour when salinity was decreased again, the amount of water (that was added during previous hour) was taken out first before more freshwater was added to experiment tank.
The number of animals (ophiuroids: Ophiomastix annulosa and Ophiocoma cf. dentata) used in this experiment is 7 organisms in the experiment and 3-5 ophiuroids for the control.
3
6
7
2 1
4 5 Filter
Bottom current Surface current
Figure 12. Sketch of waterflow during trial with milk. Fixed line shows the surface current; dashed line shows the bottom current; point 1-7 are the points where milk was dropped. The slowest current among 7 points was at point 3. The other points (point 1, 2, 4, 5, 6, 7) are faster than point 3.
the arms and body were checked to see if they were normal (ophiuroids: arm tips were a little bit elevated and central disk were not swelling) (pers. obs.). If they showed any abnormalities (ophiuroids: arms curled or loose, body color changed, central disk swelled, not attached anymore, or others). Animals showing any of these were further checked (ophiuroids: turned over, see whether they could turn over again).
4. RESULTS AND DISCUSSION
4.1. Results
4.1.1. Species verification
From the species verification (through identification with identification key from Clark and Rowe, 1971), it is verified that the species name are Ophiomastix annulosa (red ophiuroid), Ophiarachna incrassata (green ophiuroid), Ophiocoma cf. dentata (black ophiuroid), and Fromia milleporella (red starfish). The picture of these species can be seen in Appendix 29.
4.1.2. Thermal limit and salinity stress experiment
In this study, several experiments were done with several species of tropical echinoderm, from class ophiuroidea and asteroidea. The experiments were: (1) hourly upper thermal limit, (2) daily upper thermal limit, (3) hourly lower thermal limit, and (4) hourly decrease salinity. The general results of this study can be seen in Table 2 and details results and graphs are provided below.
Table 2. Temperature and salinity limit of selected tropical Ophiuroidea (Ophiomastix annulosa, Ophiarachna incrassata, Ophiocoma cf.dentata) and Asteroidea (Fromia milleporella)
Organisms
Thermal Limit (0C) (100% not responding)
Salinity Limit (psu)
(100% not responding)
Upper Lower Decrease
Hourly Hourly
(repeat) Daily Hourly Hourly
Table 2. Temperature and salinity limit of selected tropical Ophiuroidea (Ophiomastix annulosa, Oph
![Figure 4. Picture of Ophiomastix annulosa (A: [7]; B: [3]; C: [1]).](https://thumb-ap.123doks.com/thumbv2/123dok/929657.391287/41.595.112.513.121.615/figure-picture-of-ophiomastix-annulosa-a-b-c.webp)