JSPS Science Fund Basic Research (S) No. 21222003
Project Leader: Yukio Himiyama (professor, Hokkaido University of Education) ヲNNェNALᆬLャェIヲセセ[AゥAB[ゥaAエャェIヲセ@
(8)
ゥャエセJセ@21222003
lVf
'1t:
ヲ|A セ J@)j(JI.
LlI$
セ@ Hセエ セゥAセェAAヲ;k'¥frilf
GᆬャャQャセセI@SLUAS Science Report 2012
Edited
by
Yukio
hゥュゥ セ 。ュ。@mセケ@
2&12
⦅]⦅MNNNZMセNNN[@
1W-24:1Ej5,,5
SLUAS Science Reports 2012 ||[Zエセ@ :.:C! セ@
Land Use/Cover Cbanges in Puncak Area (Upstream of Ciliwung River)
and Its Potential Impact on Flood Dynamics
Ernan Rustiadi
1,Suryadarma larigan
2,Siti Nurholipah
2,Andrea Emma Pravitasari
I,and Laode Syamsul [man
l1.Center for Regional Systems Analysis, Planning and Development, Bogor Agricultural University, IPB
Baranangsiang Campus, JI.Pajajarall, Bogor 16144
2. Depru1ment of Soil Science and Land Resources, Faculty of Agriculture, Bogor Agricultural UniverSity, IPB
Durmaga Campus, JLMeranti, Darmaga Bogor, 16680
Keywords: flood, upstream watershed, land use/cover change (UJCC), Ciliwung river, Puncak area
1. Introduction
jakarta is the capital of Indonesia with its function as an economic and administrative center. The dynamic
growth of Jakarta have an impact to the country especially to i!Scsurrouriding areas. One of the capital complex
issues that remain unresolved today is the environmental proble[TIs caused the decline in the environmental
carrying capacity of Jakarta and surrounding areas. Flood is one of the many environmental issues raised as a
topic in this study.
Floods in Jakarta can occur localiy or at a wider scale ofregion. The occurrence or floods in Jaka!ta is caused
by one or the interaction of several factors: (I) daily rainfall (extreme rainfall), (2) sea tides, (3) discharged water (extreme ri ver discharge) of upstream rivcrs that flow into Jakarta, (4) decreased level of some ground surfaces,
and (5) poor drainage system of the city. The last three factors (no. 3, 4, and 5) are all those whose roJes are
getting bigger and are anthropogenic.
Ciliwung and Cisadanc Rivers are the two main rivers that cross the city of Jakarta and have a major effect on
the incidence of flood in the region. The upstream watershed ecosystem is 'an important part because of its
conservation function for the entire watershed (Asdak, 2010). The environmental degradation in the upper
watershed Ciliwung has a direct impact on Jakarta as part of the watershed. The upper parts of these rivers セイ・@
located on the areas which lie on the border between Bogar and Cianjur Districts, Or precisely on the area Mount
Pangrango known as Puncak Region.
Ciliwung watershed is one of several watersheds, which is nationally categorized as a critical watershed, and
classified as the most priority to be addressed. This classification was made by the Ministry of Forestry, Ministry
of Home Affairs and Ministry of Public Works because Ciliwung watershed is das'sified as damaged as a result of
degradation in quality and therefore it requires conservation efforts as soon as possible.
Ciliwung watershed has similar characteristics to other critical watersheds, but there are some asoeets that
make Ciliwung watershed more attention, hence the highest priority to deal with. First, the downstream
watershed of Ciliwung includes the state capital (Jakarta), which is very rich in a variety of national assets and
serves as the largest residential area in Indonesia. Second, the to the upstream watershed of Ciliwung is .
infrastructure that is not environmentally friendly. Third, the upstream watershed ofCili wung is a growing tourist area, thus giving more press ure on water resources (Lewolaba, 1997). Cliwung watershed manage ment is faced with many obstacles since Ciliwung watershed involves a nu mber of autonomous adm inist rative regions. The policy system and management of wate rshed are still fragmented with the admin istrat ive bo undary-based approach, so this is still not effec tive (Sabri, 2004).
Acco rding to various studies, the environmental condition in the upstream watershed of Ciliwung is conti nuing to decline in quality. Based on the study by Nurholipah (2011), the decreased quality of Ci li wung watershed is reflected from the freque ncy and qua lity of fl ood, maximum discharge and maximum-minimum discharge ratio. Previous studies by Janud ianto (2004) and Sud adi et a!. (199 1) found the increasing differen ce between the max imum and minimum ann ual discharges in the sub-watershed of downstream Ciliwung. The decline of watershed qu ality was due to the land use change, in which vegetated areas have been converted into construction/settlement areas, causing a decline in the quality of soil to absorb wate r (N urholipah, 20 11 ; Charlos, 2010 and Sudadi et aI. , 1991). The tendency of land conversion in the sub-watershed of upstream Ciliwung is re lated to its strategic location as a tourism area that continues to grow a long with the increasing populati on. The dominant li ve lihood of the people in the agricu ltu ra l sector sho,?,s thei r high dependence on farmi ng acti vities that push the conversion of forest cover areas including the agroforestry area.
The dyna mic hyd rological condition of sub-watershed of upstream Ciliwun g is quite well monitored with the presence of the Flood Observation Stati on at Katulampa (Katu lampa Station), Bogor City. The Station is located at the outlet point of upstream C ili wung Sub-Watershed, wh ich co ntinu ous ly records the height of surface water and water disc harge of C ili wung River. The degraded quality of upstream watershed is indicated by the water level that reaches the outlet of Katu lampa Station, that is, the different of maximum and minimu m water levels between the rainy and dry seaso ns. In the ra iny.seaso n, water level entering the outlet of Katulampa will be very high and in the dry seaso ns it will be very low. $
From the facts mentioned above, it ca n be said that the upstream watershed of Ciliwung is becoming inc reasingly vu lnerable and at the risk of flooding as a result of th e chang ing land use patterns. Therefore, a study is required to assess the extent to wh ich the dy namics of land use/cover Change in the ups tream Ciliwung Sub-watershed is linked to the decrease of waters hed quality by observing the dy namics of river water discharge and the onset of potentia l fl ooding. The study is aim ed in more details to: ( I ) analyze the pattern of land use/cover change (LUCC) in sub-watershed area of Ci li wung, and (2) exam ine the co ntribu tion of land use/cover change (LUCC) to the pote ntial flooding in the region.
2.
Materials and Methods
This study uses several kinds of data and maps, including data on dai ly rainfall in the Su b-Wate rshed of Ci li wung in 1990-2010 (obtained the Stations Katu lampa, C iteko and Gunung Mas), rec ord of dail y water height at Katulampa Station, flood occurrences (p rimarily) in Jakarta and maps of land use/cove r in sub-watershed area of upstream C ili wung in 1990, 200 I, and 2010. Some a nalyses used in this study are of land use change (LUCC1. correlati on analyses of so me specific variables and regression analyses to identify the factors th at significantly influence the occurrence of floodin g in Jakarta.
-3.
Results and Discussion
Flood is the water that exceeds the holding capacity of soil, waterways, rivers, lakes or seas because the excess
water in the soil, waterways, rivers, lakes, and seas will overflow and inundate the plains or lower areas in the
vicinity (Kristianto, 2011). According to the Earl y Warning Systems of Jakarta, there is a classification of flood
warning with the criteria based on a combination of information on the water height/level at the three stations of
flood observations, namely Katulampa, Depok and Manggarai Stations.
Below are the four criteria of flood status (alert) in jセ。イエ。@ based on the water level at the three Stations (promise
Indonesia, 2009):
Alert 4 (Siaga 4) : Normal condition with water levels at Katulampa <80 cm, Depok <200 cm and
Manggarai <750 cm
Alert 3 (Siaga 3) : Katulampa 80 cm, Depok 200 cm and Manggarai 750 cm
Alert 2 (Siaga 2) : Katulampa 150 cm, Depok 270 cm and Manggarai 850 cm
Alert I (Siaga I) : Katulampa 200 cm, Depok 350 cm and Manggarai 950 cm
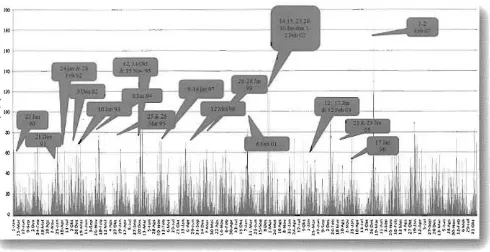
The flood occurrence in Jakarta is closely related to the high rainfall in both Jakarta itself and Puncak Area.
The data of daily rainfall at Ciliwung Sub-Watershed and the records o( flood occurrences in Jakarta from 1990 to
2010 are presented in the graph of Figure I.
,.,
,-iM
セ
iM
'"
,.
,.
,. L'___
.,
セゥセャァ[ゥヲ[[セセァᆪセセセセセ ェセァセセセ セセゥ_セセ[ゥ セ ァセセ@ _ エセセi セ[ Aエiァ@ [ セセ セ セセセャセ セエ セァ セ@ ゥ セャ a Aゥゥ [セ_セァFャ@ セ Aセ@ セ i ゥ ァ@ [エ _ セ aゥセ@ セ セ[jセァ@
[image:4.612.69.559.556.808.2]M セセ セョセ@ セ セセセセhセセセZセセAZ@ セ セエZセ]RセセセセZᄁセZセ@ セ セセZ@ G セセᄆNセhZセセセセセセ セセセセRセセ n セ]GョセセセセセセZセセセZセ セ セ]NセセZ@ セ セセセセセJZセセZ@
Figure 1. Rainfall at Ciliwung Subwatershed and flood occurrences in Jakarta
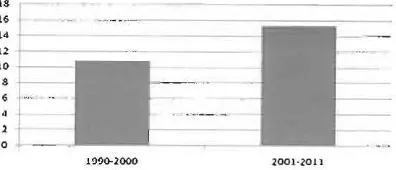
Katulampa is one of several opening gates that serve as early warning stations for Jakarta floods. The alert
status of flood at Katulampa may indicate a potential flood in the downstream region. Figure 2, 3, and 4
respectively are the graphs that present the frequency and the status of flood that has occurred in the last 20 years
(1990-2010) at Katulampa Station.
[image:5.612.204.402.167.252.2]2001·2011
Figure 2. Flood Frequency in Katulampa Station
[image:5.612.151.461.295.398.2]I
Figure 3. Yearly Flood Frequency at Katulampa Station
35 -
--30
gSi,lg;) 1
_ S,,,g.:o 2
=
$1"8;)3I
o セ@セ@ セ@ セ@ セ@ セ@ セ@セ@ セ@ 8 セ@ ᄋ セX@ セ@ セ@ セ@ セ@ s
[image:5.612.130.465.462.572.2]-セ@セ@ セ@ セ@ セ@ セ@ セ@ セ@セ@ セ@ セ@ セ@ セ@ セ@ セ@ セ@ セ@ セ@ セ@セ@セ@セ@
Figure 4. Yearly Flood Status Frequency at Katulampa Station
Figure 2 shows the average frequency of flood in two year periods, namely \990-2001 and 2001-20\0. Based
on this graph, the average flood occurrence increased in the second period. The graph in Figure 3 shows the
frequency of flood occurrence every year. From the graph it can be seen that the pattern of flood occurrence was
highly fluctuating in frequency, but in general the flood frequency tended to increase every year. Figure 4 presents
the data on the flood status based on the alertness level (Siaga \
=
high, Siaga 2=
moderate and Siaga 3=
low).From the graph in Figure 4 it can also be seen that the frequency of flood during the period \990-2011 tended to
increase.
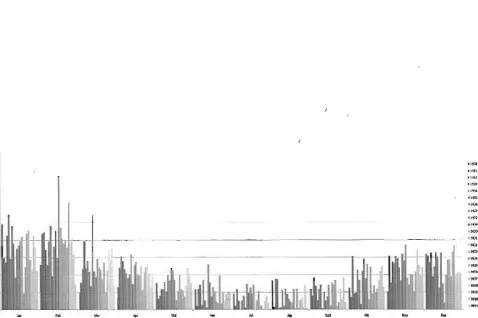
Rainfall is an input from the Watershed system, while flood is an output from the watershed. Thus rainfall is
the determinant factor of flood occurrence if other factors are not considered. Figures 5 and 6 below present the
data on the monthly precipitation level and monthly average from 1990 to 2010 in Puncak Area.
-'''/1)
. :
.,>1,BNセ@
•
. omLLセ@
..
セ@,
.,,".,....
..
LLセ
r
IIII
d
I
...
セ@,
•
.,
-
セ@ セ@ セ@-
」セ@ セ@ セ@ セ [image:6.612.73.551.58.376.2] [image:6.612.91.442.435.590.2]"
'"
Figure 5. Monthly Precipitatiou Level (mmJday) 1990-2010 ofPuncakArea (monthly wise)
25.00
T
r。ゥョ セ Sea sort_ _ 1990-2001
m
Id 10.00
セ@
セ@
セ RPPQ M RPQP@a
セ
dイケ@
season /
セ@
Changes20.00
m 15.00
_ y 5.00
0.00
-5 .00
Figure 6. The Monthly Average ofprecipitation Level (mm/day) 1990-2010 ofPuncakArea
It turns out that the rainfall that affected the flood occurrences from year to year did not change significantly.
Similar patterns occur every year, that is, reaching the highest peak in January and February and the lowest peak
in July and August. To justify the fmding, then a test of significant rainfall difference was carried out for average
of daily rainfall of two ten-year periods, namely 1990-2000 and 2001-2010. Below are the results of the
significant difference tests (Table 1).
Table 1. Test of Significant Difference in rainfall between the periods of 1990-2000 and 2001-2010
M ean - ValidN I validN ! Std.Dev.- St d.Dev.! Fratio I
p -!
MeanI Group 1 Group 2 tvalue
I
dfI
P Group 1 : Group 2 Group 1 Group 2 ! Variances Variances,
Var1 vs.
i
iI 12]
d
5.377.022セ。イR@ 9.880.1551 9.712 .574 0 .074727_ 1 RRセNYTQQPW@ 5.606.9421 1.087.34S p.892032
i
Note: var 1 セ rainfall between the periods 1990-2000 var 2 セ@ rainfall between the periods 2001-20 10
Table 1 above is the resulted test of significant difference in the annual rainfall between the periods of 1990-2000 and 20012010. It can be seen that statistically there is no significant difference between the rainfall in the period 19902000 and the rainfall in the period 20012010.
Table 2. Test of Significant Difference in monthly rainfall in the periods of 1990-2000 and 2001-20 I 0
Ttest for Independent Samples (Spreadsheet1)
Note:Variabte5 were tJeated as independent samples
Mea Mea tval df p Vali Std.
I
Std. Frat Pn
Ivan
VanGro
dN Dev. Dev. io
n ue dN
Van ance Gro IGro Gro Gro
I
Group 1 up 1 up2 s
up 1 up2 up2 anee
GroUD 1 vs. Groul'l 2
0.3 11.0 ! 11 .0 I 5.4 1 5.8 1 1.2 1 0.8
16.6 I 16.2 1.0 I 20.0 I
Var1 VS. Var2
Table 2 above is the resulted test of significant difference in the average monthly rainfall in 1990-2000 and
2001-20 II. The test results presented in Tables I and 2 show that the rainfall in the last twenty years is not
significantly different. However, the fact is that the incidence of flood is increasing from year to year. Given these
facts, it is predicted that there is another factor that more greatly determines the incidence of flood in Jakarta,
namely the change in land use in the sub-watershed ofCiliwung. Therefore, the analysis of land use change in the
Ciliwung sub-watershed was also conducted in this study, using maps of land use / land cover in 1990, 200 I, and
2010. With this analysis, the patterns of land use changes can be easily determined over the past 20 years, i.e. in
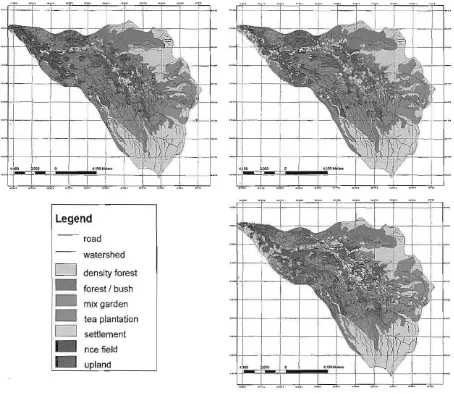
the period 1990 to 2010. The results of image analyses and maps of land use in the sub-watershed of upper
Ciliwung are presented in Figure 7.
Legend
road
watershed
D
density fares! fares! I bush_ mixgarden
I
D
tea plantationD
settlement _ rice field_ upland t
o
Figure 7. Maps of Land UselLand Cover Sub-Watershed of Upper Ciliwung in 1990,2001 and 2010
168
-i
[image:7.612.116.482.109.186.2] [image:7.612.73.527.374.768.2]---1500.0 1000.0 500,0 0.0
Upstream watershed should be used as a protective area because it has a very important role in sustaining the
entire watershed area. From Figure 7 it can be seen that over time the land use pattern in the sub-watershed of
upper Ciliwung continues to change. This change is the decrease in forest land use/cover types from shrubs, mixed
farms and fields to tea plantations, settlements and rain-fed fields. With the decreasing area of forest and other
green open space, then the function of the upstream watershed ecosystem of Ciliwung as a buffer region has
become disturbed because of a lack of attention to land use sustainability principles. The following Figures 8 and
9 present the data on the size of each type of land use in Sub-watershed of Upper CiliWWlg and the patterns of
land use changes in the 20 years, covering 2 (two) periods onime, i.e. 1990-2000 and 2001-2010.
4500.0
I
4000B ')
5000.0
Aiョセセセセセセセセセセセセセセセセ
Aセィ@
,; I
セ@
n..---
1.81=="
.•
Figure 8. Size/ Acreage ofLand Use/cover in Sub-watershed of Upper Ciliwung in 1990,2001 and 2010
800.0 -,-
-600.0
+
-400.0
t-200.0 t
-0.0 '200.0
·400.0 t '
·600.0
---rea
Dens Forest MIX Settle Rice Up· Plan
Forest IBush Garden ment Field land
lation
- - - -
- - - -- -- -r:I
- -I. - - r
'" 9001
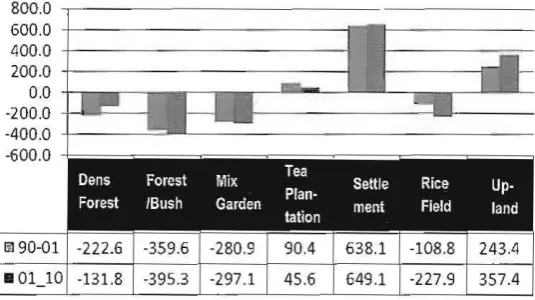
[image:8.612.138.409.395.555.2]• 01_10 357.4
Figure 9. Acreage ofLand Use/Cover Changes in Subwatershed of Upper Ciliwung in 19902001, and 2001 -2010
From the graph in Figure 9 above it can be seen that there was a big change ofland use/cover for settlement within the period of 20 years, both in the period 19902000 and 20012010. Another dominant change was the increased area of the dryland. Based on the results of the study by Nurholipah (2011), the changes in land use thought to have caused a decline in the watershed quality is the increasing catchment area and the decreasing area of scrubland.
[image:8.612.148.416.609.759.2]and mixed farms. According the studies by Sudadi et aJ. (1991) a similar pattern of land use changes also occurred
in the period 1981-1990 in the same area, the changing patterns of land use to a settlement area.
Although rain is not the factor affecting the increased frequency of flood, but it is the determinant major factor
of the flood occurrences because rainfall is an input factor and flood is the output. For these reasons, some
analyzes were conducted to determine the most influential rainfall that causes the high water level at the outlet of
Katulampa.
[image:9.612.179.388.195.283.2]0.6000
...
0.5000 セ@ 0.4000 0.3000 0.2000 0.1000 0.0000Figure 10. Correlation between Ln Disharge (y, mm1day) and precipitation in the day (CH), a day before
(CH-I), CH2, .... , CH12
n セ@ AA セ@ M セ@ セ@ セ@ RIO Rl1 R12 HI3
[image:9.612.334.544.346.448.2]セ@ u u セ@ セ@ u セ@ セ@ KIa Kll K12 K13
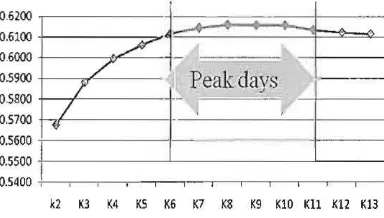
Figure 12. Correlation between Ln Discharge (Y, 11. Correlation between Discharge' (Y, mm1day) and average cumulative precipitation in mm1day) and cumulative precipitation in the da);: (K), prior day (R), a day before (RI), R2, .... , Rl3
0.6100 0.6100 0.6000 05900 0.5800 0,5700 0.5600 0.5500 0.5400
/ "
セM セ@
/ ' G •
I'
Peak days
/
i
,
[image:9.612.70.262.347.456.2]•
,
,,
,
,
Figure 0.6200 0,6100 0.6000 0.5900 0.5800 0.5700 0.5600 0.5500 0.5400I I I
iM G@ セ
...
.K
/ '
I '
,
Peak days
,
/ _ ._
Q
_._.
and prior day (KI), K2, .. .., KI3
-Figure 10 shows the relationship between the high rainfall and the resulted water leveL The results of correlation analysis concluded that the rainfall that mostly affects the water height is the rainfall that fen on that (falling) day (CH), with its effect decreasing with the distance/interval away from the falling day/time (CHl, CH-2, CH3, ... , etc.). However, for the influence of cumulative rainfall and cumulative average rainfall (see Figures II and 12), the highest correlation between the water level at Katulampa and the rainfall is on the same day and the days afterward until the fifth day. In other words, it should be assumed that the rainfall that is most likely to cause flooding is the one that falls on five or more consecutive days.
3. Closing
Changes in the land use/cover (LUCC) in the Subwatershed Area of Upper Ciliwung have a Significant impact on the declining quality / carrying capacity of watershed and the increase of environmental vulnerability, thus potentially having the risk of flooding in downstream areas, especially in Jakarta City. Therefore, a system of spatial planning is required with the effective support of spatial information technology to facilitate supervision and control. Further, strong effective institutions are necessary to control the implementation of spatial plans.
170-Without any significant changes in the capacity building in the environmental planning and management Jakarla and its surrounding areas (Greater Jakarta area) will be increasingly vulnerable to the risk of flooding.
References
Asdak, C. 20 to. fIydrolofY and Watershed Management. Yogyakarta: UGM Press.
Janudianto. 2004. Analysis of Land Use Change and its Impact on Minimum-Maximum Water Discharge at Sub-Watershed of Upper Ciliwung. S-J (Undergraduate) Script. Soil Department. Faculty of AgricUlture IPB. Bogar. U n p u b l i s h e d . '
Kristianto. A. 2010. Flood Disaster Response. Bandung: Angkasa.
Lewolaba, G. 1997. Public Participmion in Water Resources Management in the Capital City of Jakarta. Paper presented in the seminar on Water Resource Management in the Official Opening of Forestry Master Program, UPN Yogyakarta in 1997.
Nur, S.H. 2012. The Effect of Land LiseiCover Changes on the Characteristics of Sub watershed of Upper Ciliwung. S-I (Undergraduate) Script. Soil Department. Faculty of Agriculture IPB. Bogor. Unpublished.
Promise Indonesia. 2009. Flood and Its Mitigation Ellorts. Program for Hydro-Meteorological Risk Mitigation Secondary Cities in Asia. Band uog: 1TB.
Sabri. 200'1. Analysis of Land Use Conversion Using Remote Sensing and Willingness to Pay at Sub-watershed of Upper Ciliwung, West Java. Thesis. IPB
Sudadi, U.D.P.T. Baskoro. K. Munlbah, B. Barus dan Darmawan. 1991. A Study on the Effect of Land Use Change on River Flow and Decreased Land Quality at the Sub-watershed of Lipper Ciliwung by an Approach of Hydrological Simulation ModeJ. Research Report. Soil Department. Faculty of Agriculture, IPB.Bogor.