TMT Quantization Table Generation Based on
Psychovisual Threshold for Image Compression
Ferda Ernawan
1,2, Nur Azman Abu
2and Nanna Suryana
2 1Faculty of Information and Communication Technology, Universitas Dian Nuswantoro Semarang 50131, Indonesia
2
Faculty of Information and Communication Technology, Universiti Teknikal Malaysia Melaka Hang Tuah Jaya, Melaka 76100, Malaysia
e-mail: [email protected], [email protected] and [email protected]
Abstract—The human visual systems are able to perceive various intensity of the colour image while it is not able to respond small different colour signals of the image. The sensitivity of the color image can be measured by a psychovisual threshold. A psychovisual threshold represents the sensitivity of the human eye to the image. The quantization tables are obtained to determine psychovisual threshold that can be perceived visually by the human eye. This paper presents a generating of the quantization tables from a psychovisual threshold on grayscale TMT image compression. This paper introduces the concept of psychovisual threshold into TMT image compression. TMT image compression has been shown to perform better than the standard JPEG image compression. This model has been implemented on TMT image compression. The experiment results show that a psychovisual threshold for TMT basis function provides better image compression performance.
Keywords— Psychovisual threshold, TMT quantization table generation, Tchebichef moments, TMT image compression.
I. INTRODUCTION
Human eye is sensitive to any slight changes on image colours. An image carries considerable amount of perceptual redundancy to the human eye. Visual perception is a complex coordination among the eye, optical nerve, visual cortex and other part of the brain [1]. Human eye does not perceive directly translation of retina stimuli, but it involves complicated psychological inference [2].
The visual perception of the color image consists of some redundant data. The psychovisual redundancy results in the fact that human eye perception of an image does not really depend on specific individual pixels. This psychovisual redundancy can be determined by several experimental or trial testing on the human visual eye perception to the image intensity. However, the result is relatively subjective.
The psychovisual redundancy is the image information that is ignored by the human visual system or relatively less important to human eye. In another word, human eye is not equally sensitive to all visual image information. The removal of psychovisual redundancy theoretically reduces the information in the image. In some cases, it is useful to remove the redundancy data especially on image compression. The psychovisual redundancy can be eliminated in the lossy data compression via the quantization process. The quantization
tables play a central role in the removals of the visual redundancies of the image. The quantization table also represents the sensitivity of human visual system.
This paper proposes a psychovisual threshold to determine visibility of human eye as represented by the quantization table. The objective of this research is to propose a better quantization table for grayscale image compression. Psychovisual threshold can be conducted via quantitative experiment by evaluating the frequency just noticeable difference of the compressed image from the original image.
This experiment is conducted by incrementing TMT coefficient one by one. The sensitivity of TMT basis function is measured to get a psychovisual threshold. This experiment investigates the effect of TMT coefficients on image reconstruction error for each moment order. A psychovisual threshold of TMT basis functions is useful to generate new quantization tables for optimizing TMT image compression.
TMT does not involve any numerical approximation unlike most popular continues transform. The Tchebichef moment consists of rational numbers only which makes it simpler with lower computational complexity. An additional advantage, Tchebichef moment requires the evaluation of algebraic expression only. TMT has been widely used in many image processing applications such as image analysis [3], texture segmentation, multispectral texture, template matching, pose estimation, image reconstruction [4], image dithering [5][6], image projection [7] and image compression [8]-[10].
The organization of this paper is as follows. The next section provides a brief overview on TMT. Section III presents the experimental to design the quantization table. Section IV presents the new quantization table generation based on psychovisual threshold. The experiment results of a new quantization table in TMT image compression are presented in Section V. Next, the comparisons of the experimental results are discussed in Section VI. Lastly, section VII concludes this paper.
II. TCHEBICHEF MOMENT TRANSFORM
, , ,
, (1)
for m = 0, 1, 2, ..., M-1 and n = 0, 1, 2, ..., N-1
where , denotes the intensity value at the pixel position , within the block image. The are defined using the following recursive relation:
, (2)
, (3)
and
(4)
for , , … , . The recursive relation of 8×8 orthogonal Tchebichef polynomials are shown in Table 1.
TABLE I
THE RECURSIVE RELATION OF 8×8ORTHOGONAL TCHEBICHEF
POLYNOMIALS.
1.0000 1.0000 1.0000 1.0000 1.0000 1.0000 1.0000 1.0000 -0.8750 -0.6250 -0.3750 -0.1250 0.1250 0.3750 0.6250 0.8750 0.6563 0.0938 -0.2813 -0.4688 -0.4688 -0.2813 0.0938 0.6563 -0.4102 0.2930 0.4102 0.1758 -0.1758 -0.4102 -0.2930 0.4102 0.2051 -0.3809 -0.0879 0.2637 0.2637 -0.0879 -0.3809 0.2051 -0.0769 0.2527 -0.1868 -0.1648 0.1648 0.1868 -0.2527 0.0769 0.0192 -0.0961 0.1730 -0.0961 -0.0961 0.1730 -0.0961 0.0192 -0.0024 0.0168 -0.0505 0.0841 -0.0841 0.0505 -0.0168 0.0024
The above definition uses the following scale factor for the polynomial of degree n.
, (5)
The set has a squared-norm given by
,
. . . … (6)
The description of squared-norm . and the properties of orthogonal Tchebichef polynomials are given in [3]. The results of , with n, N=8 is shown in Table II.
TABLE II
THE SQUARED-NORM OF THE SCALED TCHEBICHEF POLYNOMIALS FOR N=8
n ,
0 8.0000 1 2.6250 2 1.4766 3 0.9064 4 0.5287 5 0.2636 6 0.0976 7 0.0198
The TMT basis function is shown in Figure 1.
Figure 1. 8×8 TMT basis function.
There are 64 two dimensional TMT basis functions that are generated by multiplying a horizontal against vertical set of one-dimensional 8-point TMT basis functions. Refer to Figure 1, the neutral gray represents zero in this figure, white represents positive amplitudes and black represents negative amplitudes. An image contains low, medium and high frequency components. The low frequency signal corresponds to slowly varying color, whereas the high frequencies represent the detail within the image information. Intuitively, low frequencies are more important to create a good representation of an image and the higher frequencies can largely be ignored to a certain degree. The human eye is high sensitive to low frequencies distortions rather than to high frequencies. The process of image reconstruction from its moments is provided as follows:
, (7)
for m = 0, 1, 2, ..., M-1 and n = 0, 1, 2, ..., N-1
where , denotes the reconstructed intensity distribution. Tchebichef moment transform has its own advantage in image processing which has not been fully explored. The discrete orthogonal Tchebichef polynomial domain consists of real rational numbers unlike the continuous orthogonal transform. Discrete orthogonal Tchebichef moment is capable of performing image reconstruction exactly without any numerical errors [4]. Image reconstruction provides a measure of the feature representation capability of the moment functions.
III. EXPERIMENTAL DESIGN
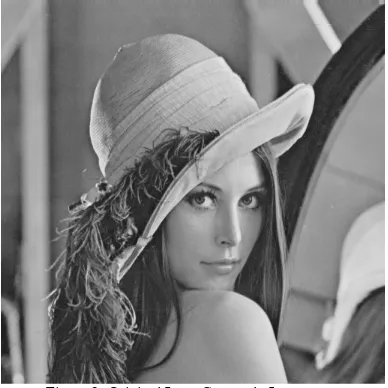
extracting the luminance channel. A psychovisual threshold on luminance channel (Y) of the image is investigated and analyzed in this experiment. A sample image used in this experiment is shown in Figure 2.
Figure 2. Original Lena Grayscale Image.
A. Moment Coefficient
This section provides a compact representation of the moment coefficient and the inverse moment coefficient. The block size is taken to be 8. Based on the discrete orthogonal moments as defined in (2)-(6) above, a kernel matrix is given as follows:
(8)
The kernel matrix values of orthogonal Tchebichef polynomials are shown in Table III.
TABLE III
THE KERNEL MATRIX VALUE OF 8×8ORTHOGONAL TCHEBICHEF
POLYNOMIALS
0.1250 0.1250 0.1250 0.1250 0.1250 0.1250 0.1250 0.1250 -0.3333 -0.2381 -0.1429 -0.0476 0.0476 0.1429 0.2381 0.3333 0.4444 0.0635 -0.1905 -0.3175 -0.3175 -0.1905 0.0635 0.4444 -0.4525 0.3232 0.4525 0.1939 -0.1939 -0.4525 -0.3232 0.4525 0.3879 -0.7203 -0.1662 0.4987 0.4987 -0.1662 -0.7203 0.3879 -0.2917 0.9586 -0.7085 -0.6252 0.6252 0.7085 -0.9586 0.2917 0.1970 -0.9851 1.7732 -0.9851 -0.9851 1.7732 -0.9851 0.1970 -0.1212 0.8487 -2.5461 4.2435 -4.2435 2.5461 -0.8487 0.1212
The image block matrix by with , denotes the intensity value of the pixel:
, , ,
, , ,
,
,
,
,
,
,
(9)
The matrix of moments is defined using S=8 in (1) above as follows:
(10)
This process is repeated for every block in the original image to generate the Tchebichef moments. The inverse moments relation used to reconstruct the image block from the above moments is as follows:
(11)
where denotes the matrix image of the reconstructed intensity value.
B. Moment Order
In general, moment order describes the numeric quantities at some distance from a reference point or axis [11]. The use of moments for image analysis is to characterize an image segment and to extract properties that have similar analogies in statistics and mechanics. Each 8×8 block image is arranged in a linear order of the moment coefficient. The implementation of moment order by where S=8 for TMT is as provided below:
, , ,
, , ,
,
,
,
,
,
,
(12)
A set of moments can thus form a global shape descriptor of an image. The geometric moment of a different order represents different spatial characteristics of the image intensity distribution. The moment of order zero m(0,0) represents the total intensity of an image [12]. The first order function m(1,0) and m(0,1) provides the intensity moment about the y-axis and x-axis of the image respectively. The second order moments (m(2,0), m(1,1) and m(0,2)) can be used to determine several useful image features such as the principal axes and the image ellipse [11]. Moment coefficients on each order are incremented one by one up to the original TMT quantization value [13] from order zero to order fourteen.
C. TMT Quantization Table
The principle of quantization is to estimate the variance of coefficient transform and gives more bits to the coefficient with larger variance. The quantization table is constructed to set an optimum allocation of bits and visual threshold of the human eye. The quantization table luminance for TMT is defined mathematically as follows:
= (13)
visually significant. The quantization values are to estimate the variance of the coefficient transform and to assign as a psychovisual threshold of the human eye.
IV. NEW DESIGN ON QUANTIZATION TABLE BASED ON
RECONSTRUCTION ERROR
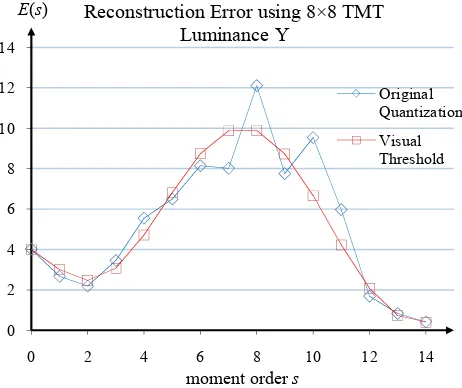
An image is divided into the 8×8 size blocks pixels and each sub-block of the image data is transformed into a two-dimensional TMT. Then, TMT coefficients are incremented one by one for each moment order. The TMT coefficients are incremented up to value from the original TMT quantization table for luminance [13]. The contribution of each TMT coefficient is evaluated from the image reconstruction error. The image reconstruction error is visualized in Figure 3 against the moment order on 40 natural grayscale images.
Figure3. Average reconstruction error of an increment on TMT coefficient for 40 natural grayscale images.
The blue curve represents the average image reconstruction error based on the original TMT quantization table value of each order. A psychovisual threshold for TMT basis function is produced by a smooth curve transition of the reconstruction error. This ideal psychovisual threshold is depicted as the red curve. The smooth curve of the reconstruction error is then interpolated by a simple polynomial that represents a psychovisual threshold of the image. The psychovisual threshold for TMT basis function is given as follows:
. . .
. . . (14)
for x = 0, 1, 2, ..., 14 and x represents moment order. A quantization matrix from psychovisual threshold is generated for TMT luminance as follows:
= (15)
Based on the principles of psychoacoustics, it can be stressed that human receptor is more sensitive to changes in (low order frequency) sound such as a whisper. This psychovisual model takes into consideration on the human eye which is more sensitive to any changes at low frequency signal than at high frequency signals. The two-dimensional visualization of a new TMT quantization table for luminance is depicted in Figure 4 where a blue curve represents the original TMT quantization table for luminance [13] and a red curve represents a new quantization table from a psychovisual threshold.
Figure 4. Two-Dimensional Visualization of TMT Quantization Table for Luminance.
V. TMTIMAGE COMPRESSION
In order to measure the performance of a new quantization table design, the generation of a new quantization table from psychovisual threshold shall be applied to baseline coding on TMT image compression. For each sub-block image size of 8×8, the first coefficient is DC and the other 63 coefficients are AC coefficients. The average bit length for DC and AC coefficient of Huffman codes shall be computed.
D. Huffman Coding
Huffman coding is a coding technique to produce the shortest possible average code length of the source symbol set and the probability of occurrence of the symbols [14]. Using these probability values, a set of Huffman code of the symbols can be generated from a Huffman Tree. Next, the average bit length score is calculated to find the average bit length of DC and AC coefficients. The average bit length of Huffman code based on TMT quantization table [13] and the proposed new quantization generation from psychovisual threshold for TMT basis function are shown in Table IV and Table V.
TABLE IV
8×8 TMT quantization table using psychovisual threshold DC luminance 4.7660 4.7660
AC luminance 1.7679 1.7642 0
Reconstruction Error using 8×8 TMT Luminance Y
TMT Quantization Table for Luminance
TABLE V
AVERAGE BIT LENGTH OF HUFFMAN CODE ON GRAYSCALE IMAGE
COMPRESSION USING TMT FOR 40GRAPHICAL IMAGES
Image Measurement
8×8 TMT quantization table
8×8 TMT quantization table using psychovisual threshold DC luminance 4.9000 4.9000
AC luminance 2.3588 2.3554
The average bit length of DC luminance produces same value because the quantization table value for DC coefficient is not changed.
E. Image Quality Assessment
In order to measure the quality of the reconstructed grayscale image, the Full Error is used and calculated to analyze image reconstruction error. The image reconstruction error shall be calculated by obtaining the differences between reconstruction grayscale image , and original grayscale image , .The image reconstruction error can be defined as follows:
| , , | (16)
where the original image size is N×N and the grayscale image is represented by using 8 bits. Another convenient measurement is the Means Squared Error (MSE) which calculates the average of the square of the error. The MSE is defined as follows:
, , (17)
For evaluation of the proposed new quantization table for grayscale image, Peak Signal to Noise Ratio (PSNR) is used as an objectives measurement for the quality image assessment. A higher PSNR means that the reconstruction is higher in quality. The PSNR is defined as follows:
log
√ (18)
where is the maximum possible pixel value of the image. In this experiment, the sample image is represented by using 8-bits grayscale image. The experiment result of reconstruction image using TMT quantization table [13] and new quantization generation based on psychovisual threshold for TMT basis function are shown in Table VI and Table VII.
TABLE VI
THE AVERAGE IMAGE RECONSTRUCTION ERROR SCORES FOR 8×8TMT
ON 40REAL IMAGES
Image Measurement
8×8 TMT quantization table
8×8 TMT quantization table using psychovisual threshold Full Error 4.1581 4.1481
MSE 34.9288 34.6683 PSNR 33.3101 33.3208
TABLE VII
THE AVERAGE IMAGE RECONSTRUCTION ERROR SCORES 8×8TMT ON
40GRAPHICAL IMAGES
Image Measurement
8×8 TMT quantization table
8×8 TMT quantization table using psychovisual threshold Full Error 3.4685 3.4205
MSE 31.5564 30.3351 PSNR 34.1727 34.2997
Figure5. Original grayscale Lena image zoomed in to 400% (left) and the output image from DCT standard JPEG quantization (right).
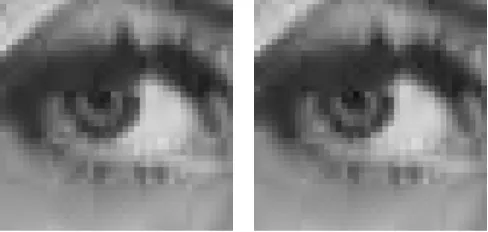
Figure 6. The comparison between TMT quantization table (left) and psychovisual threshold as represents new quantization table for TMT
(right) zoomed in to 400%.
In order to observe the visual performance of a new quantization table from psychovisual threshold for 8×8 TMT basis function, the image reconstruction of Lena right eye is zoomed in to 400% as presented on the left of Figure 5. The experiment results of image compression via original TMT quantization table for luminance [13] and a new quantization table in (15) are shown in Figure 6.
VI. DISCUSSION
A quantitative experimental of psychovisual threshold for 40 natural and 40 graphical grayscale image have been conducted. Default TMT image compression produces clearer and smoother the white eye ball surface than JPEG compression on the right of Figure 5. JPEG compression produces ripple effect on the white eye. The new quantization table on TMT image compression produces brighter pupil on Lena right eye than the previously proposed default quantization table.
A new design quantization matrices based on psychovisual threshold has performed in term of average bit length of Huffman code and reconstruction error in Table IV, Table V, Table VI and VII. It has been observed from the experiment that the reconstruction error from TMT is relatively and equally distributed among the orders of image signals. The performance of TMT image compression using a new quantization table generation based on psychovisual better than the original TMT image compression.
VII.CONCLUSION
The concept of a psychovisual threshold has been introduced to TMT image compression. A frequency just noticeable difference of compressed image from the original image has been measured by incrementing TMT coefficient one by one for each order. The contribution TMT coefficient has been analyzed to exploit psychovisual threshold of the luminance channel on TMT basis functions. A psychovisual threshold is used to estimate the limited sensitivity of human eye to the image signal. The experimental results show that an ideal psychovisual threshold on TMT basis functions provides an improvement of generate a better quantization table. A new quantization table from psychovisual threshold produces better image reconstruction and lower average bit-length of Huffman codes than the previously proposed quantization table.
ACKNOWLEDGMENT
The authors would like to express a very special thanks to Ministry of Higher Education (MOHE), Malaysia for providing financial support for this research project by Fundamental Research Grant Scheme (FRGS/2012/FTMK/SG05/03/1/F00141).
REFERENCES
[1] R. Strenberg. Cognitive Psychology. Third Edition, Thomson Wadsworth, 2003.
[2] G. Zhai, X. Wu, X. Yang, W. Lin and W. Zhang, "A Psychovisual Quality Metric in Free-Energy Principle," IEEE Transaction on Image Processing, Vol. 21, No. 1, Jan. 2012, pp. 041-052.
[3] R. Mukundan, S.H. Ong and P.A. Lee, “Image Analysis by Tchebichef Moments,” IEEE transaction on Image Processing, Vol. 10, No. 9, Sep. 2001, pp. 1357-1364.
[4] N.A. Abu, N. Suryana and R. Mukundan, “Perfect Image Reconstruction Using Discrete Orthogonal Moments,” Proceeding of The 4th International Conference on Visualization, Imaging and Image Processing (VIIP2004), Sep. 2004, Marbella, SPAIN, pp. 903-907. [5] F. Ernawan, N. A. Abu and H. Rahmalan, “Tchebichef Moment
Transform on Image Dithering for Mobile Applications,” Proceeding of the SPIE, Vol. 8334, Apr. 2012, pp. 83340D-83340D-5.
[6] H. Rahmalan, F. Ernawan and N.A. Abu, “Tchebichef Moment Transform for Colour Image Dithering” 4thInternational Conference on
Intelligent and Advanced Systems (ICIAS 2012), June 2012, pp. 866-871.
[7] N.A. Abu, W.S. Lang, and S. Sahib, “Image Projection Over The Edge,”
Proceedings 2nd International Conference on Computer and Network Technology (ICCNT2010), Apr. 2010, pp. 344-348.
[8] F. Ernawan, E. Noersasongko and N.A. Abu “An Efficient 2x2 Tchebichef Moments for Mobile Image Compression,” International Symposium on Intelligent Signal Processing and Communication System
(ISPACS 2011), Dec. 2011, pp. 001-005.
[9] W.S. Lang, N.A. Abu, and H. Rahmalan, “Fast 4x4 Tchebichef Moment Image Compression. Proceedings International Conference of Soft Computing and Pattern Recognition (SoCPaR2009), Dec. 2009, pp. 295-300.
[10] H. Rahmalan, N. A. Abu and W.S. Lang, “Using Tchebichef Moment for Fast and Efficient Image Compression,” Pattern Recognition and Image Analysis, Vol. 20, No. 4, Mar. 2010, pp. 505-512.
[11] R.J. Prokop, A.P Reeves, A Survey of Moment-Based Techniques for Unoccluded Object Representation and Recognition, CVGIP: Graphical Models and Image Process. Vol. 54, No. 5, 1992, pp. 438-460.
[12] R. Mukundan and K.R. Ramakrishnan. Moment Functions in Image Analysis: theory and Applications. World Scientific,1998, pp. 12. [13] N.A. Abu, W.S. Lang, N. Suryana, and R. Mukundan, “An Efficient
Compact Tchebichef moment for Image Compression,” 10th
International Conference on Information Science, Signal Processing and their applications (ISSPA2010), May 2010, pp. 448-451.