http://dx.doi.org/10.12988/ams.2014.48616
Psychovisual Threshold on Large Tchebichef
Moment for Image Compression
Nur Azman Abu
Faculty of Information and Communication Technology Universiti Teknikal Malaysia Melaka, Melaka 76100, Malaysia
Ferda Ernawan
Faculty of Information and Communication Technology Universiti Teknikal Malaysia Melaka, Melaka 76100, Malaysia
and
Faculty of Computer Science, Universitas Dian Nuswantoro Semarang 50131, Indonesia
Copyright ©2014 Nur Azman Abu and Ferda Ernawan. This is an open access article distributed under the Creative Commons Attribution License, which permits unrestricted use, distribution, and reproduction in any medium, provided the original work is properly cited.
Abstract
JPEG standard transforms an 8×8 image pixel into a frequency domain. The discontinuities of the intensity image between adjacent image blocks cause the visual artifacts due to inter-block correlations in image reconstruction. The blocking artifacts appear by the pixel intensity value discontinuities which occur along block boundaries. This research proposes the psychovisual threshold on large Tchebichef moment to minimize the blocking artifacts. The psychovisual threshold is practically the best measure for the optimal amount of frequency image signals in the image coding. The psychovisual threshold is a basic element prior to generating quantization tables in image compression. The psychovisual threshold on the large Tchebichef moments has given significant improvements in the quality of image output. The experimental results show that the smooth psychovisual threshold on the large discrete Tchebichef moment produces high quality image output and largely free of any visual artifacts.
1 Introduction
The JPEG image compression implements a basic 8×8 block transform coding. The block transform coding suffers noticeable quality image degradations near boundary blocks causes blocking artifact [1]. The most noticeable degradations on the block transform coding are often visually observable at high compression ratios [2]. Since the 8×8 blocks of image pixels are encoded separately, the correlation among spatially adjacent blocks provides boundary blocks when the image is reconstructed [3]. The block-size on the transform coding gives a significant effect to the quality of image compression. This experiment mainly focuses the block-size of the discrete transform and an optimal quantization values assigned to the frequency image signals. Previously, a psychovisual threshold has been investigated on 8×8 Tchebichef image compression [4]. In this paper, the same concept of the psychovisual threshold on 8×8 Tchebichef moments is adopted to develop the psychovisual threshold on 256×256 Tchebichef moment in image compression. The smooth psychovisual threshold is an input to generating 256×256 Tchebichef quantization table for lossy image compression. In this paper, the large 256×256 Tchebichef Moment Transform (TMT) has been chosen here since TMT has not been practically explored on large image compression. TMT has been widely used in various image processing applications. For examples, they are used in image watermarking [5], image compression [6-10] and image dithering [11].
2 Orthonormal Tchebichef Moment Transform
2
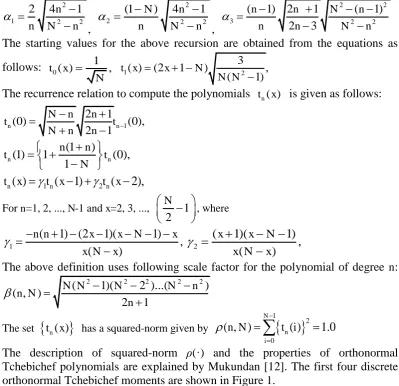
The recurrence relation to compute the polynomials tn( )x is given as follows:
(1 )
The above definition uses following scale factor for the polynomial of degree n:
2 2 2 2 2 Tchebichef polynomials are explained by Mukundan [12]. The first four discrete orthonormal Tchebichef moments are shown in Figure 1.
The inverse TMT image reconstruction from its moments is given as follows: distribution and M N, denote the maximum order of moments being used.
3 Experimental Designs
In this quantitative experiment, 80 images (24-bit RGB with 512×512 pixels) [13] are chosen to be tested and analyzed in order to develop psychovisual threshold in image compression. In past project work, psychovisual threshold has been investigated on 8×8 discrete transform [14-16]. First, the sample RGB image is converted into YCbCr colour space. An image is divided into the 256×256 block of image pixels. Each block of the image pixels is transformed by a two-dimensional 256×256 TMT. Based on the discrete orthonormal Tchebichef moments above, a compact representation of the moment coefficient K(S×S) is frequency coefficient. The inverse moment relation of the reconstructed block image from the above moments is given as follows:
(256 256) (256 256) (256 256) (256 256) T
G K T K
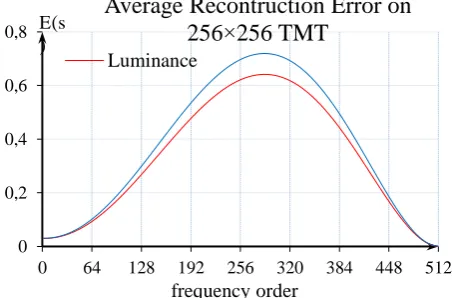
The average reconstruction error is set as a smooth curve for a given frequency order zero to the maximum frequency order 510. An ideal smooth curve of average reconstruction error has been set as the psychovisual threshold. The ideal smooth curve is designed to give an optimal balance between the quality of the image output and the compression rate. The ideal average reconstruction error of incrementing 256×256 TMT coefficients for luminance and chrominance is shown in Figure 2. The ideal curve of average reconstruction error for a given frequency order 0 to frequency order 510 for luminance channel is visualized by a red curve, whereas for chrominance channel is depicted by a blue curve.
Figure 2. Average reconstruction error of incrementing TMT coefficients on 256×256 TMT luminance and chrominance for 40 real images
The x-axis represents frequency order and y-axis represents average reconstruction error. These curves are then interpolated by polynomial functions for luminance fML and chrominance fMR as follows: thresholds are used to generate finer 256×256 TMT quantization values on each frequency order. Due to the large size of their new 256×256 quantization values, it is not possible to present the whole quantization matrix within a limited space in this paper. Therefore, the indexes 256×256 quantization values are presented by traversing the quantization table on each frequency order in a zigzag pattern as shown in Table 1. The finer 256×256 TMT quantization values for luminance and chrominance channels on each frequency order are shown in Table 2 and Table 3 respectively. The finer 256×256 TMT quantization tables are listed as a traversing array in a zigzag pattern. A large 256×256 quantization table consists of frequency order zero to the maximum of frequency order 510.
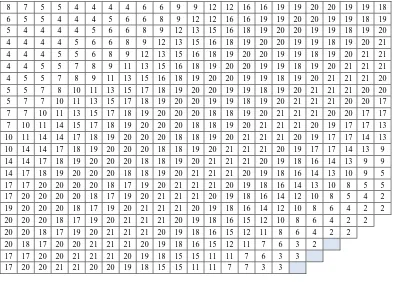
Table 1. The index of quantization values for each frequency order
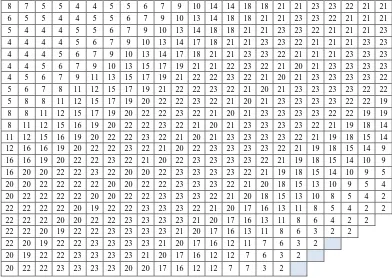
Table 2. The TMT quantization values for each frequency order on luminance
Table 3. The TMT quantization values for each frequency order on chrominance
8 7 5 5 4 4 5 5 6 7 9 10 14 14 18 18 21 21 23 23 22 21 21 6 5 5 4 4 5 5 6 7 9 10 13 14 18 18 21 21 23 23 22 21 21 21 5 4 4 4 5 5 6 7 9 10 13 14 18 18 21 21 23 23 22 21 21 21 23 4 4 4 4 5 6 7 9 10 13 14 17 18 21 21 23 23 22 21 21 21 23 23 4 4 4 5 6 7 9 10 13 14 17 18 21 21 23 23 22 21 21 21 23 23 23 4 4 5 6 7 9 10 13 15 17 19 21 21 22 23 22 21 20 21 23 23 23 23 4 5 6 7 9 11 13 15 17 19 21 22 22 23 22 21 20 21 23 23 23 23 22 5 6 7 8 11 12 15 17 19 21 22 22 23 22 21 20 21 23 23 23 23 22 22 5 8 8 11 12 15 17 19 20 22 22 23 22 21 20 21 23 23 23 23 22 22 19 8 8 11 12 15 17 19 20 22 22 23 22 21 20 21 23 23 23 23 22 22 19 19 8 11 12 15 16 19 20 22 22 23 22 21 20 21 23 23 23 23 22 21 19 18 14 11 12 15 16 19 20 22 22 23 22 21 20 21 23 23 23 23 22 21 19 18 15 14 12 16 16 19 20 22 22 23 22 21 20 22 23 23 23 23 22 21 19 18 15 14 9 16 16 19 20 22 22 23 22 21 20 22 23 23 23 23 22 21 19 18 15 14 10 9 16 20 20 22 22 23 22 20 20 22 23 23 23 23 22 21 19 18 15 14 10 9 5 20 20 22 22 22 22 20 20 22 22 23 23 23 22 21 20 18 15 13 10 9 5 4 20 22 22 22 22 20 20 22 22 23 23 23 22 21 20 18 15 13 10 8 5 4 2 22 22 22 22 20 19 22 22 23 23 23 22 21 20 17 16 13 11 8 5 4 2 2 22 22 22 20 20 22 22 23 23 23 23 21 20 17 16 13 11 8 6 4 2 2 22 22 20 19 22 22 23 23 23 23 21 20 17 16 13 11 8 6 3 2 2 22 20 19 22 22 23 23 23 23 21 20 17 16 12 11 7 6 3 2
20 19 22 22 23 23 23 23 21 20 17 16 12 12 7 6 3 2 20 22 22 23 23 23 23 20 20 17 16 12 12 7 7 3 2
There are 216 = 65536 quantization values from a 256×256 quantization table. The order 0 resides in the top left most corner of the quantization matrix order of
Q(0,0). The first order represents the quantization values of Q(1,0) and Q(0,1). The second order represents Q(2,0), Q(1,1) and Q(0,2). For each frequency order, the same quantization value is assigned to them. The finer 256×256 TMT quantization values for a given frequency order 0 to frequency order 510 are visualized in Figure 3.
Figure 3. The finer 256×256 TMT quantization tables for luminance and chrominance for image compression
0 5 10 15 20 25
0 64 128 192 256 320 384 448 512 256×256 TMT Quantization Table
Luminance Chrominance
moment order s Q(s
The smoother 256×256 TMT quantization table on the luminance channel is designed to take smaller values than chrominance channel. The investigation results show the contribution of the TMT coefficients to the reconstruction error is mainly concentrated on the middle frequency order. The effect of incrementing TMT coefficients on the middle frequency order gives a significant reconstruction error. According to Figure 3, there are two hills in the 256×256 TMT quantization tables. The impact of incrementing TMT coefficients on the middle frequency order produces a higher average reconstruction error than other frequency orders. In addition, the contribution of the TMT coefficients on the middle frequency order provides less effect to the compression rate. Therefore, the finer 256×256 TMT quantization tables from the psychovisual threshold on the middle frequency order are designed to generate lower quantization values.
4 Experimental Results
The smoother 256×256 TMT quantization tables from the psychovisual threshold are tested in image compression. The 80 images are evaluated in image compression. The 80 images are classified into 40 real images and 40 graphical images.
Table 4. Average Bit Length of Huffman Code on the Output Compressed Image from 40 Real Images and 40 Graphical Images
Method
Real Images Graphical Images
ACY ACCr ACCb ACY ACCr ACCb 8×8 JPEG Quantization Tables 2.868 2.095 2.184 2.965 2.505 2.515 8×8 TMT Quantization Tables 1.767 1.212 1.260 2.040 1.983 2.061 8×8 TMT Psychovisual
Threshold 1.764 1.166 1.191 2.027 1.625 1.745 256×256 TMT Psychovisual
Threshold 2.095 1.218 1.251 2.279 1.521 1.637
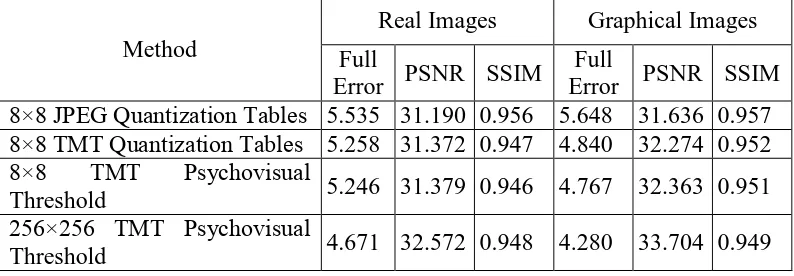
Table 5. An Image Quality Measurement on the Output Compressed Image from 40 Real Images and 40 Graphical Images
Method
Real Images Graphical Images Full
Error PSNR SSIM
Full
Error PSNR SSIM 8×8 JPEG Quantization Tables 5.535 31.190 0.956 5.648 31.636 0.957 8×8 TMT Quantization Tables 5.258 31.372 0.947 4.840 32.274 0.952 8×8 TMT Psychovisual
Threshold 5.246 31.379 0.946 4.767 32.363 0.951 256×256 TMT Psychovisual
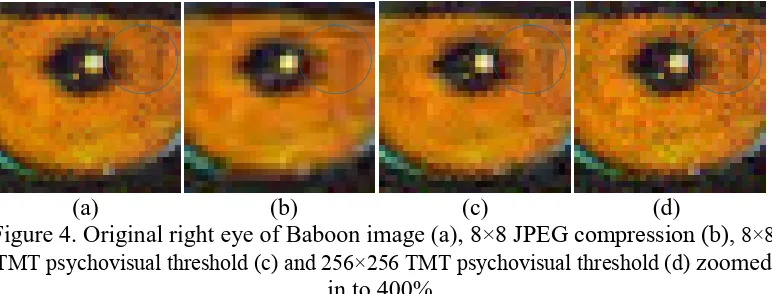
The performance of the large TMT quantization tables from the TMT psychovisual threshold is measured by average bit length of Huffman code and image quality measurement. The average bit length of Huffman code and the average image reconstruction error from the proposed finer 256×256 TMT quantization tables are shown in Table 4 and Table 5 respectively. A sample Baboon image is selected from 80 images [13] in order to analyse the visual quality of the compressed image. The right eye of the Baboon image is chosen and analysed perceptually on the rich pattern of image pixels. The visual outputs of JPEG image compression, 8×8 TMT psychovisual threshold and the proposed 256×256 TMT psychovisual threshold are projected in Figure 4. The image compression using default JPEG quantization tables through 8×8 DCT produces artifact images and blur in image output when the visual output is zoomed in to 400% as shown in Figure 4(b). The optimal 8×8 TMT quantization tables from the psychovisual threshold give a slightly better visual quality on the compressed image as depicted in Figure 4(c) than the standard JPEG image compression. However, the visual image output is still a little bit blur and carries blocking effect along the boundaries. While, the psychovisual thresholds on large TMT image compression produces largely free of the blocking artifact as shown in Figure 4(d).
(a) (b) (c) (d)
Figure 4. Original right eye of Baboon image (a), 8×8 JPEG compression (b),8×8 TMT psychovisual threshold (c) and 256×256 TMT psychovisual threshold (d) zoomed
in to 400%.
In addition, the finer 256×256 TMT quantization tables from the psychovisual threshold produce the richer texture of the Baboon right eye. The image compression using psychovisual threshold on large TMT produces significantly better visual quality on the output image than standard JPEG image compression. A visual inspection on the sample output image from the finer 256×256 TMT quantization tables points out the fact that it produces almost the same texture image pixels of the original Baboon image as shown in the blue circle.
5 Conclusions
moments for image compression. The psychovisual threshold is practically the best measure on an optimal amount of frequency image signals to be lossy encoded. This quantitative experiment shows the critical role of psychovisual threshold as a basic primitive to generate quantization table in image compression. The finer large Tchebichef quantization tables can then be generated from the psychovisual threshold. The psychovisual threshold on large Tchebichef moment has made significant improvement in the Tchebichef image compression performance. The smoother large Tchebichef quantization tables from the psychovisual threshold produce better visual quality of the output image and smaller average bit length of Huffman code than standard JPEG image compression. At the same time, the psychovisual threshold on large Tchebichef moments manages to overcome the blocking effect which often occurs in standard JPEG image compression. This psychovisual threshold is designed to support practical image compression for high fidelity digital images in the near future.
Acknowledgements. The authors would like to express a very special thanks to Ministry of Education, Malaysia for providing financial support by Fundamental Research Grant Scheme (FRGS/2012/FTMK/SG05/03/1/F00141).
References
[1] S. Lee and S.J. Park, A new image quality assessment method to detect and measure strength of blocking artifacts, Signal Processing: Image Communication, 27 (1) (2012), 031-038.
[2] J. Singh, S. Singh, D. Singh and M. Uddin, Detection method and filters for blocking effect reduction of highly compressed images, Signal Processing: Image Communication, 26 (8) (2011), 493-506.
[3] J. Singh, S. Singh, D. Singh and M. Uddin, A signal adaptive filter for blocking effect reduction of JPEG compressed images, International Journal of Electronics and Communications, 65 (10) (2011), 827– 839.
[4] F. Ernawan, N.A. Abu and N. Suryana, An optimal Tchebichef moment quantization using psychovisual threshold for image compression, Advanced Science Letters, 20 (1) (2014), 070-074.
[5] N.A. Abu, F. Ernawan, N. Suryana and S. Sahib, Image watermarking using psychovisual threshold over the edge, Information and Communication Technology, 7804 (2013), 519-527.
[7] N.A. Abu, F. Ernawan and S. Sahib, Psychovisual model on discrete orthonormal transform, International Conference on Mathematical Sciences and Statistics (ICMSS 2013), (2013), 309-314.
[8] F. Ernawan, N.A. Abu and N. Suryana, A psychovisual threshold for generating quantization process in Tchebichef moment image compression, Journal of Computers, 9 (3) (2014), 702-710.
[9] F. Ernawan, N.A. Abu and N. Suryana, Adaptive Tchebichef moment transform image compression using psychovisual model, Journal of Computer Science, 9 (6) (2013), 716-725.
[10]F. Ernawan, E. Noersasongko and N.A. Abu, An efficient 2×2 Tchebichef moments for mobile image compression, International Symposium on Intelligent Signal Processing and Communication System (ISPACS 2011), (2011), 001-005.
[11]N.A. Abu, F. Ernawan and N. Suryana, An image dithering via Tchebichef moment transform, Journal of Computer Science, 9 (7) (2013), 811-820. [12]R. Mukundan, Some computational aspects of discrete orthonormal moments,
IEEE Transactions on Image Processing, 13 (8) (2004), 1055-1059.
[13]R. Rodriguez-Sanchez, J. Martinez-Baena, A. Garrido, J.A. Garcia, J. Fdez-Valdivia, M.C. Aranda, Computer Vision Group, University of Granada, [Online], (2002), Available: http://decsai.ugr.es/cvg/dbimagenes/c512.php. [14]N.A. Abu, F. Ernawan and N. Suryana, A generic psychovisual error
threshold for the quantization table generation on JPEG image compression, 9th International Colloquium on Signal Processing and its Applications, (2013), 039-043.
[15]F. Ernawan, N.A. Abu and N. Suryana, An adaptive JPEG image compression using psychovisual model, Advanced Science Letters, 20 (1) (2014), 026-031.
[16]F. Ernawan, N.A. Abu and N. Suryana, Integrating a smooth psychovisual threshold into an adaptive JPEG image compression, Journal of Computers, 9 (3) (2014), 644-653.