An Adaptive JPEG Image Compression Using Psychovisual Model
Teks penuh
Gambar
Dokumen terkait
The traditional compression algorithms have a relatively low compression ratio and bad quality of decoded image, at present, the fractal image compression method with a
Since the discrete wavelet transform analyze image and give us lot of data about 2D signal which make the difference in the quality of reconstructed image however In case
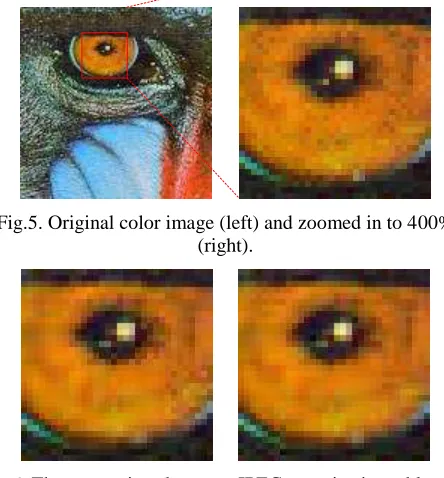
The TMT image compression using a new quantization table as shown on the right of Figure 12 shows better visual quality image output than the earlier TMT
The Quality of restored image and the Speed of Convergence of the Back propagation Neural Network were compared for both the conditions; image without mapping by
In order to retain image quality and get low complexity hardware, we adopt the recommended quantization numbers as reference and change the value of the numbers
An image processing algorithm based on threshold and extended maximum Transformation and K-means clustering technique was developed to assess the quality of sperm cells by identifying
In this research work, we have successfully analysed an efficient compression scheme to obtain better quality and higher compression ratio using wavelet transform with Set Partitioned
DISCUSSION In this study, it can be concluded that the reconstruction of images by image processing using the Autoencoder method can analyze an image and produce a new image with finer
