© 2013 Science Publications
doi:10.3844/jcssp.2013.716.725 Published Online 9 (6) 2013 (http://www.thescipub.com/jcs.toc)
Corresponding Author: Ferda Ernawan,Department of Software Engineering, Faculty of Information and Communication Technology, Universiti Teknikal Malaysia Melaka, Melaka, Malaysia
ADAPTIVE TCHEBICHEF MOMENT TRANSFORM
IMAGE COMPRESSION USING PSYCHOVISUAL MODEL
1,2
Ferda Ernawan,
1Nur Azman Abu and
1Nanna Suryana
1
Department of Software Engineering, Faculty of Information and Communication Technology, Universiti Teknikal Malaysia Melaka, Melaka, Malaysia
2
Department of Information Technology, Faculty of Computer Science, Universitas Dian Nuswantoro, Semarang, Indonesia
Received 2013-01-12, Revised 2013-03-28; Accepted 2013-06-01
ABSTRACT
An extension of the standard JPEG image compression known as JPEG-3 allows rescaling of the quantization matrix to achieve a certain image output quality. Recently, Tchebichef Moment Transform (TMT) has been introduced in the field of image compression. TMT has been shown to perform better than the standard JPEG image compression. This study presents an adaptive TMT image compression. This task is obtained by generating custom quantization tables for low, medium and high image output quality levels based on a psychovisual model. A psychovisual model is developed to approximate visual threshold on Tchebichef moment from image reconstruction error. The contribution of each moment will be investigated and analyzed in a quantitative experiment. The sensitivity of TMT basis functions can be measured by evaluating their contributions to image reconstruction for each moment order. The psychovisual threshold model allows a developer to design several custom TMT quantization tables for a user to choose from according to his or her target output preference. Consequently, these quantization tables produce lower average bit length of Huffman code while still retaining higher image quality than the extended JPEG scaling scheme.
Keywords: Adaptive Image Compression, TMT Quantization Tables, Tchebichef Moments, Psychovisual Error Threshold
1. INTRODUCTION
An adaptive image compression controls the quality image output and the rate of compression through scaling the quantization values. This approach has been implemented in the extension of JPEG image compression known as JPEG-3. The default quantization table of JPEG compression gives a good basic but rigid compression. There is a need to provide some flexibility to adjust the quality of output images based on user preference. The most popular technique to obtain an adaptive quality on compressed image output is by scaling the quantization tables from given quality factor QF. Scaling the quantization tables change the overall quantization values uniformly. The output quality on the compressed image may not be optimal. This study will
propose a set of quantization tables for an adaptive compression. These tables shall be generated based on a psychovisual threshold scheme according to the target output quality of compressed image.
require any numerical approximation, thus gives rise to more accurate image feature representation. The orthogonal basis is directly mapped on the discrete domain of the image coordinate space. In order to extend TMT image compression, this study examines an adaptive TMT image compression based on psychovisual model.
1.1. Tchebichef Moment Transform
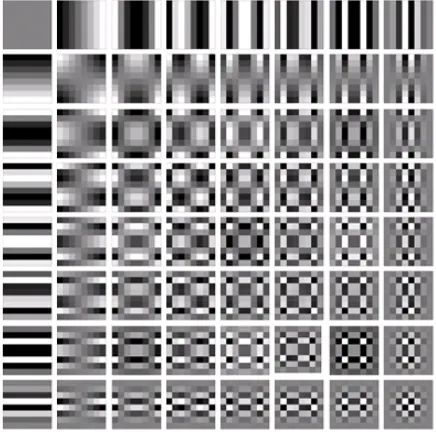
TMT is a two-dimensional transform based on discrete orthogonal Tchebichef polynomials which provides compact support on graphical and real images. TMT has been shown to have better image representation capability than the continuous orthogonal moments (Shu et al., 2010). TMT integrates a simplified mathematical framework technique using matrix; this advantage makes easily computation using a set of recurrence relations (Huang et al., 2010). TMT has unit weight and algebraic recurrence relations involving real coefficients. TMT algorithm reduces computational complexity as measured in terms of the number of arithmetic operations while keeping the accuracy of the reconstructed images. TMT is capable of performing image reconstruction exactly without any numerical errors. The TMT basis function is shown in Fig. 1.
Figure 1 shows the 2-dimensional basis function of TMT. There are 64 two dimensional TMT basis functions that are generated by multiplying a horizontal against vertical set of one-dimensional 8-point TMT basis functions. The neutral gray represents zero in this figure, white represents positive amplitudes and black represents negative amplitudes. The low frequencies reside in the top left most corner of the spectrum, while the high frequencies are in bottom right most corner. For each row, the frequency in this case called moment order of the TMT basis functions is increasing in horizontal directions from top to bottom. While the moment order of the TMT basis functions for columns is increasing for every vertical column from left to right. The digital image tends to have a compact representation in frequency domain around the low frequencies. For a given set {tn (x)} of input value (image intensity values)
of size N = 8, the forward discrete orthogonal Tchebichef Moments of order m + n is given as follows Equation 1:
m n position (x,y) in the optimal image. Tchebichef moments are defined based on a set of kernel function tn(x) as the
following recursive relations Equation 2-4:
0 of degree n Equation 5:
n
β(n, N) = N (5)
The set {tn(x)} has a squared-norm given by Equation 6:
{
}
reconstructed intensity distribution. Image reconstruction provides a measure of the feature representation capability of the moment functions.1.2. Quantization Tables
Fig. 1. 8×8 TMT basis function
1.3. Quality Factor
An adaptive JPEG compression using quality factor has been widely used to determine the image quality and compression bit rate. The quality of compressed image can be controlled by scaling the quantization table value by a quality factor. Quality factor is used to scale the quantization table by a weighting factor q as given as follows (Luo et al., 2010) Equation 8 and 9:
50
q = for QF < 50
QF (8)
QF
q = 2 - for 50 QF < 100
50 ≤ (9)
The scaling quantization table value by quality factor will change overall uniform quantization matrix, however, it may not produce an optimal output quality on compressed image without considering its perceptual effects on human visual system. The quantization table represents tolerance of the visibility of human visual system. The scaling quantization tables suppose to be difference between low frequency coefficients and high frequency coefficients. Human visual system is highly sensitive to low frequency signals than high frequency. The visual information of image representation resides mostly in low frequency coefficients. In order to get the best performance, the
quantization table generation may need to be designed based on human visual systems.
1.4. Psychovisual Error Threshold
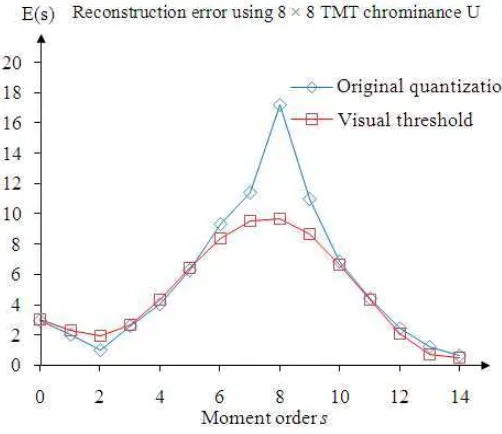
A quantitative experimental investigates the effect of an increment on TMT coefficients one by one. This experiment has been implemented and tested on 40 natural and 40 graphical 512×512 raw images. The effect of incremented moment coefficients are calculated by image reconstruction error scores. We measure the threshold for visibility of a given TMT basis function for both good quality image reconstruction and the bit rate of compressed image. The threshold is generated based on image reconstruction error by increment the coefficient transformed one by one. The image reconstruction error based on the maximum value of quantization tables (Abu et al., 2010) from an order zero to the order fourteen produce a curve. The average reconstruction error of an increment moment coefficient on luminance (Y) and Chrominance (U) for 40 natural images are shown in Fig. 2 and 3. The blue diamond curve represents image reconstruction error based on a maximum quantization table value. In order to produce a psychovisual threshold, the new average designed reconstruction error is to get a smoothed curve which results in an ideal curve of average error scores. An ideal psychovisual threshold for luminance and chrominance is represented by a red square curve.
Based on the principles of the Weber’s law, the human eye has high sensitivity at low intensity levels and greatly reduced sensitivity at high intensity levels. Human eye has a non linear response to changes in intensity that is inversely proportional to the average intensity. This psychovisual threshold takes into consideration on the human eyes which is more sensitive to low order image than to constant image patterns. According to HVS characteristics, the low frequency order of custom quantization table design should not be changed. A slight change in the low frequency order of quantization table design would cause a larger distortion which can be perceived by human visual system. This sensitivity represents the threshold of human visual system at low order signals.
Fig. 2. Average reconstruction error of an increment on TMT basis function for 40 natural color images
Fig. 3. Average reconstruction error of an increment on TMT basis function for 40 natural color images
With reference to Fig. 2 and 3, the authors propose a psychovisual threshold for TMT basis function for luminance fML and chrominance fMR of quantization
table which are defined as follows Equation 10 and 11:
6 5
4 3 2
ML
f (x) = -0.00009895x + 0.0045x
-0.07129x + 0.4354x - 0.6352x - 0.737x + 4
(10)
6 5
MR
4 3 2
f = -0.00008.837x + 0.0041x
-0.0661x + 0.4111x - 0.6368x - 0.4389x + 3 for x 0, 1, 2,...,14
(x)
=
(11)
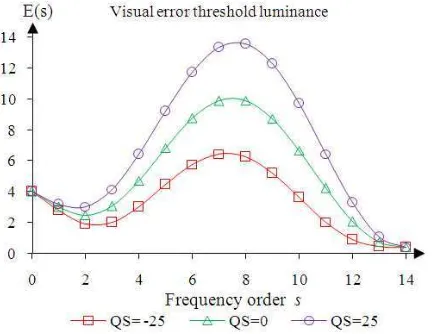
1.5. Adaptive Psychovisual Error Threshold
compression rate with best quality image compression based on user preferences of low, medium and high quality. Each polynomial of these functions in Equation 10 and 11 are given variables weight or quality scale QS values. The psychovisual threshold basic curve provides an optimal custom quantization table generation for an adaptive TMT image compression. The authors purpose an adaptive psychovisual threshold as a function threshold as follows:
f (x) = (-0.00009895 - 0.000000292α)x
+(0.0045 - 0.000005α)x - (0.07129
-(0.6368 - 0.0032α)x (0.4389 - 0.00232α)x + 3 forx 0, 1, 2,...,14.
(x)
=
(13)
The value of α represents quality scale QS from -25 into 25 based on user preference to generate the custom quantization tables. These functions in Equation 12 and 13 are the adaptive psychovisual error thresholds for luminance and chrominance respectively as shown in
Fig. 4. Average reconstruction error of an increment on TMT coefficient Luminance for 40 natural color images with QS = -25, 0 and 25
Fig. 5. Average reconstruction error of an increment on TMT coefficient Chrominance for 40 natural color images with QS = -25, 0 and 25
For an adaptive JPEG compression, the quantization steps are defined as follow by rounding to the nearest integer Equation 17:
q
JPG A(u,v) A (u,v) Round
Q (u,v) q
=
⋅
(17)
where, A is the DCT coefficient, Q is the quantization table and q is scale factor upon the quantization value. For the proposed an adaptive TMT image compression, the quantization steps are given as follows Equation 18:
q
TMT
T(u, v) T (u, v) = Round
Q (u, v)
(18)
where, QTMT(u, v) represents the new quantization table
based on psychovisual thresholds in Equation 12 and 13. The most quantized high frequency coefficients are mostly zeros. Next, the quantized DC coefficients are separated from the quantized AC coefficients.
coefficients. The basis for this coding is a code tree which assigns short code words to symbols frequently used and long code words to symbols rarely used for both DC and AC coefficients; each symbol is encoded with a variable length code from the Huffman table (Vidyavathi and Sabeenian, 2012).
Huffman tables used during the compression process are stored as header information in the compressed image file in order to uniquely decode the coefficients during the decompression process. The average bit lengths of Huffman code of adaptive image compressions based on psychovisual error threshold are given in Table 1-3.
1.7. Evaluation Measurement
The experimental results can be measured by several image compression parameters. The evaluation of adaptive TMT image compression here uses full error, Means Squared Error (MSE), Peak Signal Noise to Ratio (PSNR) and Structural Similarity Index Matrix (SSIM). The image reconstruction error can be defined as follows Equation 19:
where, the original image size is M×N and k is the third index refers to the three RGB colors. The MSE calculates the average of the square of the error which defined as follows Equation 20 (Hore and Ziou, 2010):
M -1 N-1 2
2
i =0 j= 0 k = 0
MSE =
∑∑∑
g(i, j, k) - f(i, j, k) (20)The PSNR is defined as follows Equation 21:
2
image. For evaluation of the compression rate, the total bit of the original image 24-bit with 512×512 pixel is divided by the average bit of compressed image. Generally, the compression rate before Huffman coding is computed as follows Equation 22 (Sahami and Shayesteh, 2012):
24 × M × N CR =
L (22)
Table 1. Average bit length of Huffman code of JPEG compression with QF = 75 and TMT image compression using an adaptive psychovisual threshold with QS = -25
JPEG TMT image Huffman code images images images images DC Luminance 6.3715 5.9680 4.7660 4.8997 compression with QF = 50 and TMT image compression using an adaptive psychovisual threshold with QS = 0
JPEG image TMT image Huffman code images images images images DC Luminance 5.7468 5.5237 4.7660 4.9000 compression with QF = 25 and TMT image compression using an adaptive psychovisual threshold with QS = 25
where, 24 means that 24-bit of original RGB image, M × N is the original image size and L is total number of bits assigned prior to entropy coding. Another measurement quality image is SSIM, which is a method to measure quality by capturing the similarity of images (Yim and Bovik, 2011). The SSIM is defined as follows Equation 23:
α β γ
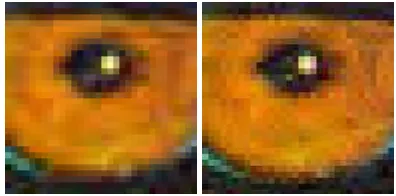
SSIM(x, y) = [l(x, y)] .[c(x, y)] .[s(x, y)] (23) where, α>0, β>0, γ>0, are parameters to adjust the relative importance of the three components. The detail description is given in (Yim and Bovik, 2011). The comparison of the quality of image reconstruction between the extended JPEG image compression and adaptive TMT image compression is shown in Table 4-6. The compression ratio score of adaptive TMT image compression are given in Table 7. In order to visually observe the performance of this technique, the original image zoomed in to 400% as depicted on the right of Fig. 6. The experiment results of an adaptive TMT image compression using psychovisual threshold are shown on the right of Fig. 7-9.
Table 4. The average image reconstruction error score of JPEG compression with QF = 75 and TMT image compression using an adaptive psychovisual threshold with QS = -25 measurement images images images images Full error 4.4492 4.1551 4.4330 3.6499 MSE 45.0920 52.3127 39.0560 36.2067 PSNR 33.4415 33.5977 32.9026 33.7515 SSIM 0.9739 0.9815 0.9568 0.9696
Table 5. The average image reconstruction error score of JPEG compression with QF = 50 and TMT image compression using an adaptive psychovisual threshold with QS = 0 measurement images images images images Full error 5.5349 6.1479 5.2457 4.6034 MSE 70.9636 113.8333 57.4476 62.5665 PSNR 31.1903 29.7903 31.3790 31.6478 SSIM 0.9557 0.9541 0.9462 0.9599
Table 6. The average image reconstruction error score of JPEG compression with QF = 25 and TMT image compression using an adaptive psychovisual threshold with QS = 25 measurement images images images images Full error 6.8019 7.9809 5.7927 5.3162 using an adaptive psychovisual threshold
JPEG TMT image
Fig. 6. Original color image (left) and zoomed in to 400% (right)
Fig. 8. The comparison between JPEG quantization table with QF = 50 (left) and TMT psychovisual threshold with QS = 0 (right) zoomed in to 400%
Fig. 9. The comparison between JPEG quantization table with QF = 25 (left) and TMT psychovisual threshold with QS = 25 (right) zoomed in to 400%
2. DISCUSSION
The comparative performances of the adaptive JPEG image compression using scaling quality factor and the proposed adaptive TMT image compression are discussed. In this study, we investigate the sensitivity TMT basis function by measuring the reconstruction error to represent the visibility of HVS. The contribution of the performance of custom psychovisual threshold for TMT basis function is used to generate custom quantization tables.
The experimental results are provided to validate the quantization tables based on an adaptive psychovisual model to the output compressed image. In order to observe the visual quality of an adaptive TMT image compression based on psychovisual threshold, the reconstructed baboon image is zoomed in to 400%. The experimental results have shown that an adaptive TMT image compression can provide significantly better image reconstruction than JPEG image compression at various quality factors.
Some viewer may find that JPEG compression produces bad artifacts when scaling with quality factor = 25 as depicted on the left of Fig. 9. However, the visual quality of TMT image compression using visual threshold
is largely free of those defects as shown on the right of
Fig. 9. Even as the bit rate gets higher, an adaptive TMT image compression presents without introducing objectionable artifacts. The results of an adaptive TMT image compression with quality scale QS = -25 as depicted on the right of Fig. 7 produce closer image toward the original image at minimum average bit length of Huffman code.
The experimental results show the new TMT quantization tables generation based on psychovisual error thresholds produce better image compression in quality image reconstruction at lower average bit length of Huffman code. The psychovisual threshold for quantization table generation offers an effective and optimal the quantization tables for image compression.
3. CONCLUSION
This study proposes a novel adaptive psychovisual error threshold for TMT basis function. These thresholds are used to generate the custom quantization tables for adaptive TMT image compression. The experimental results show an adaptive TMT image compression based on psychovisual model performs better than JPEG compression in term of image visual quality and compression bit rate. The adaptive psychovisual threshold can be adopted to generate custom quantization table for TMT image compression based on user preference. Unlike adaptive JPEG compression, the adaptive TMT image compression does not visually introduce clear artifacts. The proposed psychovisual threshold functions can also be utilized in various digital image processing application such as super-resolution, watermarking and graphical animations.
4. ACKNOWLEDGEMENT
The researcher would like to express a very special thanks to Ministry of Higher Education (MOHE), Malaysia for providing financial support for this research project by Fundamental Research Grant Scheme (FRGS/2012/FTMK/SG05/03/1/F00141).
5. REFERENCES
Chang, W.H. and L.W. Chang, 2010. Semi-fragile watermarking for image authentication, localization and recovery using Tchebichef moments. Proceedings of the International Symposium Communication Information Technologies,Oct. 26-29, IEEE Xplore Press, Tokyo, pp: 749-754. DOI: 10.1109/ISCIT.2010.5665087
Ernawan, F., E. Noersasongko and N.A. Abu, 2011. An efficient 2×2 Tchebichef moments for mobile image compression. Proceedings of the International Symposium on Intelligent Signal Processing and Communication System, Dec. 7-9, IEEE Xplore Press, Chiang Mai, pp: 001-005. DOI: 10.1109/ISSPA.2010.5605448
Ernawan, F., N.A. Abu and H. Rahmalan, 2012. Tchebichef moment transform on image dithering for mobile applications. Proc. SPIE, 8334: 83340D-83340D-5. DOI: 10.1117/12.946023
Hore, A. and D. Ziou, 2010. Image quality metrics: PSNR vs. SSIM. Proceedings of the International Conference on Pattern Recognition, Aug. 23-26, IEEE Xplore Press, Sherbrooke, pp: 2366-2369. DOI: 10.1109/ICPR.2010.579
Huang, W., S. Chen and G. Zheng, 2010. A Fast 2D Discrete tchebichef transform algorithm. Proceedings of the International Conference on Innovative Computing and Communication, Jan. 30-31, IEEE Xplore Press, Wuhan, pp: 358-361. DOI: 10.1109/CICC-ITOE.2010.97
Luo, W., J. Huang and G. Qiu, 2010. JPEG Error analysis and its applications to digital image forensics. IEEE Trans. Inform. Forens. Securty, 5: 480-491. DOI: 10.1109/TIFS.2010.2051426
Rahmalan, H., N.A. Abu and W.S. Lang, 2010. Using Tchebichef moment for fast and efficient image compression. Patt. Recogn. Image Anal., 20: 505-512. DOI: 10.1134/S1054661810040115
Sahami, S. and M.G. Shayesteh, 2012. Bi-Level image compression technique using neural network. IET Image Proc., 6: 496-506. DOI: 10.1049/iet-ipr.2011.0079
Senapati, R.K., U.C. Pati and K.K. Mahapatra, 2010. A novel fast zigzag prune 4×4 discrete tchebichef moment based image compression algorithm. Proceedings of the International Conference on Computational Intelligence and Communication Networks, Nov. 26-28, IEEE Xplore Press, Rourkela, pp: 73-78. DOI: 10.1109/CICN.2010.25 Shu, H., H. Zhang and L. Luo, 2010. Fast computation of
tchebichef moments for binary and grayscale images. IEEE Trans. Image Proc., 19: 3171-3180. DOI:10.1109/TIP.2010.2052276
Tiagrajah, V.J., O. Jamaludin and H.N. Farrukh, 2011. Discriminant Tchebichef based moment features for face recognition. Proceedings of the International Conference on Signal and Image Processing Applications,Nov. 16-18, IEEE Xplore Press, Kuala
Lumpur, pp: 192-197. DOI:
10.1109/ICSIPA.2011.6144081
Vidyavathi, K. and R.S. Sabeenian, 2012. Motion-compensated video compression using variable length huffman coding. Proceedings of the International Conference on Machine Vision and Image Processing, Dec. 14-15, IEEE Xplore Press,
Namakkal, pp: 77-80. DOI:
10.1109/MVIP.2012.6428765
Yim, C. and A.C. Bovik, 2011. Quality assessment of deblocked images. IEEE Trans. Image Proc., 20: 88-98. DOI: 10.1109/TIP.2010.2061859