Integrating a Smooth Psychovisual Threshold into
an Adaptive JPEG Image Compression
Ferda Ernawan1, 2 1
Faculty of Information and Communication Technology, Universiti Teknikal Malaysia Melaka, Melaka, Malaysia
2
Faculty of Computer Science, Universitas Dian Nuswantoro, Semarang, Indonesia Email: [email protected]
Nur Azman Abu and Nanna Suryana
Faculty of Information and Communication Technology, Universiti Teknikal Malaysia Melaka, Melaka, Malaysia
Email: {nura, nsuryana}@utem.edu.my
Abstract—The visual quality image output of JPEG compression is determined by quantization process. The popular quality factor in the extended JPEG image compression has been widely used to scale up the quantization tables. The scaling quantization table using quality factor is used to determine the quality image output. The scaling up on the quantization tables increases their values uniformly thus produces higher compression performance. However, the effects of the scaling up on the human visual system have not been taken into consideration. This paper examines the quantization table design based on adaptive psychovisual threshold and numerical analysis of the compression performance in terms of quality image reconstruction and average bit length of Huffman code. The comparison between extended JPEG image compression using the typical quality factor and quality scale of psychovisual threshold has been done. The experimental results of adaptive quantization tables based on psychovisual threshold show an improvement on the quality of image reconstruction at the lower average bit length of Huffman's code.
Index Terms—image compression, psychovisual threshold, adaptive quantization tables, quality image compression, quantization process
I. INTRODUCTION
A digital image camera captures, compresses and stores images in real time [1][2]. A true colour raw image consumes high computing process and large storage space [3]. The JPEG image compression is a popular standard used in digital cameras [4]. It performs relatively well utilizing low computation and memory storage. The compression rate is mainly determined by the quantization tables and entropy coding. Thequantization process is a main part of image compression to control
visual quality and the bit rate of the image output.
Recently, the popular extended JPEG has allowed a user to choose output preferences according to the quality factor QF to scale the quantization tables. The quality scaling factor on a quantization table has been popularly implemented especially on image compression [5][6]. A scaling factor on JPEG quantization tables is intended for low, medium or high bit rate compression. An image compression engine typically will use the quality factor to scale quantization tables, which may not be optimal to the output image quality [7]. In order to achieve high-quality image compression at a low bit rate, the quantization table may need to be designed based on human visual system properties.
The sensitivity of the human eye can be fully explored and investigated via qualitative experiments. However, it is too expensive and costly to conduct such qualitative experiments. Several approaches have been conducted to investigate the psychovisual models such as human visual weighting [8] and psychovisual model based on preserving downsampling and upsampling [9]. In general, a psychovisual model has been designed based on the understanding of brain theory and neuroscience [10]. This paper will explore on the concept of adaptive psychovisual threshold to provide custom quantization tables on JPEG image compression. The concept of the psychovisual error threshold can be obtained from quantitative experiments by evaluating the just noticeable difference of the compressed image from the original image at various frequency orders [11][12].
The Discrete Cosine Transform (DCT) is an element transformation method used in standard JPEG compression. DCT has been widely used in information hiding [13], video watermarking [14][15], image watermarking [16] and image compression [17]-[19]. This experiment investigates the effect of incrementing DCT coefficients one at a time to the image reconstruction. This paper will investigate the contribution of each DCT coefficient to the image reconstruction.
The organization of this paper is as follows. The next section provides a brief description of the discrete cosine transform. Section III presents the experimental design on generating an adaptive psychovisual threshold. The experimental results of adaptive psychovisual thresholds in image compression are presented in Section IV. The experimental results of the JPEG image compression using quality factors and the newly proposed quantization table based on an adaptive psychovisual threshold are given in Section V. Lastly section VI concludes this paper.
II. DISCRETE COSINE TRANSFORM
The two-dimensional DCT [20] has been widely used in image processing applications. In addition, DCT polynomial set Cn(x) of size N=8 can be generated
iteratively as follows:
N
The kernel for the DCT is derived from the following definition of g [21]: definition of the two-dimensional DCT is given as follows [20]:
Each frequency coefficient Bpq carries the frequency
order p+q. The inverse of two-dimensional DCT is given as follows:
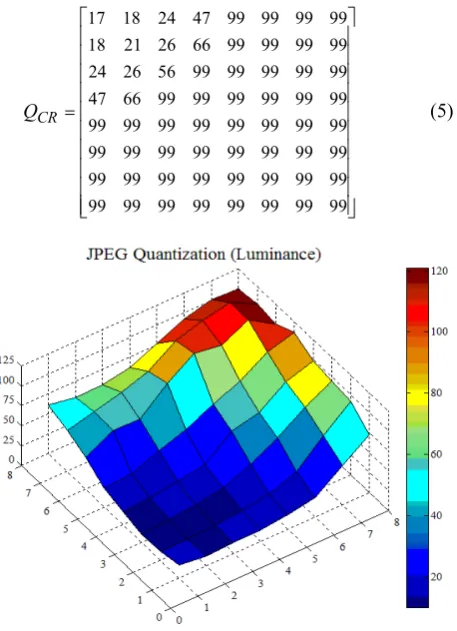
, capabilities of the human visual system on the image information. The irrelevant image information is removed by the quantization table during the quantization process of JPEG image compression. JPEG quantization step largely determines the rate distortion in a JPEG image compression [22]. Most of the time, the quantization process will remove the high-frequency signals and discard information which is not visually significant. A human visual system is more sensitive to the low-frequency signals than to the high-low-frequency signals. The JPEG quantization tables (5) have been known to offer satisfactory performance, on the average over a wide variety of applications and viewing conditions. The three-dimensional visualization of JPEG quantization for luminance and chrominance is shown in Figure 2 and Figure 3. The JPEG quantization tables on luminance QCL
and QCR chrominance are provided as follows:
⎥
Figure 1. One-Dimensional Discrete Cosine Transform of set Cn(x) for
⎥ ⎥ ⎥ ⎥ ⎥ ⎥ ⎥ ⎥ ⎥ ⎥
⎦ ⎤
⎢ ⎢ ⎢ ⎢ ⎢ ⎢ ⎢ ⎢ ⎢ ⎢
⎣ ⎡
=
99 99 99 99 99 99 99 99
99 99 99 99 99 99 99 99
99 99 99 99 99 99 99 99
99 99 99 99 99 99 99 99
99 99 99 99 99 99 66 47
99 99 99 99 99 56 26 24
99 99 99 99 66 26 21 18
99 99 99 99 47 24 18 17
CR
Q (5)
These tables were obtained from a series of psychovisual experiments, which determined the visibility thresholds for the DCT basis functions on a 760×576 images and at a viewing distance equal to six times the screen width [23]. In 1984, Lohscheller claimed that these values were supposed to be at the threshold of visibility [24]. The JPEG quantization tables have indeed been widely accepted and over the decades have become the default quantization tables on the standard JPEG image compression. However, these standard tables have not
considered the contributions of the DCT coefficients on the image reconstruction. This quantization process indirectly reduces the accuracy of DCT coefficients in an integer representation [25]. These quantization values are to limit the variation of the coefficient transform. They are supposedly coming from a psychovisual error threshold.
The extended JPEG compression introduces a simple and efficient method to produce quality compression levels known as a quality factor QF. The QF is the quality reference number which ranges from 1 to 100 [26]. The QF is then used to scale the quantization tables by a weighting factor w as follows:
50 50
<
= forQF
QF
w
100 50
50
2− ≤ <
= QF for QF
w (6)
where QF <50 yields high compression rate, whereas the QF >50 produces the higher-quality output image possible. Typically, the quality factors 25, 50 and 75 are set to obtain the output images with low, medium and high qualities respectively. The quantization steps are defined by rounding to the nearest integer:
⎟ ⎟ ⎠ ⎞ ⎜
⎜ ⎝ ⎛
⋅ =
pq pq pq
Q w
B Round
T (7)
Dequantization is the inverse function by multiplying the coefficient in each block using the same quantization matrix Qpq [27]. The dequantization is defined as follows:
pq pq
pq T w Q
B '= ⋅ ⋅ (8)
The setting on achieving high compression performance is through the generation of a lower average bit of Huffman's code at the expense of lower image reconstruction quality which may produce artifacts on the output image. Some distortion will clearly appear in the reconstruction image such as blocking artifact, ringing artifact and blurring [28]. Blocking artifact arise at high compression ratios and very low quality factors. In order to reduce the artifacts on the output image and get high-quality image reconstruction, it is desirable to consider the characteristics of the human visual system.
The principle of psychoacoustic model on audibility threshold is adopted here to measure the psychovisual threshold of the images. The threshold indicates the physical value of a stimulus at a predetermined level of performance [29]. Psychophysics is an approach to measure limited sensitivity and sensation to the physical characteristics of a stimulus.
This paper investigates a quantitative experimental impact on image compression based on the concept of psychovisual threshold. The 80 images (24-bit RGB with 512×512 pixels) are chosen for this quantitative experiment. The 80 images are classified into two categories, which are 40 real image and 40 graphic images. First, the RGB color components are converted Figure 3. Three-dimensional visualization of JPEG quantization table
for chrominance
into luminance (Y) and chrominance (Cb and Cr). YCbCr can be computed directly from 8 bits RGB as follows:
⎥
The inverse transformation from YCbCr to RGB is given as follows:
⎥
Next, the images are divided into the 8×8 size blocks and each block of the image data is transformed by a 2-dimensional DCT. In this research, the JPEG quantization tables are used as a reference for the domain contribution of DCT coefficients. This quantitative experiment investigates the contribution of DCT coefficients to the output images. The resulting DCT coefficients are incremented one at a time up to a maximum quantization table value of each frequency order. The DCT coefficients are incremented concurrently for each frequency order. The effects of an increment on DCT coefficients are measured by the image reconstruction error. The error threshold from the image reconstruction will be the primitive to the psychovisual threshold proposed in this paper.
IV. EXPERIMENTAL RESULTS
An adaptive psychovisual threshold on generating quantization tables is investigated for a high bit rate compression. In order to optimize an adaptive JPEG performance at high-rate compression, the new quantization tables are redesigned based on human visual systems by optimizing the visual quality of the reconstructed image at a given bit rate.
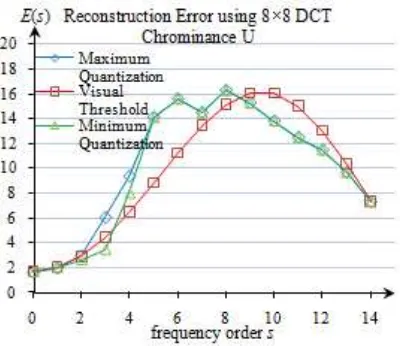
The average full error score on 40 real colour images is computed for each frequency order on every 8×8 block image. The effect of incremented DCT coefficient as the just noticeable difference of the compressed image from the original image is calculated by image reconstruction error. The average reconstruction error of an increment between minimum and maximum values of the quantization table from given order zero to the order fourteen has been visualized as a curve. The green curve represents image reconstruction error based on the minimum values from the quantization table while the blue curve represents the image reconstruction error based on the maximum quantization value for each frequency order. The average error reconstruction score of incrementing DCT coefficients on luminance and chrominance for 40 real images are shown in Figure 4 and Figure 5. In order to produce a psychovisual threshold, the new average target on reconstruction error is set as a smooth transition curve which results in an ideal curve of average reconstruction error as presented by a red curve. This curve can then be used to produce a new quantization table. The smooth curve of
reconstruction error is interpolated by a polynomial that represents the psychovisual error threshold of the image.
This model represents the visual sensitivity of DCT basis function. This psychovisual model considers on the human eye which is more sensitive to low order image than to constant image patterns. The sensitivity represents the threshold of the human visual system at low order signals. The new smooth reconstruction error curves represent psychovisual thresholds for luminance fVL and
chrominance fVR which are defined as follows:
2
In order to generate adaptive quantization tables, these functions are weighted according to target quality factors. The authors propose the following functions which will be used to generate the adaptive quantization tables.
Figure 4. Average reconstruction error of an increment on DCT coefficient Luminance for 40 real colour image.
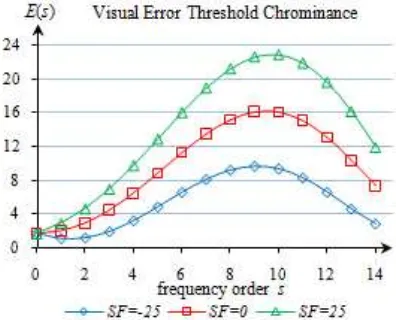
The new scale factors SF for psychovisual threshold ranges from -25 until 25. The larger scale factor SF produces the higher compression ratio. These functions fVLA and fVRA are depicted in Figure 6 and Figure 7 with
scale factor SF= -25, 0 and 25 respectively for luminance and chrominance.
From an adaptive psychovisual error threshold of the image reconstruction error, the new quantization values on each frequency order shall be generated. According to (13)-(14), these functions fVLA and fVRA can be used to
generate the new quantization tables according to scale factors -25, 0 and 25 as follows:
⎥
Figure 6. Average reconstruction error of an increment on DCT coefficient Luminance for 40 real colour image with SF= -25, 0 and 25.
Figure 7. Average reconstruction error of an increment on DCT coefficient Chrominance for 40 real colour image with SF= -25, 0 and
⎥ ⎥ ⎥ ⎥ ⎥ ⎥ ⎥ ⎥ ⎥ ⎥
⎦ ⎤
⎢ ⎢ ⎢ ⎢ ⎢ ⎢ ⎢ ⎢ ⎢ ⎢
⎣ ⎡
=
162 166 169 174 164 147 129 129
166 169 174 164 147 129 129 102
169 174 164 147 129 129 102 90
174 164 147 129 129 102 90 69
164 147 129 129 102 90 69 54
147 129 129 102 90 69 54 38
129 129 102 90 69 54 38 28
129 102 90 69 54 38 28 18
3
VRA
Q (17)
An increase on quantization value to be a higher quantization value will produce a higher bit rate on the compressed image. However, the side effect such as ringing and blocking may appear in the visual image output. On the other hand, lower quantization value provides lower bit rate compressed image which produces closer image to the original image. According to human visual system characteristics, the low-frequency order of custom quantization table design should not be changed. A slight change in quantization values on the low-frequency order design means will cause serious distortion which can be perceived by human visual systems. The visual perceptual quality is most sensitive at low order frequency signals.
These new quantization tables will be applied in JPEG image compression to measure the performance of the proposed custom quantization tables based on the concept of psychovisual threshold. The performances of image compression using psychovisual threshold are measured by the qualities of reconstructed images and the average bit length of Huffman code.
V. ADAPTIVE IMAGE COMPRESSION SCHEME According to JPEG compression, the input image is grouped 8×8 pixels blocks and each block is independently transformed using 2-dimensional DCT. The DCT coefficients are quantized by quantization tables. Next, the quantized DC coefficient is separated from the quantized AC coefficients. The quantized DC coefficient is encoded as the difference from the DC term of the previous block in the encoding order. For AC coefficient, the quantized AC coefficients are scanned by traversing in zig-zag pattern and converted into a linear array on each block image. The sequences of run length encoded linear array are converted to variable length Huffman codes.
Huffman coding is a coding technique to produce the shortest possible average code length of the source symbol set and the probability of occurrence of the symbols [30]. Using these probability values, a set of Huffman's code of the symbols can be generated by Huffman Tree. Next, the average bit length score is calculated to find the average bit length of DC and AC coefficients. The average bit length of Huffman's code based on quality factor QF and the proposed adaptive psychovisual threshold for DCT is shown in Table I, Table II and Table III.
To assess the quality of the image compression, the image reconstruction error shall be calculated by
obtaining the differences of reconstructed compressed image g(i, j, k) from original image f (i, j, k). The image reconstruction error can be defined as follows:
∑∑∑
−= −
= =
− =
1
0 1
0 2
0
) , , ( ) , , ( 3
1 ) (
M
i N
j k
k j i f k j i g MN
s
E (18)
The MSE calculates the average of the square of the error [31] which defined as follows:
TABLEI.
AVERAGE BIT LENGTH OF HUFFMAN CODE OF JPEGIMAGE COMPRESSION USING QUALITY FACTOR QF=75 AND PSYCHOVISUAL
THRESHOLD SF=-25
Average bit length of Huffman Code
JPEG Compression
QF=75
Psychovisual Threshold SF= -25 40 Real
Images
40 Graphical
Images
40 Real Images
40 Graphical
Images DC Luminance Y 6.3715 5.9680 5.7468 5.5237 DC Chrominance Cb 4.0424 4.5336 3.0749 3.9670 DC Chrominance Cr 3.6904 4.5287 2.7175 3.8656 AC Luminance Y 3.1136 3.3472 3.6264 3.8882 AC Chrominance Cb 2.1931 2.4065 2.2333 2.6661 AC Chrominance Cr 2.0577 2.3590 2.0970 2.6128
TABLEII.
AVERAGE BIT LENGTH OF HUFFMAN CODE OF JPEGIMAGE COMPRESSION USING QUALITY FACTOR QF=50 AND PSYCHOVISUAL
THRESHOLD SF=0
Average bit length of Huffman Code
JPEG Compression
QF=50
Psychovisual Threshold SF= 0 40 Real
Images
40 Graphical
Images
40 Real Images
40 Graphical
∑∑∑
−= −
= =
− =
1
0 1
0 2
0
2 ) , , ( ) , , ( M
i N
j k
k j i f k j i g
MSE
(19)
The next measurement is Peak Signal to Noise Ratio (PSNR). The PSNR is defined as follows [32]:
2
10 10
255 20 log Maxi 10 log PSNR
MSE MSE
⎛ ⎞
⎛ ⎞
= ⎜ ⎟= ⎜⎜ ⎟⎟
⎝ ⎠ ⎝ ⎠ (20)
Another measurement quality image is Structural Similarity index (SSIM), which is a method to measure the similarity between original image and compressed image. The SSIM is defined as follows:
γ β
α
)] , ( [ )] , ( [ )] , ( [ ) ,
(x y l x y c x y s x y
SSIM = ⋅ ⋅ (21)
where α> 0, > 0, > 0, are parameters to adjust the relative importance of the three components. The detail description is given in [33]. The comparison of the quality of image reconstruction between adaptive JPEG compression and adaptive psychovisual threshold at the respective quality factor are given in Table IV, V and VI.
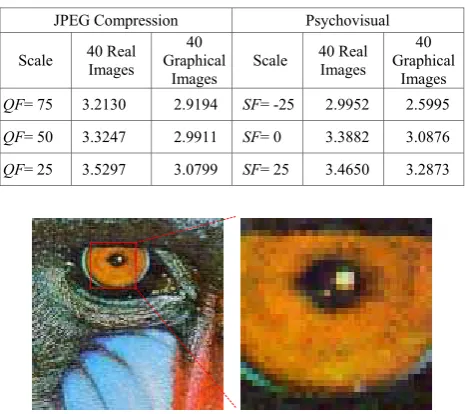
Figure 8. Original colour image (left) and zoomed in to 400% (right). TABLEVI.
THE IMAGE RECONSTRUCTION ERROR SCORE OF JPEGIMAGE COMPRESSION USING QUALITY FACTOR QF=25 AND PSYCHOVISUAL
THRESHOLD SF=25
Image Measurement
JPEG Compression
QF=25
Psychovisual Threshold SF= 25 40 Real
Images
40 Graphical
Images
40 Real Images
40 Graphical
Images Full Error 6.8019 7.9809 6.2933 6.9730 MSE 105.7614 190.0435 92.2574 145.7658 PSNR 29.1848 27.4205 29.8522 28.5020
SSIM 0.9241 0.9201 0.93833 0.9430
TABLEV.
THE IMAGE RECONSTRUCTION ERROR SCORE OF JPEGIMAGE COMPRESSION USING QUALITY FACTOR QF=50 AND PSYCHOVISUAL
THRESHOLD SF=0
Image Measurement
JPEG Compression
QF=50
Psychovisual Threshold SF= 0 40 Real
Images
40 Graphical
Images
40 Real Images
40 Graphical
Images Full Error 5.5349 6.1479 5.4987 5.8088 MSE 70.9636 113.8333 69.5203 100.0531 PSNR 31.1903 29.7903 31.2517 30.2278
SSIM 0.9557 0.9541 0.9548 0.9615
TABLEIV.
THE IMAGE RECONSTRUCTION ERROR SCORE OF JPEGIMAGE COMPRESSION USING QUALITY FACTOR QF=75 AND PSYCHOVISUAL
THRESHOLD SF=-25
Image Measurement
JPEG Compression
QF=75
Psychovisual Threshold SF= -25 40 Real
Images
40 Graphical
Images
40 Real Images
40 Graphical
Images Full Error 4.4492 4.1551 4.2827 4.0598
MSE 45.0920 52.3127 41.4939 48.6186
PSNR 33.4415 33.5977 33.7089 33.6311
SSIM 0.9739 0.9815 0.9757 0.9827
TABLEVII.
THE COMPRESSION RATIO SCORE OF JPEGIMAGE COMPRESSION USING QUALITY FACTOR AND PSYCHOVISUAL THRESHOLD
JPEG Compression Psychovisual
Scale 40 Real Images
40 Graphical
Images
Scale 40 Real Images
40 Graphical
Images
QF= 75 3.2130 2.9194 SF= -25 2.9952 2.5995
QF= 50 3.3247 2.9911 SF= 0 3.3882 3.0876
QF= 25 3.5297 3.0799 SF= 25 3.4650 3.2873 TABLEIII.
AVERAGE BIT LENGTH OF HUFFMAN CODE OF JPEGIMAGE COMPRESSION USING QUALITY FACTOR QF=25 AND PSYCHOVISUAL
THRESHOLD SF=25
Average bit length of Huffman Code
JPEG Compression
QF=25
Psychovisual Threshold SF= 25 40 Real
Images
40 Graphical
Images
40 Real Images
40 Graphical
In order to make a visual inspection on the effectiveness of the new quantization tables, the right eye of baboon image is zoomed 400% as projected on the right of Figure 8. The experiment results of image compression based on the new quantization tables from adaptive psychovisual threshold are depicted on the right of Figure 9, Figure 10 and Figure 11. A visual quality of image reconstruction using a new quantization table based on psychovisual threshold gives better visual quality image output than the extended adaptive JPEG baseline coding but the image output is a little blurred.
The popular quality factor in the extended JPEG image compression has been widely used to scale up the quantization table value. The scaling on the quantization tables increases their values uniformly thus produces high compression performance. The uniform scaling up on quantization table by a certain quality factor on JPEG compression may have not considered their effects to the human visual system. While, the human visual system is more sensitive to changes on low frequency signals, which carry more significant visual information. The quantization table represents tolerance of the visibility of the human visual system. The scaling quantization tables
supposed to be different between low-frequency coefficients and high-frequency coefficients.
The effect of incrementing DCT coefficient has been explored from this experiment. The error reconstructions from incremented DCT coefficients are concentrated more in the medium frequency of the image signals. The DC coefficient contains higher energy than AC coefficients. Recently, an experiment [34] has been done by taking only DC coefficient of 8×8 blocks making all AC coefficients zero. The DC coefficient represents important visual information of the image. The down scaling of the DC coefficient by large quantization table value can affect the significantly relevant information of the image.
An adaptive psychovisual threshold is designed for custom quantization table generation based on human eye characteristics. The newly proposed technique based on an adaptive psychovisual model intends to produce optimal quantization tables for high image compression. The image reconstruction using an adaptive quantization based on psychovisual threshold performs better than the uniform scaling quality factor from JPEG compression. Refer to Table I, II and III, the output's image compression from adaptive quantization tables based on psychovisual threshold produce a lower average bit length of Huffman's code. At the same time, they produce lower reconstruction error than using scaling quality factors on JPEG quantization tables as presented in Table IV, Table V and Table VI.
VI. CONCLUSION
An adaptive JPEG compression using scaling factor for quantization has been a popular and heavily utilized in digital image compression. The scaling factor of quantization table allows an image to be compressed at a typically lower quality thus improving the compression rate. The quantization tables are produced from a series of psychovisual experiments to determine the visual sensitivity of the human eye. The effect of an increment DCT coefficient has been investigated to explore the human eye sensitivity to the image. An adaptive psychovisual error threshold has been proposed here as a mean to generate the new custom's quantization table. The performance of the proposed adaptive JPEG image compression based on psychovisual threshold and the extended JPEG image compression using the quantization scaling factor have been compared. The experimental results of the new quantization tables based on adaptive psychovisual threshold produce optimal quantization tables with higher-quality image reconstruction at lower average bit length of Huffman's code.
ACKNOWLEDGMENT
The authors would like to express a very special thank to Ministry of Higher Education (MOHE), Malaysia for providing financial support on this research project by Fundamental Research Grant Scheme (FRGS/2012/FTMK/SG05/03/1/F00141).
Figure 10. The comparison between JPEG quantization table with QF=50 (left) and psychovisual threshold with SF=0 (right) zoomed in to
400%.
Figure 9. The comparison between JPEG quantization table with QF=75 (left) and psychovisual threshold with SF= -25 (right) zoomed in to
400%.
Figure 11. The comparison between JPEG quantization table with QF=25 (left) and psychovisual threshold with SF=25 (right) zoomed in
REFERENCES
[1] J. Chen, K. Venkataraman, D. Bakin, B. Rodricks, R. Gravelle, P. Rao and Y. Ni. “Digital Camera Imaging System Simulation,” IEEE Transactions on Electron Devices, vol. 56, no.11, pp. 2496-2505, 2009.
[2] Y. Nishikawa, S. Kawahito, T. Inoue. “A Parallel Image Compression System for High-speed Cameras,” IEEE International Workshop on Imaging Systems and Techniques, pp. 053-057, 2005.
[3] F. Ernawan, N.A. Abu and H. Rahmalan. “Tchebichef Moment Transform on Image Dithering for Mobile Applications,” International Conference on Digital Image Processing, Proc. of SPIE, vol. 8334, pp. 83340D, 2012. [4] M. Elbadri, R. Peterkin, V. Groza, D. Ionescu and
A.Saddik, “Hardware Support of JPEG,” Canadian Conference on Electrical and Computer Engineering, pp. 812-815, 2005.
[5] J.D. Kornblum. “Using JPEG Quantization Tables to Identify Imagery Processed by Software,” Digital Investigation, Elsevier, vol. 5, pp. 021-025, 2008.
[6] W. Luo, J. Huang, and G. Qiu, “JPEG Error Analysis and Its Applications to Digital Image Forensics,” IEEE Transactions on Information Forensics and Security, vol. 5, no. 3, pp. 480-491, 2010, 2010.
[7] F. Ernawan, N.A. Abu, N. Suryana, “Adaptive Tchebichef Moment Transform Image Compression Using Psychovisual Model,” Journal of Computer Science, vol. 9, no. 6, pp. 716-725, 2013.
[8] K.N. Ngan, K.S. Leong and H. Singh. “Adaptive Cosine Transform Coding of Images in Perceptual Domain,” IEEE Transaction on Acoustics, Speech and Signal Processing, vol. 37, no. 11, pp. 1743-1750, 1989.
[9] G. Zhai, X. Wu and Y. Niu. “A Psychovisually Tuned Image Codec,” International Workshop on Multimedia Signal Processing, pp. 001-006, 2011.
[10]G. Zhai, X. Wu and X. Yang, W. Lin, W. Zhang. “A Psychovisual Quality Metric in Free-Energy Principle,”
IEEE Transaction on Image Processing, vol. 21, no. 1, pp. 041-052, 2012.
[11]F. Ernawan, N.A. Abu and N. Suryana, “TMT Quantization Table Generation Based on Psychovisual Threshold for Image Compression,” International Conference of Information and Communication Technology (ICoICT 2013), pp. 202-207, 2013.
[12]N.A. Abu, F. Ernawan and S. Sahib, “Psychovisual Model on Discrete Orthonormal Transform,” International Conference on Mathematical Sciences and Statistics
(ICMSS 2013), 5-7, pp.309-314, 2013.
[13]X. Jianquan, X. Qing and T. Lijun, “A High A High Capacity Information Hiding Algorithm Based on Invariance Properties of JPEG Compression,” Journal of Computers, vol. 5, no. 12, pp. 1925-1932, 2010.
[14]C. Wang, S. Liu, F. Jiang and Y. Liu, “A Robust Scalable Spatial Spread-Spectrum Video Watermarking Scheme Based on a Fast Downsampling Method,” Journal of Computers, vol. 7, no. 9, pp. 2256-2261, 2012.
[15]M. Cheng, M. Xi, K. Yuan, C. Wu and M. Lei, “Recoverable Video Watermark in DCT Domain,” Journal of Computers, vol. 8, no. 2, pp. 533-538, 2013.
[16]N.A. Abu, F. Ernawan, N. Suryana and S. Sahib, “Image Watermarking Using Psychovisual Threshold over the Edge,” Information and Communication Technology, vol. 7804, pp. 519-527, 2013.
[17]N.A. Abu, F. Ernawan and N. Suryana, “A Generic Psychovisual Error Threshold for the quantization table generation on JPEG Image Compression,” 9thInternational
Colloquium on Signal Processing and its Applications, pp. 039-043, 2013.
[18]F. Ernawan, N.A. Abu, N. Suryana, “An Adaptive JPEG Image Compression Using Psychovisual Model,”
Advanced Science Letters, vol. 20, no. 1, pp. 026-031, 2014.
[19]F. Ernawan, N.A. Abu, N. Suryana, “An Optimal Tchebichef Moment Quantization Using Psychovisual Threshold for Image Compression,” Advanced Science Letters, vol. 20, no. 1, pp. 070-074, 2014.
[20]N. Ahmed, T. Natrajan and K. R. Rao, “Discrete Cosine Transform,” IEEE Transaction on Computers, vol. 23, no. 1, pp. 090-093, 1979.
[21]R. Mukundan and O. Hunt, “A Comparison of Discrete Orthogonal Basis Functions for Image Compression,”
Proceeding Conference on Image and Vision Computing, pp. 053-058, 2004.
[22]En-Hui Yang and Longji Wang, “Joint Optimization of Run-Length Coding, Huffman Coding, and Quantization Table With Complete Baseline JPEG Decoder Compatibility,” IEEE Transaction on Image Processing, vol. 18, no. 1, pp. 063-074, 2009.
[23]A.C. Bovik, The Essential Guide to Image Processing, Elsevier Press, 2009, pp. 421-461.
[24]H. Lohscheller, “A Subjectively Adapted Image Communication System,” IEEE Transaction on Communications, vol. 32, no. 12, pp. 1316-1322, 1984. [25]W.B. Pennebaker and J.L. Mitchel, JPEG still image data
compression standard, Springer, New York, USA, 1992. pp. 030-037.
[26]Z. Fan and R.L. de Queiroz, “Identification of Bitmap Compression History: JPEG Detection and Quantizer Estimation,” IEEE Transaction on Image Processing, vol. 12, no. 2, pp. 230-235, 2003.
[27]F. Ernawan, E. Noersasongko and N.A. Abu, “An Efficient 2×2 Tchebichef Moments for Mobile Image Compression,” International Symposium on Intelligent Signal Processing and Communication System, pp. 001-005, 2011.
[28]D.L. McLaren and D.T. Nguyen, “Removal of Subjective Redundancy from DCT-Coded Images,” IEE Proceedings Communications, Speech and Vision, vol. 138, no. 5, pp. 345-350, 1991.
[29]R. J. Roeser, M. Valente and H. Hosford-Dunn, Audiology Diagnosis, Second Edition, Thieme Medical Publisher, p. 175, 2007.
[30]D.A. Huffman, “A Method for the Construction of Minimum-Redundancy Codes,” Proceedings of the IRE, vol. 40, no. 9, pp. 1098-1101, 1952.
[31]A. Hore and D. Ziou, “Image Quality Metrics: PSNR vs. SSIM,” International Conference on Pattern Recognition, pp. 2366-2369, 2010.
[32]C. Yim and A.C. Bovik, “Quality Assessment of Deblocked Images,” IEEE Transaction on Image Processing, vol. 20, no. 1, pp. 088-098, 2011.
[33]Anmin Liu, Weisi Lin and Manish Narwaria, “Image Quality Assessment Based on Gradient Similarity,” IEEE Transaction on Image Processing, vol. 21, no. 4, pp. 1500-1512, 2012.
Ferda Ernawan was born in Semarang, 19 February 1988. He received the Bachelor Degree in Information Technology from Universitas Dian Nuswantoro (UDINUS), Semarang, Indonesia in 2009. He received Master Degree in Software Engineering and Intelligence from the Faculty of Information and
Communication Technology, Universiti Teknikal Malaysia Melaka (UTeM). His research
interests are in the areas audio processing, image processing and their applications.
Nur Azman Abu is currently serving as a senior lecturer at Faculty of ICT, Universiti Teknikal Malaysia Melaka (UTeM). He obtained his bachelor and master degree from Purdue University in 1992 and 1994 both in Mathematics. He is currently undergoing his PhD program at Universiti Teknikal Malaysia Melaka. His current interests include cryptography, random number generation, image processing and travelling salesman problem.