IMPROVEMENT OF ETHANOL PRODUCTION BY INDUCER
ADDITION IN RECOMBINANT Escherichia coli CULTURE
UNDER AEROBIC CONDITIONS
FITHRIANI
POSTGRADUATE SCHOOL
BOGOR AGRICULTURAL UNIVERSITY BOGOR
DECLARATION OF ORIGINALITY AUTHENTICALY AND
COPYRIGHT*
I declare that the thesis entitled Improvement of Ethanol Production by Inducer Addition in Recombinant Escherichia coli Culture under Aerobic Conditions is the result by myself and guidance of the supervisor committee; and has not been submitted before in any institutions. Secondary source of information published or unpublished has been acknowledged in text and included in the reference chapter.
Herewith I bestow the copyright of my paper to Bogor Agricultural University.
Bogor, March 2016
Fithriani
SUMMARY
FITHRIANI. Improvement of Ethanol Production by Inducer Addition in Recombinant Escherichia coli Culture under Aerobic Conditions. Supervised by DJUMALI MANGUNWIDJAJA and PRAYOGA SURYADARMA.
Isopropyl-β-D-1-thiogalactopyranoside (IPTG) plays significant role in initiating expression of recombinant genes in Escherichia coli under the control of
lac-derived promoter. The addition of IPTG is frequently performed in exponential growth stage by using high concentrations as an effort to fully induce lac-derived promoter. Although generally results in increasing recombinant genes expression, metabolic load that occurs in host cells after induction leads to reduce cell growth, in turn, lowering product yield. The objective of this study was to investigate the effect of IPTG addition in terms of induction time and IPTG concentration in recombinant E. coli culture to improve ethanol production under aerobic conditions.
This study was consisted of three experimental stage: effect of pdc and adhB
introduction, role of fdh reaction and formate availability, and effect of IPTG induction on ethanol production. E. coli strains used in this study were BW25113 and BW25113∆pta. Plasmid pTadhB-pdc harboring ethanol producing genes of pdc
and adhB from Zymomonas mobilis; and pHfdh harboring NADH regeneration gene of fdh from Mycobacterium vaccae, were used to transform E. coli strains. Improvement of ethanol production was first investigated by introducing pdc and
adhB genes into E. coli BW25113; and then was further improved by introducing
fdh and ethanologenic Z. mobilis genes into E. coli BW25113∆pta, following 4 g L-1 formate supplementation into cultivation medium. The effect of induction time in recombinant E. coli BW25113/pHfdh/pTadhB-pdc culture was investigated by IPTG addition at 0, 6, 12 and 18 h of cultivation time; while impact of inducer concentration was investigated by addition of IPTG in the range concentration of 50-2000 µM at an optimum induction time.
Analysis of mRNA and ethanol showed pdc and adhB were successfully expressed in recombinant strain BW25113/pTadhB-pdc, and led to induced two fold greater ethanol compared to the parent strain BW25113 (0.2 g L-1 ethanol). The ethanol production improvement was further observed at 1.10 g L-1 in recombinant culture of BW25113∆pta/pHfdh/pTadhB-pdc by using 4 g L-1 formate supplementation. IPTG induction in BW25113∆pta/pHfdh/pTadhB-pdc culture showed significant higher ethanol production than non-induced culture. Addition of IPTG at concentration up to 50 µM strongly led to ethanol production improvement. However, higher IPTG concentrations could not further improve the production of ethanol. This study demonstrated that induction time at 0 h by using low concentration of IPTG at 50 µM is effective to improve ethanol production in recombinant E. coli culture under aerobic conditions.
RINGKASAN
FITHRIANI. Peningkatan Produksi Ethanol melalui Penambahan Induser pada Kultur Escherichia coli Rekombinan dalam Kondisi Aerobik. Dibimbing oleh DJUMALI MANGUNWIDJAJA dan PRAYOGA SURYADARMA
Isopropil-β-D-1-tiogalatopiranosida (IPTG) berperan penting dalam menginisisasi ekspresi gen rekombinan pada Escherichia coli yang dikontrol oleh promoter turunan lac. Penambahan IPTG biasanya dilakukan pada fase eksponensial dengan menggunakan konsentrasi yang tinggi sebagai upaya untuk menginduksi sepenuhnya promoter turunan lac. Meskipun umumnya dapat meningkatkan ekspresi gen rekombinan, beban metabolik setelah induksi dapat menyebabkan penurunan pertumbuhan sel sehingga mengakibatkan penurunan yield produk. Penelitian ini bertujuan untuk menginvestigasi pengaruh penambahan IPTG dalam segi waktu induksi dan konsentrasi IPTG pada kultur Escherichia coli
rekombinan untuk meningkatkan produksi ethanol dalam kondisi aerobik.
Penelitian ini terdiri dari tiga tahapan eksperimen: investigasi mengenai pengaruh introduksi gen pdc dan adhB, pengaruh reaksi fdh dan penambahan format, serta pengaruh induksi IPTG. Strain E. coli yang digunakan yaitu BW25113 dan BW25113∆pta. Plasmid yang mengandung gen untuk produksi etanol yaitu piruvat dekarboksilase (pdc) dan alkohol dehidrogenase (adhB) dari Zymomonas mobilis; dan plasmid pHfdh yang membawa gen fdh untuk regenerasi NADH dari
Mycobacterium vaccae, digunakan untuk mentranformasi strain E. coli. Peningkatan produksi etanol pertama kali dilakukan dengan mengintroduksikan gen pdc dan adhB pada E. coli BW25113; kemudian ditingkatkan lebih lanjut dengan mengintroduksikan gen fdh dan juga gen etanologenik Z. mobilis pada E. coli BW25113∆pta. Untuk mengivestigasi pengaruh waktu induksi terhadap kultur
E. coli rekombinan, induksi dilakukan melalui penambahan IPTG pada waktu kultivasi jam ke 0, 6, 12 dan 18. Sedangkan pengaruh konsentrasi induser diinvestigasi melalui penambahan IPTG dengan rentang konsentrasi 50 -2000 µM pada waktu induksi yang optimum.
Analisis mRNA dan etanol menunjukkan bahwa gen pdc dan adhB berhasil terekspresi pada E. coli rekombinan BW25113/pTadhB-pdc, dan dapat menginduksi produksi ethanol dua kali lipat lebih besar dibandingkan strain induk BW25113 (0.2 g L-1 etanol). Peningkatan etanol lebih lanjut terobservasi sebesar 1.10 g L-1 pada kultur E. coli rekombinan BW25113∆pta/pHfdh/pTadhB-pdc melalui penambahan 4 g L-1 format. Induksi IPTG pada kultur BW25113∆pta/pHfdh/pTadhB-pdc menunjukkan peningkatan etanol yang signifikan dibandingkan kultur tanpa induksi. Produksi etanol tertinggi sebesar 4.09 g L-1 terobservasi pada waktu induksi jam ke 0. Pemberian konsentrasi IPTG pada 0-50 µM dapat meningkatkan produksi etanol. Namun, konsentrasi IPTG lebih tinggi tidak dapat meningkatkan etanol lebih lanjut. Penelitian ini menunjukkan bahwa penambahan IPTG pada waktu induksi jam ke 0 dengan konsentrasi IPTG minimum sebesar 50 µM efektif untuk meningkatkan produksi etanol pada kultur
E. coli rekombinan dalam kondisi aerobik.
© Copyright IPB, 2016
All Rights Reserved by Law
It is prohibited to quote part or whole of this scientific writing without making citation. Quotations should only be made for the benefits of education, research, scientific writing, report writing, critical writing or solving a specific problem; and such quotations should not demean the image of IPB
Thesis
as requirement to obtain degree of Master of Science
in
Biotechnology Study Program
IMPROVEMENT OF ETHANOL PRODUCTION BY INDUCER
ADDITION IN RECOMBINANT Escherichia coli CULTURE
UNDER AEROBIC CONDITIONS
POSTGRADUATE SCHOOL
BOGOR AGRICULTURAL UNIVERSITY BOGOR
PREFACE
Praise and gratitude are addressed to Allah subhanahu wa ta’alafor all His Grace during the research and study and who has made possible this scientific writing successfully completed. The study was conducted from November 2014 until December 2015 and entitled Improvement of Ethanol Production by Inducer Addition in Recombinant Escherichia coli Culture under Aerobic Conditions.
My deepest appreciation is delivered to all those who helped in this scientific writing process:
1. Prof Dr Ir Djumali Mangunwidjaja, DEA and Dr Prayoga Suryadarma, STP MT as supervisors for their enormous enthusiasm in the scientific research, inspiration, motivation and guidance during study, and research.
2. Dr Ir Mulyorini Rahayuningsih, MSi as external examiner for her guidance and advice in the thesis examination and scientific writing.
3. Prof Dr Ir Suharsono, DEA as Head of Biotechnology Study Program and moderator in the thesis examination for his guidance and sagacity during study and examination.
4. Lecturers and laboratories staffs in Biotechnology Study Program, Research Center of University; and Agroindustrial Technology Department for their help in conducting the research.
5. My parents (The late Icang Sudaryat; and Siti Nuraeni), sisters and brother (Kartika Dewi Puspa, Uswatun Hasanah, Anugrah Akhirut Tasyrik and Ali Mursid); and the all family for their support, affection, prayers, and constant believing me.
6. The members of Bioprocess Engineering Research Group (Indra Kurniawan Saputra, Wahyu Suradi Pranata, Resa Denasta Syarief, Budimandra Harahap, Lianitha Kurniawati, Dian Sukma Riany, Mujtahid Al Fajri, Ricky Susanto Putera, Nurul Muhibbah, Ari Permana Putra, M. Jiyad Hijran and Mara Anda Rival) for their help, motivation, and insightful discussions about scientific matters.
7. Bioindustry Laboratory Member (Ardhi Novrialdi Ginting and Fatimah Jumiati Pasaribu) for their motivation and even help to overcome the difficulties.
8. Biotechnology 2012 Classmates for their motivation and enthusiasm during study and research.
9. My beloved friends (Ratna Sartika, Lestari, Fera Deviyanti Mugni, Imas Siti Solehah, Astri Gustriana Safe’i, Lia Dewi Sri Yanti, Anita Fatimah, Desti Taryanti, Niki Nurul Haq, Rima Vera Ningsih and Dini Lestari) for their great support in study and life at any time; and even lend hand throughout this research.
Hope the thesis useful.
Bogor, March 2016
TABLE OF CONTENTS
LIST OF TABLES vi
LIST OF FIGURES vi
LIST OF APPENDICES vi
1 INTRODUCTION 1
Background 1
Problem Statement 2
Objective 3
Significance of Study 3
2 LITERATURE REVIEW 4
Metabolic Engineering of E. coli for Ethanol Production 4 The fdh Reaction for Regenerating NADH in E. coli Cells 5
IPTG Induction in Recombinant E. coli Cells 6
3 METHODOLOGY 8
Place and Time 8
Bacterial Strains, Plasmids, Media, and Chemicals 8
Procedure 9
4 RESULT AND DISCUSSION 12
Effect of pdc and adhB Introduction on Ethanol Production 12 Role of fdh Reaction and Formate Availability on Ethanol Production 13 Effect of IPTG-Induction on Ethanol Production in E. coli
BW25113∆pta/pHfdh/pTadhB-pdc Culture 14
5 CONCLUSION AND RECOMMENDATION 19
Conclusion 19
Recommendation 19
REFERENCES 19
APPENDIX 23
LIST OF TABLES
1 Development of ethanologenic E. coli strains 5
2 Strains and plasmids used in the study 9
3 Ethanol production in recombinant E. coli of
BW25113∆pta/pHfdh/pTadhB/pdc after 24 h cultivation 14 4 The effect of IPTG-induction time on ethanol production, ethanol yield
on glucose, ethanol yield on biomass, and biomass yield on glucose of
E. coli BW25113pta/pHfdh/pTadhB-pdc at 24 h of cultivation 15
5 Comparison of metabolite yields in ethanologenic E. coli strains 17 6 Summary of the effect of various IPTG concentrations on ethanol
production, biomass and their yields in recombinant E. coli of
BW25113pta/pHfdh/pTadhB-pdc at 0 h induction after 24 h cultivation 18
LIST OF FIGURES
1 Framework of the study 3
2 The stage of study 9
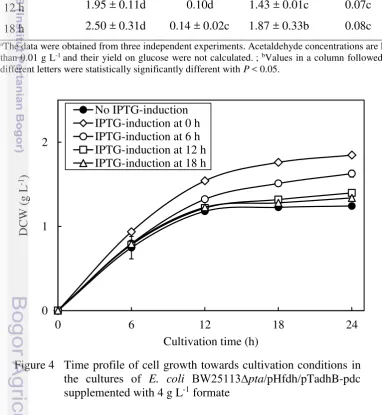
3 Relative mRNA expression of pdc and adhB genes in E. coli strains 12 4 Time profile of cell growth towards cultivation conditions in the
cultures of E. coli BW25113∆pta/pHfdh/pTadhB-pdc supplemented
with 4 g L-1 formate 15
5 Comparison of organic acids accumulation in the cultures of no IPTG-induction and IPTG-induction at 0 h in E. coli
BW25113∆pta/pHfdh/pTadhB-pdc after 24 h cultivation 16
LIST OF APPENDICES
6 Transformation of E. coli strains 23
7 Preculture of E. coli strains 24
8 Growth profile of no IPTG-induction culture of E. coli
BW25113∆pta/pHfdh/pTadhB-pdc 25
9 Ethanol assay 26
10 Glucose assay 27
1
INTRODUCTION
Background
The growing demand of ethanol in replacing fossil fuel has stimulated its production by fermenting renewable carbon using homoethanologenic biocatalyst, including Saccharomyces cerevisiae and Zymomonas mobilis. Renewable carbon such as lignocellulose has been considered as an effective ethanol feedstock due to the non-competing demands (Hahn-Hagerdal et al. 2006). As lignocellulose contains significant amount of pentose sugars, their conversion to ethanol are recalcitrant both for S. cerevisiae and Z. mobilis (Dien et al. 2003). On the other hand, the most studied and characterized organism Escherichia coli can use all of sugar constituents of lignocellulose (Dien et al. 2003). With this capability, E. coli
has been considered as an excellent biocatalyst for ethanol production.
E. coli naturally ferments sugars to a mixture of ethanol and organic acids (Dien et al. 2003). Ethanol is produced from the two step reduction of acetyl-coA by alcohol dehydrogenase (adhE), oxidizing two NADH to NAD+. This native E. coli ethanol-producing pathway is insufficient in facilitating high yield due to the poor efficiency to generate ethanol (Dien et al. 2003). In order to improve ethanol productivity, metabolic engineered E. coli has been attempted by introducing
pyruvate decarboxylase (pdc) and alcohol dehydrogenase (adhB) genes from Z. mobilis under the control of lac promoter (Ingram et al. 1987; Ingram and Conway 1988). With further gene deletions and process modification in anaerobic culture, the ethanol yield could be increased. However, anaerobic fermentation reduces cellular growth and provokes byproduct accumulation, caused by the slow regeneration and competition of utilizing NADH through lactate dehydrogenase
(ldh) pathway(Dien et al. 2003). On the other hand, as ethanol is primary metabolite, its production in microbial cells is made during the exponential phase of growth whose synthesis is an integral part of the normal growth process (Sanchez and Demain2008). That is, a decrement of cellular growth in E. coli cells can be lead to lower ethanol yield. Therefore, it is essential to improve cell performance to obtain maximum ethanol production.
For cell performance improvement, it should provide appropriate culture conditions while maintaining a high level expression of the target product. NADH has profound role in cellular metabolism as cofactor for redox reaction. The effect of NADH regeneration on reduced metabolite compounds had been studied previously (Galkin et al. 1997). Berrios-Rivera et al. (2002) reported that increment of NADH availability by introducing cofactor-dependent formate dehydrogenase
(fdh) provoked significant change in the final metabolite concentration pattern both anaerobically and aerobically. Interestingly, an increase in intracellular NADH under aerobic condition enhanced final cell density and the reduced metabolite compounds, including ethanol (Berrios-Revira et al. 2002; Suryadarma et al.
2
yield. This is limited by non-optimum expression of recombinant genes (Donovan
et al. 1996). For this purpose, it is important to gain an effective expression of recombinant DNA.
The expression of recombinant genes under control lac-derived promoter has been utilized isopropyl β-D-1-thiogalactopyranoside (IPTG) as an inducer (Donovan et al. 1996). Regardless of the effectiveness of IPTG as gratuitous inducer, it is expensive and should be consider in low amounts when used in industrial scale. Commonly, a wide range of IPTG concentration are used without obvious reason. Interestingly, the induction frequently performed at exponential stage culture of E. coli due to the higher cell density (Sambrook and Russel 2001). However, in most cases recombinant DNA expression after induction reduced cell growth in consequence of metabolic load (Glick 1995; Bentley et al. 2009). Therefore, it is of interest to investigate the influence that can be achieved on ethanol production by inducing recombinant E. coli at different of induction times and IPTG concentrations under aerobic conditions.
Problem Statement
Regulating culture conditions while maintaining a high level expression of recombinant genes under the control regulatable promoter have been attempted to enhance the E. coli performance for producing recombinant product (Donovan et al. 1996), including ethanol. Production of ethanol in E. coli under aerobic conditions can be achieved by introducing plasmid harboring pdc and adhB (Ingram
et al. 1987), and plasmid harboring fdh following formate supplementation into cultivation media (Suryadarma et al. 2012a). The reaction of fdh regenerates NADH from NAD+ by degrading formate to overcome the deficiency of NADH by respiration system while the mutant pta of E. coli usage and aerobic cultivation conditions suppressed byproduct accumulations (Ojima et al. 2012; Suryadarma et al. 2012a). However, expressions of recombinant DNA after induction by IPTG addition often caused metabolic load and result in the reduction of cell growth (Bentley et al. 1991; Glick 1995), thereby lowering ethanol yield as target product. Therefore, strategy for regulating IPTG addition for effective recombinant gene expression was required to obtain maximal ethanol production. Implementing the appropriate induction conditions in terms of induction time and IPTG concentration for effective gene expression of pdc and adhB under the control trc promoter; and
3
Objective
The aim of this study is to investigate the effect of IPTG induction in terms of induction time and IPTG concentration in recombinant E. coli culture under aerobic conditions.
Significance of Study
This study will assist to gain the information regarding the strategy of IPTG addition in recombinant E. coli culture. Thus, assist towards the ethanol production improvement in recombinant E. coli culture under aerobic conditions.
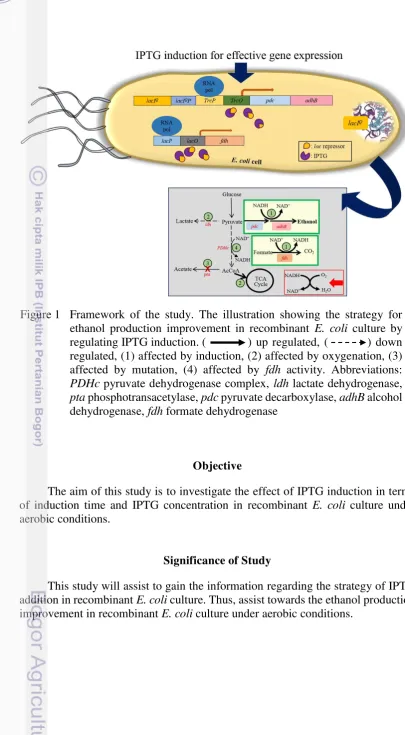
Figure 1 Framework of the study. The illustration showing the strategy for ethanol production improvement in recombinant E. coli culture by regulating IPTG induction. ( ) up regulated, ( ) down regulated, (1) affected by induction, (2) affected by oxygenation, (3) affected by mutation, (4) affected by fdh activity. Abbreviations:
PDHc pyruvate dehydrogenase complex, ldh lactate dehydrogenase,
4
2
LITERATURE REVIEW
Metabolic Engineering of E. coli for Ethanol Production
Current development in industrial ethanol production requires biocatalyst that produce ethanol in high yield and capable in utilizing lignocellulose as a feed stock (Dien et al. 2003). Ethanol-producing strains such as S. cerevisiae and Z. mobilis
are limited to growth on hexoses (Hahn-Hagerdal et al. 2006). On the other hand,
E. coli can use all of sugar constituents of lignocellulose. With several advantages including no requirements for complex growth factor, prior industrial use, its well-characterized genetic, and its well-studied physiological regulation (Dien et al.
2003; Atsumi et al. 2008); the facultative anaerobic E. coli is considered as an effective biocatalyst for ethanol production.
Ethanol is primary metabolite, which is one of the mixed-acid fermentation end products of E. coli. It is produced in wild type cells of E. coli from the two step reduction of acetyl-coA by alcohol dehydrogenase (adhE), oxidizing two NADH to NAD+. Meanwhile, glycolysis generates only one NADH per pyruvate. As a consequence, the native E. coli pathway for ethanol results in an NADH deficit. This is overcome by converting one of the acetyl-coA to acetate, resulting in equal amounts of acetate and ethanol produced by E. coli. Due to the requirement two NADH per ethanol, the native ethanologenic pathway prohibits E. coli from conducting S. cerevisiae or Z. mobilis like-homoethanol fermentation, which generated ethanol as the sole product and only consumes one NADH per ethanol produced (Dien et al. 2003).
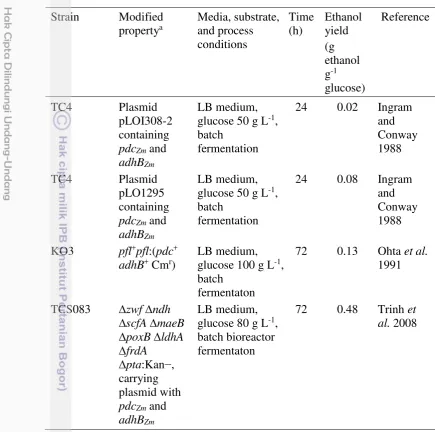
To improve ethanol production in E. coli cells, metabolic engineering by expressing homoethanol pathway has been developed. The development of ethanologenic E. coli strain by different researchers is shown in Table 1. It has been widely reported that metabolically engineered E. coli expressing Z. mobilis genes encoding pyruvate decarboxylase (pdc) and alcohol dehydrogenase (adhB) under control lac promoter is efficiently produced ethanol from pyruvate (Ingram and Conway 1988) because Z. mobilis Km for pdc is quite low compared to
5
The fdh Reaction for Regenerating NADH in E. coli Cells
NADH plays an essential role in cellular metabolism by functioning as a cofactor for redox reactions, particularly in dehydrogenase-catalyzed reactions involved in respiration (Chenault et al. 1988). Due to its function, the availability of this reducing agent determines the metabolic fluxes of many pathways as well as the transcriptional level of many genes. For example, the allosteric inhibition of accumulated NADH on citrate synthase (Weitzman 1966), the inhibition of the high NADH/NAD+ ratio on pyruvate dehydrogenase complex (PDHc) reaction (de Graef et al. 1999), the induction of adhE expression in E. coli by NADH availability
Table 1 Development of ethanologenic E. coli strains Strain Modified
6
(Leonardo et al. 1993), and the triggering factor of acetate overflow by high NADH/NAD+ ratio (Vemuri et al. 2006).
As NADH influences the bioacatalysis of cofactor-dependent enzyme system, deficiency of this reducing agent limits the generation of the reduced metabolites including ethanol. Therefore, an increment NADH availability is believed to be useful for improving ethanol production. The most effective strategy to increase NADH availability utilizes formate dehydrogenase (fdh) to catalyzes NADH regeneration from NAD+ through degradation of formate into CO2 (Chenault et al. 1988). The advantages of fdh reaction include the use of formate as an inexpensive, stable, innocuous substrate; and the generation of CO2, which can be easily removed from the reaction (Chenault et al. 1988).
It has been reported that level of NADH achieved by fdh reactioninduces the production of cofactor-dependent product (Galkin et al. 1997; Berrios-Rivera et al.
2012; Suryadarma et al. 2012a). Since formate is required as a substrate by fdh to regenerates NADH, its concentration should be maintain as high as possible so that this substrate does not become limiting for fdh reaction. However, high concentration of formate may be inhibitory to growth of E. coli due to its toxic effect (Ostling and Lindgren 1993). Therefore, appropriate concentration of formate added in E. coli culture is required to facilitate fdh for regenerating NADH. Previous study reported that different formate concentrations across the range 0−9 g L-1 provided different levels of NADH (Berrios-Rivera et al. 2012), while concentration at 4−10 g L-1 formate was effective in elongating NADH availability by fdh reaction in E. coli cells to generate the reduced metabolite (Suryadarma et al. 2012a).
IPTG Induction in Recombinant E. coli Cells
The lac promoter is widely used as the common system for recombinant protein production in E. coli and it is one of the well-known regulation mechanism.
Various promoters were constructed from lac-derived regulatory element (Polisky
et al. 1976), including the synthetic trc promoter (Brosius et al. 1985). Both lac and
trc promoters are regulatable promoter systems that provide the ability to activate the expression of foreign genes by varying an environmental factor such as the concentration of a particular component in the growth medium (Donovan et al.
1996), whereas a drawback to these promoters is the basal level of transcription (Donovan et al. 1996; Terpe 2006).
Induction of the lac and trc promoters for expressing foreign genes could be achieved by adding chemical inducers such as non-hydrolysable lactose analog isopropyl-β-D-1-thiolgalactopyranoside (IPTG). This inducer binds the lac
repressor, the product of lacI gene, and consequently releases the operator allowing DNA transcription (Donovan et al. 1996). Since IPTG is metabolic free, the level of induction remains constant, thereby making IPTG the most utilized in inducing foreign genes expression for protein production.
7 growth phase is also possible to induce the expression of foreign genes (Ramirez et al. 1994). Additionally, IPTG is often added at 1000 µM to fully induce lac-derived promoter, while a wide range of IPTG concentrations from 0 to 10000 µM can be used to induce gene expression (Wood and Peretti 1991; Bentley et al. 1991; Donovan et al. 1996). However, recombinant DNA expression after induction generally causes a metabolic load on host cell which can result in reduced cellular growth, cell yields, product expression, and plasmid stability (Bentley et al. 1991; Glick 1995). In order to balance the decreasing cell yield after induction, and increasing recombinant expression by the cells; the optimal induction time in the cultivation for inducing expression as well as the optimal concentration of IPTG that needs to be used in the process must be examined (Donovan et al. 1996).
d in the
8
3
METHODOLOGY
Place and Time
This study was conducted at Biotechnology Research Indonesia-The Netherlands (BIORIN), Research Center of Bio-Resources and Biotechnology; and Bioindustry Laboratory, Department of Agroindustrial Technology, Bogor Agricultural University during November 2014 to December 2015.
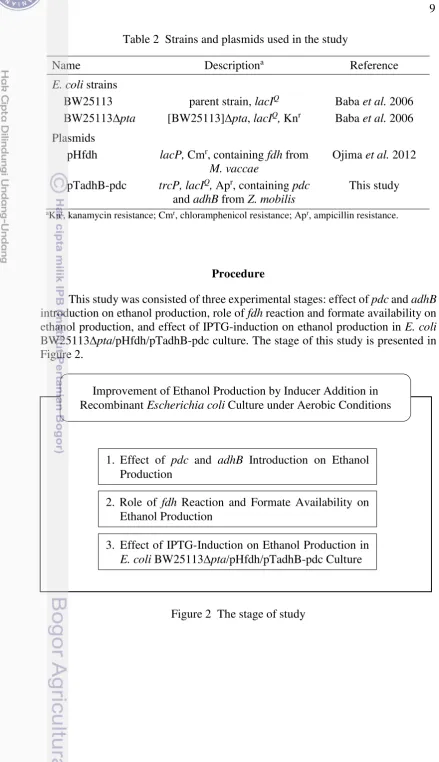
Bacterial Strains, Plasmids, Media, and Chemicals
E. coli strains and plasmids used in this study are listed in Table 2. E. coli
BW25113 and its pta deficient (BW25113∆pta) (Baba et al. 2006) were obtained from National BioResource Project of Japan and used as the host strains. The pHfdh plasmid bearing fdh gene from Mycobacterium vaccae was obtained from previous study (Ojima et al. 2012). Plasmid bearing adhB and pdc genes from Z. mobilis was constructed by cloning these genes into pTrc99A vector, denoted as pTadhB-pdc. These plasmid, pHfdh and/or pTadhB-pdc were further transformed into BW25113 and BW25113∆pta strains.
Luria broth (LB) medium contained 10 g L-1 peptone, 10 g L-1 NaCl and 5 g L-1 yeast extract was used for preculture medium (Miller 1992). Solutions were filtered sterilized using a 0.22 µm filter from Sartorius. Stock solutions of kanamycin (30 mg mL-1, Sigma) were prepared in Milli-Q water, filter sterilized and stored at -20 °C. Stock solutions of chloramphenicol (34 mg mL-1, Sigma) were prepared in absolute ethanol, filter sterilized and stored at -20 °C. Stock solutions of carbenicillin (50 mg mL-1, Sigma) were prepared in Milli-Q water, filter sterilized and stored at -20 °C. Stock solutions of formate (200 g L-1) were prepared by dissolving 30.22 g sodium formate (Merck) into 100 mL bidest water, filter sterilized and stored at 25 °C. IPTG was purchased from Sigma-Aldrich and the stock solutions were prepared by dissolving 2.38 g into 10 mL Milli-Q water and filter-sterilized to obtain of 1 M stock solutions and stored at -20 °C.
9
Procedure
This study was consisted of three experimental stages: effect of pdc and adhB
introduction on ethanol production, role of fdh reaction and formate availability on ethanol production, and effect of IPTG-induction on ethanol production in E. coli
BW25113∆pta/pHfdh/pTadhB-pdc culture. The stage of this study is presented in Figure 2.
Figure 2 The stage of study
Improvement of Ethanol Production by Inducer Addition in Recombinant Escherichia coli Culture under Aerobic Conditions
1. Effect of pdc and adhB Introduction on Ethanol Production
2. Role of fdh Reaction and Formate Availability on Ethanol Production
3. Effect of IPTG-Induction on Ethanol Production in
E. coli BW25113∆pta/pHfdh/pTadhB-pdc Culture Table 2 Strains and plasmids used in the study
Name Descriptiona Reference
E. coli strains
BW25113 parent strain, lacIQ Baba et al. 2006
BW25113∆pta [BW25113]∆pta, lacIQ, Knr Baba et al. 2006 Plasmids
pHfdh lacP, Cmr, containing fdh from
M. vaccae
Ojima et al. 2012 pTadhB-pdc trcP, lacIQ, Apr, containing pdc
and adhB from Z. mobilis
This study
10
Effect of pdc and adhB Introduction on Ethanol Production
To investigate the effect of introduction pdc and adhB, plasmid pTadhB-pdc was introduced into E. coli BW25113 cells by standard genetic method (Sambrook and Russel 2001) as described in Appendix 1. Then followed by preparing the preculture for recombinant strain BW25113/pTadhB-pdc and parent strain BW25113 (Appendix 2). A 5% (v/v) preculture with OD660 nm = 1.0−1.5 was transferred into 50 mL cultivation medium (in 250 mL baffled flask, Sigma) and IPTG at concentration 1000 µM was added to recombinant culture. The cultures then were grown aerobically in an incubator shaker (Ivymen System) at 37 °C under 200 rpm agitation. After 18 h of cultivation, the cultures were harvested and then analyzed for gene expression of pdc and adhB; and ethanol production.
Role of fdh Reaction and Formate Availability on Ethanol Production
Plasmid pHfdh and pTadhB-pdc were introduced into BW25113∆pta strain. The recombinant strain of BW25113∆pta/pHfdh/pTadhB-pdc was then precultured. After OD660 preculture reached 1.0−1.5, a 5% (v/v) of preculture was transferred into cultivation media. The role of fdh and formate availability were studied by culturing recombinant strain BW25113∆pta/pHfdh/pTadhB-pdc with supplementation of 4 g L-1 formate into cultivation medium (Suryadarma et al.
2012a). For comparison, recombinant E. coliof BW25113∆pta/pHfdh/pTadhB-pdc without formate supplementation was also cultured. The cultures were incubated at 37 °C and 250 rpm agitation. Ethanol production then was analyzed after 24 h cultivation.
The Effect of IPTG-Induction on Ethanol Production in E. coli
BW25113∆pta/pHfdh/pTadhB-pdc Culture
The effect of IPTG induction was investigated by analysing the influence of induction time and IPTG concentration on ethanol production. The influence of induction time was performed by preparing the preculture of BW25113∆pta/pHfdh/pTadhB-pdc until OD660 reached 1.0−1.5. A 5% (v/v) of preculture then was transferred into 50 mL cultivation media (in 250 mL baffled flask, Sigma) with 4 g L-1 formate supplementation and incubated at 37 °C and 250 rpm agitation for 24 h. The cultures were induced using 500 µM IPTG and added at 0, 6, 12, and 18 h of cultivation represent different induction phases namely lag, exponential, end of exponential and stationary (Appendix 3). The induction phases were examined by monitoring growth profile of non-induced recombinant E. coli
BW25113∆pta/pHfdh/pTadhB-pdc with 4 g L-1 formate addition. During cultivation, growth profile was analyzed at 6 h interval of cultivation time. Ethanol and organic acids were measured in the cultures after 24 h cultivation.
11 Analysis
Growth of E. coli was monitored by optical density measurement at a wavelength of 660 nm using a spectrophotometer (Hewlett Packard 8453). Samples were diluted with 1 N HCl to dissolve CaCO3, until the final OD660 value was within the range 0.2−0.8. Biomass was represented as dry cell weight (DCW), in which 1 OD660 is equivalent to 0.36 g L-1 (Ojima et al. 2012).
Gene expression analysis for determination activity of pdc and adhB was performed by real time PCR as described previously (Suryadarma et al. 2012b).
For determination of glucose, acetaldehyde and ethanol in the culture, the samples were heated at 80 °C for 15 min and followed by centrifugation (Hettich Zentrifugen, Micro 22R) at 10000 rpm for 5 min. The supernatant was filtered sterilized; and glucose, acetaldehyde, ethanol were determined by enzymatic method using D-Glucose 716251 Kit, Acetaldehyde 668613Kit and Ethanol 176290 Kit, respectively (Roche, Germany) with slight modification (Appendix 4,5,6) .
Concentration of organic acids (pyruvate, lactate, acetate, and formate) in the cultures were quantified by HPLC system (Hewlett Packard, 1100 Series) with mobile phase containing 99% 20 mM Na2HPO4 and 1% acetonitrile. The samples were prepared by centrifugation at 10000 rpm for 5 min, followed by filtration of supernatant using 0.22 µm syringe filter (Sartorius). The samples then diluted by bidest water and injected into the column (Zorbax SB-Aq 883975-914) to separate the compounds. The analysis were performed at 35 °C, 1.0 mL min-1 flow rate and detected at 210 nm.
Metabolite yields on glucose basis (Ymetabolite/glucose) were determined by the formula:
Ymetabolite/glucose (g of metabolite/g of glucose) =
mass of metabolite mass of glucose
where mass of metabolite and mass of glucose represent the metabolite production or appeared in the culture; and glucose consumption, respectively. The percent of theoretical yield of ethanol was calculated by the following equation:
Theoretical yield of ethanol (%) = theoretical yieldactual yield x 100% where
Actual yield = mole of glucose consumedmole of ethanol produced
Ethanol yield on biomass basis (Yethanol/biomass) was determined by the formula: Yethanol/biomass (g of ethanol/g of biomass) =
mass of ethanol mass of biomass
where mass of ethanol and mass biomass represent the ethanol and biomass production or appeared in the culture.
12
4
RESULT AND DISCUSSION
Effect of pdc and adhB Introduction on Ethanol Production
A major challenge in ethanol production by E. coli fermentation is the low yield of ethanol as end product. Although the engineered of E. coli has been shown to produce ethanol efficiently (Ingram and Conway 1988), the ethanol yield is usually held back by the accumulation of byproduct.
In this study, improvement of ethanol production was first investigated by introducing plasmid pTadhB-pdc carrying the Z. mobilis genes encoding pdc and
adhB under the control trc promoter into competent E. coli BW25113. The trc
promoter was chosen to control those Z. mobilis genes since the level of expression under control this promoter system is moderately high (Terpe et al. 2006). The recombinant strain BW25113/pTadhB-pdc and its parent strain BW25113 then were grown aerobically in order to suppress the generation of lactate (Suryadarma
et al. 2012a) during ethanol production. After 18 h, mRNA expression of pdc and
adhB were determined.
Result presented in Figure 3 shows that the expressions of pdc and adhB were found in BW25113/pTadhB-pdc, whereas expression of those genes were not detectable in parent strain. This revealed that ethanologenic pathway from Z. mobilis were successfully expressed in E. colI cells BW25113/pTadhB-pdc. Expression of pdc and adhB in recombinant E. coli were expected to divert the carbon flux from pyruvate into ethanol efficiently and hence can be improved ethanol production (Ingram et al. 1987). To evaluate the effect of introduction those recombinant genes on ethanol production, determination of ethanol concentration in BW25113/pTadhB-pdc and BW25113 cultures were conducted. As expected, the recombinant E. coli expressing pdc and adhB was observed two fold greater of ethanol than parent strain (0.2 g L-1 ethanol). This indicates that the expressions of
pdc and adhB induce ethanol production in E. coli BW25113/pTadhB-pdc under
13 aerobic condition. This obtained result also supports previous study that an elevated level of ethanol in recombinant E. coli culture is the results of relatively high level expression of pdc and adhB (Ingram and Conway 1988). However, although ethanol production was increased by pdc and adhB introduction; the concentration that achieved was still low and needs further improvement.
Role of fdh Reaction and Formate Availability on Ethanol Production
During the aerobic catabolism of glucose by E. coli, acetate production has been associated with a retardation of growth (Eiteman and Altman 2006); while NADH levels remain relatively low since oxygen is used as terminal electron acceptor (Causey et al. 2004). These conditions may lead to low production of the reduced metabolite compounds such as ethanol. Therefore, considerable efforts have been attempted to minimize acetate production, and increase NADH availability as a means of improving the production of reduced metabolite (Galkin
et al. 1995; Ojima et al; Suryadarma et al. 2012a). This can be achieved by regenerating intracellular NADH in a primary acetate-producing pathway (phosphotransacetylase, pta) mutant of E. coli (Ojima et al. 2012; Suryadarma et al. 2012a).
In this study, to further improve ethanol production, pHfdh containing fdh
was introduced into E. coli BW25113∆pta/pTadhB-pdc and cultivated with 4 g L-1 formate supplementation. It was reported that fdh reaction contributes in increasing intracellular NADH (Galkin et al. 1995), while formate concentration at 4 g L-1 was chosen since it is effective to support fdh reaction in E. coli cells(Suryadarma
et al. 2012a). The fdh reaction provides NADH from NAD+ for cofactor-dependent production system by catalyzing the oxidation of formate into CO2 (Chenault et al.
1988;Galkin et al. 1995). Furthermore, these reports suggest that an increment of NADH availability may facilitates production of the reduced metabolite compounds from pyruvate, including ethanol.
Table 3 compares ethanol production of E. coli
BW25113∆pta/pHfdh/pTadhB-pdc cultures with formate supplementation and the control (without formate). In the case of the culture following formate supplementation, ethanol production was observed 1.10 g L-1 and significantly higher than that achieved from the control culture. This result indicates that the addition of formate into culture could be degraded to regenerate NADH (Berrios-Rivera et al. 2002; Suryadarma et al. 2012a), resulting that the increased NADH availability induces ethanol production under aerobic condition. Therefore, it appears that fdh reaction following formate supplementation into recombinant E. coli culture contributes to ethanol production improvement. The obtained ethanol concentrations in these recombinant cultures with and without formate supplementation, however, were the result of basal level transcription the lac and
14
Effect of IPTG-Induction on Ethanol Production in E. coli
BW25113∆pta/pHfdh/pTadhB-pdc Culture
IPTG plays an important role in initiating expression of recombinant DNA under the control of lac-derived promoter. This chemical has been considered as an effective inducer because it is not metabolized by cells and the level of induction is remain constant (Donovan et al. 1996). Meanwhile, recombinant DNA expression after induction generally lead to reduce cellular growth (Glick 1995), and thus consequence in lowering yield of target product (Donovan et al. 1996). Thus, appropriate induction condition is required to obtain maximum product yield (Bentley et al. 1991).
In order to gain the appropriate induction condition for maximum recombinant protein production, the optimal time of inducer added into the culture should be determined. The optimal induction time would depend on the response of strains during the induction phase (Donovan et al. 1996). Generally, induction of recombinant DNA in E. coli is performed at exponential phase due to E. coli
cells’ optimum physiology (Sambrook and Russel 2001). But later it was reported that rRNA was degraded upon induction at high specific growth rate (Sanden et al.
2003). Performing induction at stationary phase reduced cell viability (Duan et al.
2000). Besides, early induction may lengthen the lag phase. However, in contrast, induction throughout the entire growth phase was reported could be possible for recombinant protein production (Ramirez et al. 1994).
In this study, the effect of induction time in E. coli
BW25113∆pta/pHfdh/pTadhB-pdc was investigated by addition 500 µM IPTG at 0, 6, 12 and 18 h of cultivation time represents growth phase of lag, exponential, end of exponential and stationary, respectively. The obtained result from those cultures for ethanol production, ethanol yield on glucose (Yethanol/glucose), ethanol yield on biomass (Yethanol/biomass) and biomass yield on glucose (Ybiomass/glucose) are shown in Table 4. In average, ethanol production in the cultures with IPTG addition at different induction times were found significantly higher than without induction. These results clearly demonstrate that the addition of IPTG allowed the regulatable promoter to activate the expression of recombinant genes (Donovan et al. 1996), including fdh, pdc, and adhB, which in turn induces ethanol production. When a regulatable promoter is used for foreign expression, the common practice is to promote high cell growth first without induction, then followed by induction step Table 3 Ethanol production in recombinant E. coli of BW25113∆pta/pTadhB-pdc
after 24 h cultivationa
E. coli strains Formate added
(g L-1)
Ethanol (g L-1)b
BW25113pta/pHfdh/pTadhB-pdc 0 0.13a
BW25113pta/ pHfdh/pTadhB-pdc 4 1.10 ± 0.12b
aThe data were obtained from three independent experiments.; bValues in a column followed by
15 to obtain high yield product (Sambrook and Russel 2001). In contrast, early induction (IPTG addition at 0 h) was observed the highest ethanol concentration at 4.09 g L-1 in this study, suggesting IPTG-induction at 0 h of cultivation time effectively improves ethanol production among the other induction times. To explain these observations, growth profiles of E. coli
BW25113∆pta/pHfdh/pTadhB-pdc in those cultures were monitored as shown in Figure 4. Biomass concentrations after 24 h of cultivation were higher in all IPTG-Table 4 The effect of IPTG-induction time on ethanol production, ethanol yield on
glucose, ethanol yield on biomass, and biomass yield on glucose of E. coli
BW25113pta/pHfdh/pTadhB-pdc at 24 h of cultivationa Time of
aThe data were obtained from three independent experiments. Acetaldehyde concentrations are less
than 0.01 g L-1 and their yield on glucose were not calculated.; bValues in a column followed by
different letters were statistically significantly different with P < 0.05.
16
induction cultures than in the control (no IPTG-induction). The highest biomass production was observed in the culture that induced at 0 h, followed respectively by IPTG-induction at 6, 12, and 18 h of cultivation time. These observations indicate that IPTG induction time influenced the growth of BW25113∆pta/pHfdh/pTadhB-pdc in association with ethanol production as primary metabolite. This conclusion was further supported by yields calculation from recombinant cultures (Table 4). The results showed that IPTG-induction at 0 h yielded the highest Yethanol/biomass, while the values for Yethanol/glucose and Ybiomass/glucose were relatively lower among induction times strategy. This increase in Yethanol/biomass is consistent with an increased in ethanol production (Table 4), suggesting that the higher in biomass synthesis contributes to higher ethanol concentration.
Studies in recombinant genes expressionunder control of inducible promoter reported that IPTG addition had growth inhibiting effect in the host cell of E. coli
(Donovan et al. 1996). However, the obtained results here demonstrate that IPTG addition makes a significant contribution to the growth of recombinant strain. This phenomena might has been due to the influence of fdh reaction by IPTG-induction. With the aim of evaluating the influence of fdh in E. coli growth which is correlated with ethanol production; the accumulation of organic acids at 24 h of cultivation time were compared in the cultures of no IPTG-induction and IPTG-induction at 0 h (Figure 5). As can be seen, accumulation of pyruvate, lactate, and acetate for IPTG-induction at 0 h were similar to no IPTG-induction. Meanwhile, the residual formate concentration in the culture is considerably lower for IPTG-induction at 0 than for no induction. These results suggest that activity of fdh reaction effectively regenerates NADH from the degradation of formate and assist in ethanol production improvement when IPTG was added at 0 h of cultivation time. Since the degradation of formate released the recombinant cells from cytotoxicity (Ojima et al. 2012), it is presumed that the cells experiencing to activate fdh faster when induced at 0 h by IPTG comparable to other inductions.
17 An imperative characteristic in developing ethanologenic strain is to obtain high ethanol production with the yield approaching the theoretical maximum. Obtaining a high ethanol yield means using strains that produce ethanol with few byproducts, and metabolize all major sugars (Dien et al. 2003). To evaluate the effectiveness of current strategy in improving ethanol production, Table 4 compares the obtained metabolite yields by ethanologenic strain in this study and previous report. Theoretical yield of ethanol was observed at 27%, which was higher than that achieved by Ohta et al. (1991). Interestingly, lactate and acetate yields were not detectable and at a negligible value, respectively; whereas in the observation of Ohta et al. (1991) reported that those byproducts were yielded at quite high values. These observations compared to previous report, indicates that the strategy used in the current study to develop ethanologenic strain, is effective for ethanol production although it was performed under aerobic conditions.
Beside induction time, the recombinant DNA expression in generating product target is also influenced by concentration of inducer (Donovan et al. 1996). A wide range concentration of IPTG at 0-10000 µM has been used in order to induce lac-derived promoter, while in most cases concentration around 1000 µM is frequently used to fully induce this system (Donovan et al. 1996). High concentrations of IPTG that are often to fully induce lac promoter do not necessarily confer maximal expression of target protein due to metabolic load constraints (Glick 1995), which led to the reduction of cellular growth rates, and in turn, may substantially affect the total and functional yields of target product (Donovan et al.
1996). Therefore, regulation of the level recombinant DNA expression during induction phase by using appropriate IPTG concentration has been chosen to balance the decreasing biomass productivity after induction and increasing protein expression by the cells (Donovan et al. 1996).
In this study, to investigate the effect of inducer concentration in recombinant
E. coli producing ethanol, IPTG was added at the optimal induction time (IPTG-induction at 0 h) with the range concentration 0-2000 µM. Table 6 summarizes the result of the effect of various IPTG concentration experiments, including biomass, ethanol, ethanol yield on glucose (Yethanol/glucose), biomass yield on glucose (Ybiomass/glucos), and ethanol yield on biomass (Yethanol/biomass). The result showed that
Table 5 Comparison of metabolite yields in ethanologenic E. coli strains
Strain, modified property and cultivation timea
Metabolite yield (g metabolite g glucose-1)b
% Theoretical
yield of ethanolc Yeth/glu Ylac/glu Yace/glu
BW25113∆pta, pTadhB-pdc
Yethanol/glucose; Y lac/lac, Y lactate/glucose; Yace/glu, Y acetate/glucose; Nd, Not detected; (*)The yield have the
value of less than 0.01 g acetate g glucose-1.; cTheoretical yield of ethanol was calculated by
considering theoretical maximum yield of 2 mol of ethanol per mol of glucose.; dThis study.; eOhta
18
although ethanol production was increased by IPTG-induction, there were no significant ethanol improvement observed at higher inducer concentrations from 50-2000 µM. Meanwhile, all induced cultures gave similar trends with no differences on biomass production were found. Because no significant differences on ethanol and biomass concentration were observed, the result were expressed in terms of Yethanol/glucose, Ybiomass/glucose, and Yethanol/biomass; to further provide understanding the effect of different inducer concentrations in recombinant cultures. It showed the yields of ethanol and biomass in the cultures with various inducer concentrations were relatively similar. These data reveals that concentration of IPTG across the range 50–2000 µM have similar impact on ethanol, biomass and their yields. Possible explanation of these observations could be that the complete titration lac repressor by IPTG (Donovan et al. 1996). This trend shows agreement with the study of Wood and Paretti (1991) which reported a linear trend in β -galactosidase mRNA synthesis rate with inducer concentration up to 1000 µM IPTG and further increases in concentration up to 7500 µM IPTG appeared to reach a plateau, suggests that complete titration of lac repressor molecules achieved by using 1000 µM IPTG. Taken together, in this study, the addition of 50 µM IPTG had completely titrated lac repressor and represented full induction on the ethanol production of recombinant E. coli BW25113∆pta/pHfdh/pTadhB-pdc, and more IPTG addition did not have significant effect in improving the production of
19
5
CONCLUSION AND RECOMMENDATION
Conclusion
The addition of IPTG in recombinant E. coli cultures were found to improve ethanol production under aerobic conditions. IPTG-induction at different times significantly influenced ethanol production, with IPTG-induction at 0 h showed the highest ethanol production improvement. Although induction by using various concentrations in the range 50-2000 µM IPTG showed similar impact on ethanol production, this study demonstrates that low inducer concentration (approximately 50 µM IPTG) was effective to enhance the ethanol production in recombinant E. coli culture under aerobic conditions.
Recommendation
The result in the current study found that accumulation of pyruvate and residual formate, were remain high in the IPTG induced culture of recombinant E. coli, indicating the low availability of NADH. A further study is needed to improve
fdh activity in providing intracellular NADH, thereby can be further to convert pyruvate into ethanol.
REFERENCES
Atsumi S, Cann AF, Connor MR, Shen CR, Smith KM, Brynnildsen MP, Chou KJY, Hanai T, Liao JC. 2008. Metabolic engineering of Escherichia coli for 1-butanol production. Metab Eng. 10(6):305-311.
Baba T, Ara T, Hasegawa M, Takai M, Okumura Y, Baba M, Datsenko KA, Tomita M, Wanner BL, Mori H. 2006. Construction of Escherichia coli K-12 in-frame, single-gene knockout mutants: the Keio collection. Mol Syst Biol. 2.doi: 10.1038/msb4100050.
Bentley WE, RH Davis, Kompala DS. 1991. Dynamics of CAT expression in E. coli. Biotechnol Bioeng. 38: 749-760.doi: 10.1002/bit.260380709.
Bentley WE, Mirjalili N, Anderson DC, Davis R, Kompala DS. 2009. Plasmid-encoded protein: the principal factor in the metabolic burden associated with recombinant bacteria. Biotechnol Bioeng. 102(5):1284-1297.
Berrios-Rivera SJ, Bennett GN, Sann K. 2002. Metabolic engineering of
Escherichia coli: increase of NADH availability by overexpressing an NAD+ -dependent formate dehydrogenase. Metab Eng. 4:217-229.doi: 10.1006/mben.2002.0227.
Brosius J, Erfle M, Storella J. 1985. Spacing of the -10 and -35 regions in the tac
promoter: Effect on its in vivo activity. J Biol Chem. 260: 584-588.
Causey TB, Shanmunagam KT, Yomano LP, Ingram LO. 2004. Engineering
20
Clark DP. 1989. Fermentation pathways of Escherichia coli [Review]. FEMS Microbiol. 5(3):223-234.
Chenault HK, Simon ES, Whitesides GM. 1988. Cofactor regeneration for enzyme-catalyzed synthesis. Biotechnol Genet Eng Rev. 6:221-270.
de Graef MR., Alexeeva S, Snoep JL, de Mattos MJT. 1999. The steady-state internal redox state (NADH/NAD) reflects the external redox state and is correlated with catabolic adaptation in Escherichia coli. J Bacteriol. 181:2351-2357.
Dien BS, Cotta MA, Jeffries TW. 2003. Bacteria engineered for fuel ethanol production: current status [Review]. Appl Microbial Biotechnol. 63:258-266.doi: 0.1007/s00253-003-1444-y.
Donovan RS, Robinson CW, Glick BR. 1996. Optimizing inducer and culture conditions for expression of foreign proteins under the control of the lac
promoter [Review]. Journal of Industrial Microbiology. 16:145-154.
Duan KJ, Lin MT, Hung YC, Lin CT, Chen CW, Sheu DC. 2000. Production of GST-SOD fusion protein by recombinant E. coli XL1 Blue. J Chem Technol Biotechnol. 75:722-728. 10.doi: 1002/1097-4660.
Eiteman MA, Altman E. 2006. Overcoming acetate in Escherichia coli recombinant protein fermentations [Review]. Trens Biotechnol. 24:530-536.doi: 10.1016/j.tibtech.2006.09.001.
Galkin A, Kulakova L, Tishkov V, Esaki N, Soda K. 1995. Cloning of formate dehydrogenase gene from a methanol-utilizing bacterium Mycobacterium vaccae N10. Appl Microbiol Biotechnol. 44:479-483.
Galkin A, Kulakova L, Yoshimura T, Soda K, Esaki N. 1997. Synthesis of opticaly amino acids from alpha-keto acids with Escherichia coli cells expressing heterologous genes. Appl Environ Microbiol. 63(12):4651-4656.
Glick BR. 1995. Metabolic load and heterologous gene expression. Biotechnol Adv. 13:247-261.
Hahn-Hagerdal B, Galbe M, Gorwa-Grauslund MF, Liden G, Zacchi G. 2006. Bio-ethanol - the fuel of tomorrow from the residues of today. Trends Biotechnol. 24(12):549-556.doi: 10.1016/j.tibtech.2006.10.004.
Ingram LO, Conway T, Clark DP, Sewell GW, Preston JF. 1987. Genetic engineering of ethanol production in Escherichia coli. Appl Environ Microbiol. 53(10):2420–2425.
Ingram LO, Conway T. 1988. Expression of different levels of ethanologenic enzymes from Zymomonas mobilis in recombinant strains of Escherichia coli. 54(2):397-404.
Leonardo M R, Cunningham PR., Clark DP. 1993. Anaerobic regulation of the
adhE gene, encoding the fermentative alcohol dehydrogenase of Escherichia coli. J Bacteriol. 175(3):870-878.
Miller JH. 1992. A short course in bacterial genetics: a laboratory manual and handbook for Escherichia coli and related bacteria. New York: Cold Spring Harbor.
21 Ojima Y, Suryadarma P, Tsucida K, Taya M. 2012. Accumulation of pyruvate by changing the redox status in Escherichia coli. Biotechnol Lett. 34:889-893.doi: 10.1007/s10529-011-0842-y.
Ostling CE, Lindgren SE. 1993. Inhibition of enterobacteria and Listeria growth by lactic, acetic and formic acids. J Appl Bacteriol. 75(1):18-24.
Peterson JD, Ingram LO. 2008. Anaerobic respiration in engineered Escherichia coli with an internal electron acceptor to produce fuel ethanol. Ann NY Acad Sci. 1125:363-372.
Polisky B, Bishop RJ, Gelfand DH. 1976. A plasmid cloning vehicle allowing
regulated expression of eukaryotic DNA in bacteria. Proc Natl Acad Sci USA.
73:3900-3904.
Ramirez OT, Zamora R, Espinosa G, Merino E, Bolivar F, Quintero R. 1994. Kinetic study of penicillin acrylase production by recombinant E. coli in batch cultures. Process Biochem. 29:197-206.
Sanchez S, Demain AL. 2008. Metabolic regulation and overproduction of primary metabolites. Microb Biotechnol. 1(4):283-319.
Sanden AM, Prytz I, Ioannis T, Forberg C, Le H, Hektor A, Neubauer P, Pragai Z, Harwood C, Ward A et al. 2003. Limiting factors in Escherichia coli fed-batch production of recombinant proteins. Biotechnol Bioeng. 81(2):158-66.doi: 10.1002/bit.10457.
Sambrook J, Russell DW. 2001. Molecular cloning: a laboratory manual. Cold Spring Harbor, New York.
Suryadarma P, Ojima Y, Tsuchida K, Taya M. 2012a. Design of Escherichia coli
cell culture for regulating alanine production under aerobic conditions. J Chem Eng Japan. 45(8):604-608.
Suryadarma P, Ojima Y, Fukuda Y, Akamatsu N, Taya M. 2012b. The rpoS
deficiency suppresses acetate accumulation in glucose-enriched culture of
Escherichia coli under an aerobic condition. Front Chem Sci Eng. 6:152-157.doi: 10.1007/s11705-012-1287-0.
Terpe K. 2006. Overview of bacterial expression systems for heterologous protein production: from molecular and biochemical fundamentals to commercial systems. Appl Microbiol Biotechnol. 72:211-222.
Trinh CT, Unrean P, Srienc F. 2008. Minimal Escherichia coli cell for the most efficient production of ethanol from hexoses and pentoses. Appl Environ Microbiol. 74(12):3634-3643.
Vemuri GN, Altman E, Sangurdekar DP, Khodursky AB, Eiteman MA. 2006. Overflow metabolism in Escherichia coli during steady state growth: transcriptional regulation and effect of the redox reaction. Appl Environ Microbiol. 72(5): 3653-3661.
Weitzman PDJ. 1966. Regulation of citrate synthase activity in Escherichia coli.
Biochim Biophys Acta. 128:213-215.
23 Appendix 1 Transformation of E. coli cells
Competent cells were prepared to be transformed by pTadhB-pdc into E. coli
BW25113 and/or BW25113∆pta and to co-transform pHfdh into E. coli
BW25113∆pta by alkaline lysis method (Sambrook and Russel 2001). In both cases,
E. coli precultures (Appendix 2) were grown to an OD660 nm = 0.4−0.5 and then were made competent by harvesting 1.5 mL cell cultures and resuspending cell pellet in 100 µL 0.05 mM CaCl2 containing 15% glycerol, and incubated at 4 °C. A 100 µL competent cells were transformed with 1 µL plasmid and incubated for 30 min at 4 °C, then were heat shocked for 45 sec at 42 °C and incubated for 5 min at 4 °C. 100 µL 2xYT were immediately added, and incubated for 30−60 min, 250 rpm at 37 °C. Cells were plated onto LA to select bacteria that were Apr or Apr + Cmr for pTadhB-pdc and [pTadhB-pdc and pHfdh] transformations, respectively. Correct transformation and co-transformation with pTadhB-pdc and pHfdh were re-verified isolating the plasmids using GeneJET Plasmid Miniprep Kit (Thermo Scientific, USA) according to manufacturer’s instructions and subsequent digestion with
24
Appendix 2 Preculture of E. coli strains
25 Appendix 3 Growth profile of no IPTG-induction culture E. coli
BW25113∆pta/pHfdh/pTadhB-pdc
Arrows indicate different the induction times where IPTG were added 0
1 2
0 6 12 18 24
DCW
(g
L
-1)
26
Appendix 4 Ethanol Assay (UV-method, Cat. No. 10 176 290 035) Test-Combination Contains
Bottle 1 with approx. 100 ml of solution, consisting of potassium diphosphate buffer, pH approx. 9.0. Bottle 2 with approx. 30 tablets, each tablet contains NAD, approx. 4 mg; aldehyde dehydrogenase, approx. 0.8 U. Bottle 3 with approx. 1.6 mL suspension, consisting of ADH, approx. 7000 U. Bottel 4 with ethanol assay control solution for assay control purposes. Use the assay control solution undiluted. Preparation of reagents
All kit contents are stable at 2 to 8°C except for reaction mixture 2. Solution 1 was bring to room temperature before use. Immediately before use, one tablet from the Bottle 2 was dissolved in 3 mL of Solution 1 in a centrifuge tube for every 2 assays. This was Reaction Mixture 2 (stable for 1 day at 2 to 8°C, bring to room temperature before use). Bottle 1 and Bottle 3 were used undiluted.
Ethanol Assay Procedure
The absorbance of Spectrophotometer (Hewlett Packard 8453) was set to zero by reading the cuvette (Plastibrand Disposable UV-cuvette) against Milli-Q water at 340 nm. The blank was prepared by diluting 1500 µL Reaction Mixture 2 with 50 µL Milli-Q water. The cuvette was capped immediately and then the reagents were mixed by inverting several times. After approximately 3 minutes, the absorbance was read (A1 blank). Then 25 µL Solution 3 was added into cuvette. The cuvette was capped and mixed by inverting several times. The absorbance (A2 blank) was read after approximately 5 minutes.
For determination absorbance of sample or control, 50 µL sample or ethanol assay control (Solution 4) was resuspended with 1500 µL Reaction Mixture 2. The cuvette was capped immediately and then the reagents were mixed by inverting several times. After approximately 3 minutes, the absorbance of sample (A1 sample) or control (A1 control) was read. Then 25 µL Solution 3 was added into cuvette. The cuvette was capped and mixed by inverting several times. The absorbance of sample (A2 sample) or control (A2 control) was read after approximately 5 minutes. If A2 sample was above 1.00, the sample should be diluted until it was below 1.00. If A2 sample was below 1.00, the volume of sample should be increased until 250 µL. The new sample volume should be taken into account in the concentration calculation. Determination of absorbance differences for Control and Sample were calculated by Eq:
ΔAcontrol = (A2 – A1)control – (A2 – A1)blank ΔAsample = (A2 – A1)sample – (A2 – A1)blank Concentration Control and Sample were calculated as follow:
27 Appendix 5 Glucose Assay (UV-method, Cat. No. 10 716 251 035)
Test-Combination Contains
Three bottles 1, each with approx. 7.2 g powder mixture, consisting of triethanolamine buffer, pH approx. 7.6; NADP, approx. 110 mg; ATP, approx. 260 mg; magnesium sulfate. Three bottles 2, each with approx. 1.1 mL suspension, consisting of hexokinase, approx. 320 U; glucose-6-phosphate dehydrogenase, approx. 160 U. Bottle 3 with D-glucose assay control solution for assay control purposes
Preparation of Reagents
45 mL Milli-Q was added to one Bottle 1 and mixed until powder was completely dissolved. Equilibrate to room temperature before use (solution 1 is stable for 4 weeks at 2 to 8 °C, or for 2 months at -15 to -25 °C). Suspension 2 is stable at 2 to 8°C.
Glucose Assay Procedure
The absorbance of Spectrophotometer (Hewlett Packard 8453) was set to zero by reading the cuvette (Plastibrand Disposable UV-cuvette) against Milli-Q water at 340 nm. The blank was prepared by suspending 500 µL Solution 1 with 1000 µL Milli-Q water. The cuvette was capped immediately and then the reagents were mixed by inverting several times. After approximately 3 minutes, the absorbance was read (A1 blank). Then 10 µL Solution 2 was added into cuvette. The cuvette was capped and mixed by inverting several times. The absorbance (A2 blank) was read after approximately 5 minutes.
For determination absorbance of sample or control, 100 µL sample or glucose assay control (Solution 3) was resuspended with 500 µL Solution 1 and 900 µL Milli-Q water. The cuvette was capped immediately and then the reagents were mixed by inverting several times. After approximately 3 minutes, the absorbance of sample (A1 sample) or control (A1 control) was read. Then 10 µL Solution 3 was added into cuvette. The cuvette was capped and mixed by inverting several times. The absorbance of sample (A2 sample) or control (A2 control) was read after approximately 15 minutes. If A2 samplewas above 1.00, the sample should be diluted until it was below 1.00. If A2 sample was below 1.00, the sample volume should be increased until 1000 µL and Milli-Q water volume should then be reduced. The new sample volume should be taken into account in the concentration calculation. Determination of absorbance differences for Control and Sample were calculated by Eq:
ΔAcontrol = (A2 – A1)control – (A2 – A1)blank ΔAsample = (A2 – A1)sample – (A2 – A1)blank
Concentration Control and Sample were calculated as follow:
Control Concentration (g L-1) = 0.4318 x ΔAcontrol (control volume = 100μl) Sample Concentration (g L-1) = 0.4318 x ΔAsample (sample volume = 100μl)