1 23
Theory in Biosciences
ISSN 1431-7613
Volume 132
Number 3
Theory Biosci. (2013) 132:195-206
DOI 10.1007/s12064-013-0181-8
Modified minimal model for effect of
physical exercise on insulin sensitivity and
glucose effectiveness in type 2 diabetes and
healthy human
1 23
O R I G I N A L P A P E R
Modified minimal model for effect of physical exercise
on insulin sensitivity and glucose effectiveness in type 2
diabetes and healthy human
Agus Kartono
Received: 7 September 2012 / Accepted: 7 March 2013 / Published online: 11 April 2013
ÓSpringer-Verlag Berlin Heidelberg 2013
Abstract The Bergman’s minimal model of glucose and insulin plasma levels is commonly used to analyse the results of glucose tolerance tests in humans. In this paper, we present the modified minimal model with plasma insulin compartment under the assumption that if the plasma glucose compartment drops below the basal glu-cose levels, the rate of insulin entering the plasma gluglu-cose compartment is zero. Insulin is cleared from the plasma insulin compartment at a rate proportional to the amount of insulin in the plasma insulin compartment. The modified minimal model was used to study the effect of physical exercise via parameters of a mathematical model to qual-itative the magnitude of changes in insulin sensitivity (SI) and glucose effectiveness (SG) in response to exercise in type 2 diabetes and healthy human. The short-term effects of physical exercise in type 2 diabetes did not improveSG, but markedly improved the lowSIvalues found in type 2 diabetes, indicating that the effects of exercise on SI are quantitatively important in the interpretation of training-relatedSIchanges and may even be therapeutically useful in type 2 diabetes patients. Physical exercise is indicated either to prevent or delay the onset of type 2 diabetes or to assure a good control of type 2 diabetes by increasing insulin sensitivity.
Keywords Minimal model Glucose plasmaInsulin plasmaInsulin sensitivity Glucose effectiveness
Introduction
The effect of physical exercise to enhance insulin action has been well documented for 20 years and has been known as a clinical fact by diabetologists for much longer. Exercise alone has been shown to improve insulin sensi-tivity in numerous studies (Kahn et al. 1990; Short et al.
2003; Poehlman et al.2000; Cox et al.1999; Rodnick et al.
1987). Six- and nine months endurance exercise in healthy older people increased insulin action and, as expected, decreased glucose-stimulated insulin secretion (Kahn et al.
1990; Kirwan et al. 1993), given the hyperbolic relation-ship between insulin sensitivity and insulin secretion (Bergman et al.2002; Kahn et al.1993). Seven-day aerobic exercise studies have also been performed with findings of increased insulin sensitivity, including in healthy older people (Cox et al.1999; Houmard et al.2000).
Physical exercise is a cornerstone in the initial treatment of patients with type 2 diabetes. In skeletal muscle, the insulin sensitizing effect of training in both healthy indi-viduals and patients with type 2 diabetes is well docu-mented (Dela et al.1992,1993,1994). In individuals with a genetic predisposition for type 2 diabetes, first-degree rel-atives (FDR) of patients with type 2 diabetes, only a few training studies have been carried out, and none have directly examined the effect of physical training on insulin sensitivity in skeletal muscle and adipose tissue. The major effect of training on insulin action is located in skeletal muscle (Dela et al.1992,1995), but adipose tissue can also be influenced by exercise training, and it has been previ-ously demonstrated that insulin sensitivity and glucose transporter 4 (GLUT-4) content in adipose tissue increase in response to training (Stallknecht et al.1993,2000).
The review information to provide the role of physical exercise in the prevention of skeletal muscle insulin A. Kartono (&)
Laboratory for Theoretical and Computational Physics, Physics Department, Faculty of Mathematical and Natural Sciences, Bogor Agricultural University (IPB), Jalan Meranti, Building Wing S, 2nd Floor, Kampus IPB Darmaga, Bogor 16680, Indonesia
resistance, that is, the inability of insulin to properly cause glucose uptake into skeletal muscle is presented by Tur-cotte and Fisher (2008). Insulin resistance is associated with high levels of stored lipids in skeletal muscle cells. Physical exercise decreases the amounts of these lipid products and increases the lipid oxidative capacity of muscle cells. Thus, physical exercise may prevent insulin resistance by correcting a mismatch between fatty acid uptake and fatty acid oxidation in skeletal muscle. Addi-tionally, a single session of physical exercise increases glucose uptake by muscle during physical exercise, increases the ability of insulin to promote glucose uptake, and increases glycogen accumulation after exercise, all of which are important to blood glucose control. There also is some indication that resistance exercise may be effective in preventing insulin resistance. The information provided is intended to help clinicians understand and explain the roles of physical exercise in reducing insulin resistance. The short-term effects of physical exercise are important to blood glucose control, such as increased glucose uptake by muscle during exercise and the increased ability of insulin to promote the storage of glucose in muscle after exercise. Diabetes mellitus is essentially the abnormal regulation of blood glucose concentrations. Elevated fasting blood glucose levels or extreme or prolonged increases in blood glucose levels during an oral glucose tolerance test (for which blood glucose concentrations are assayed before and periodically after a fasting individual drinks a beverage containing 75 g of glucose) lead to a diagnosis of diabetes. It is clear, then, that the control of blood glucose concen-trations is the key to the prevention of diabetes. Insulin robustly stimulates the transport of glucose out of the bloodstream and into tissues, such as skeletal muscle, that express GLUT-4, the insulin regulated glucose transporter. Because of the high responsiveness of skeletal muscle to insulin and the large overall mass of skeletal muscle, most glucose that is cleared from the blood in response to insulin in humans is stored as glycogen in skeletal muscle. When insulin-stimulated glucose transport into skeletal muscle is diminished—as it is in people with diabetes—the result is an inability to keep blood glucose concentrations within normal ranges. Thus, skeletal muscle plays a primary role in the maintenance of normal blood glucose concentrations (Turcotte and Fisher2008).
After physical exercise, insulin sensitivity (SI) was increased by 773 % (from 0.62±0.16 to 5.41±
1.59 min-1910-4/(U/ml)), whereas glucose effective-ness (SG) remained unchanged. A new information pro-vided is presented by Bordenave et al. (2008), that is,SIas measured by the minimal model is dramatically improved in type 2 diabetic patients and, in the short-term, can even achieve the zone of human healthy values at rest. In con-trast, the exercise-induced increase in SG observed in
healthy human subjects using the same protocol was not seen in type 2 diabetic patients, suggesting little or no effect of short bouts of acute exercise on SG in type 2 diabetics. This finding is important for interpreting minimal model measures ofSIandSGin diabetics during exercise training protocols, as the acute effects of exercise are quantitatively important and need to be separated from chronic effects. Also, the magnitude of the short-term rise inSIsuggests that repeated acute exercise may be, on its own, powerful insulin-sensitizer independent of the addi-tional and well-demonstrated long-term effects of regular exercise training.
The regular physical activity has been recommended to diabetic patients for a longtime. In the general population, a reduction of the vascular morbidity is observed in patients having a raised cardio-respiratory fitness and/or a high level of physical activity. The protective cardiovas-cular effect is partly explained by the fact that regular physical activity improves anomalies of the multi-meta-bolic syndrome, i.e., increase of the insulin sensitivity (SI), diminution in the fatty mass, improvement of the lipid profile, increase of the fibrinolyse, arterial pressure decrease and incidence reduction of the non-insulin-dependent diabetes (NIDD). On the other hand, physical activity is often indicated in the treatment of NIDD besides diet and tablets. However, two remarks can be made. First, for several reasons (age, sedentary life, weight, blood pressure), patients are unable to keep with sustained regular physical activity. Second, as, in general, NIDD affects people after the age of 40 years, intensive effort can be dangerous especially for patients with reti-nopathy, neuropathy, high blood pressure or heart prob-lems. For insulin-dependent diabetes (IDD), the problem is different, since, in general, at diagnosis, patients are young and often prone to sport and physical activity. Moreover, one of the major goals of the treatment is to convince the (young) patient that person can have a ‘normal’ life provided that he can ensure a good control of the blood glucose. So physical activity is well recom-mended, but not without risk of hypo- and hyperglycemia. One should stress that no common recipe is available but each patient may find that a combination of insulin doses, carbohydrates intake and the kind of physical activity will lead him to an ideal fitness and control of diabetes. The regulation of blood glucose concentration is mainly achieved by acting on three control variables: insulin, meals and physical exercise. However, all the proposed control systems have focused on the definition of insulin therapy strategies; meals and physical exercise are usually considered as (known) disturbances (Derouich and Bou-tayeb2002).
insulin kinetics by Pacini and Bergman (1986) and Riel (2004). We present the modified minimal model with plasma insulin compartment under the assumption that if the plasma glucose compartment drops below the basal glucose levels, the rate of insulin entering the plasma glucose compartment is zero. Insulin is cleared from the plasma insulin compartment at a rate proportional to the amount of insulin in the plasma insulin compartment. We also presented a modified minimal model with plasma insulin compartment for physical exercise and insulin therapy in type 2 diabetes using assumptions of physical effort from Derouich and Boutayeb (2002) and Zheng and Zhao (2005). In using mathematical model of physical activity in this paper, our first purpose was to illustrate clearly the effect of exercise on the dynamics of insulin and glucose to confirm the role of physical activity as a pre-vention for people at type 2 diabetes risk, to stress the benefit that can be gained by non-insulin-dependent type 2 diabetes from improving insulin sensitivity, and second, to reassure insulin-dependent type 2 diabetes people that no exclusion is made provided a good combination is found to balance between insulin doses and physical intensity. Finally, to qualitative the magnitude of changes in insulin sensitivity (SI) and glucose effectiveness (SG) in response to exercise in type 2 diabetes. Insulin sensitivity (SI) and glucose effectiveness (SG) are the two main factors con-trolling glucose tolerance.
Mathematical model
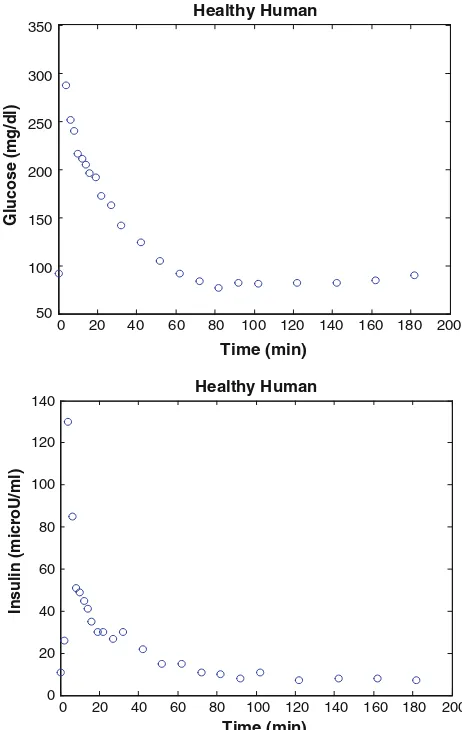
Minimal models of glucose and insulin plasma levels are commonly used to analyse the experimental results of glucose tolerance tests in humans and laboratory animals (Pacini and Bergman 1986). In a typical frequently sam-pled intravenous glucose tolerance test (FSIGT), blood samples are taken from a fasting subject at regular intervals of time, following a single intravenous injection of glucose. The blood samples are then analyzed for glucose and insulin content. Figures1and2show a typical response of glucose and insulin concentrations from a healthy and type 2 diabetes human.
In Fig.1, the glucose level in plasma starts at a peak due to the injection, drops to a minimum which is below the basal (pre-injection) glucose level (70–110 mg/dl), and then gradually returns to the basal level. The insulin level in plasma rapidly rises to a peak immediately after the injection, drops to a lower level which is still above the basal insulin level, rises again to a lesser peak, and then gradually drops to the basal level (8–11lU/ml). Depend-ing on the state of the subject, there can be wide variations from this response, such as the glucose level may not drop
below basal level, the first peak in insulin level may have different amplitude, there may be no secondary peak in insulin level, or there may be more than two peaks in insulin level. The glucose and insulin minimal models provide a quantitative and parsimonious description of glucose and insulin concentrations in the blood samples following the glucose injection. The glucose minimal model involves two physiologic compartments: a plasma glucose compartment and an interstitial tissue compart-ment. The insulin minimal model involves only a single plasma insulin compartment. The glucose and insulin minimal models allow us to characterize the FSIGT data in terms of four metabolic indices (Pacini and Bergman1986; Riel2004):
1) SI=insulin sensitivity: a measure of the dependence of fractional glucose disappearance,
2) SG=glucose effectiveness: a measure of the frac-tional ability of glucose to lower its own concentration in plasma independent of increased insulin,
0 20 40 60 80 100 120 140 160 180 200 50
100 150 200 250 300 350
Healthy Human
Time (min)
Glucose (mg/dl)
0 20 40 60 80 100 120 140 160 180 200 0
20 40 60 80 100 120 140
Healthy Human
Time (min)
Insulin (microU/ml)
Fig. 1 FSIGT data from a healthy human (Pacini and Bergman1986)
3) /1=first phase pancreatic responsivity: a measure of the size of the first peak in plasma insulin due to the glucose injection, and,
4) /2=second phase pancreatic responsivity: a measure of the size of the second peak of plasma insulin which follows the first peak and the refractory period.
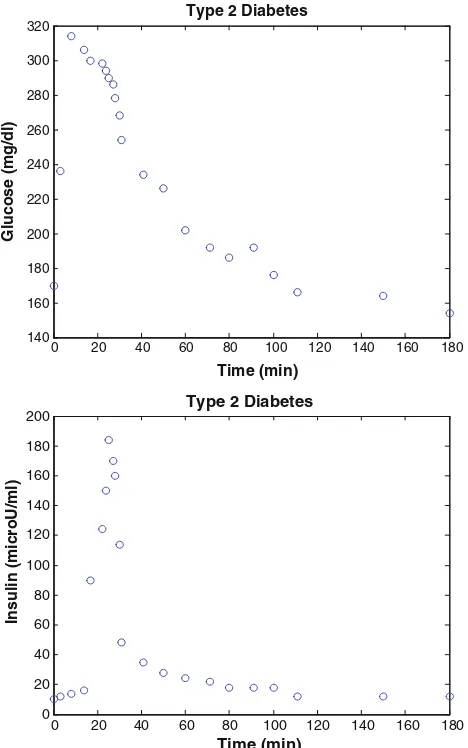
In Fig.2, the basal glucose level was 166±15 mg/dl and the basal insulin levels was 15±2 lU/ml for type 2
diabetes subject. Glucose and insulin data were obtained from the frequently sampled intravenous glucose tolerance test (FSIGT) (Katz et al.2000).
Glucose leaves or enters the plasma glucose compart-ment at a rate proportional to the difference between the basal glucose plasma level, Gb, and the plasma glucose level,G(t). If the plasma glucose level falls below the basal glucose level, then glucose enters the plasma glucose compartment, and if the glucose level rises above the basal glucose level, then glucose leaves the plasma glucose compartment. Glucose also disappears from the plasma
glucose compartment via a second pathway at a rate pro-portional to the ‘activity’ of insulin in the interstitial compartment tissue X(t).
Insulin leaves or enters the interstitial tissue compartment at a rate proportional to the difference between the plasma insulin level,I(t), and the basal plasma insulin level,Ib. If the plasma insulin level falls below the basal insulin level, then insulin leaves the interstitial tissue compartment,X(t), and if the plasma insulin level rises above the basal insulin level, the insulin enters the interstitial tissue compartment. Insulin also disappears from the interstitial tissue compartment via a second pathway at a rate proportional to the amount of insulin in the interstitial tissue compartment.I(t) is the model input and the course of plasma insulin in time is given by linear interpolation of the time-insulin values. The ordinary differential equations corresponding to the glucose minimal model are (Pacini and Bergman1986; Riel2004):
dG tð Þ plasma glucose concentration [mg/dl], I(t) is the plasma insulin level [lU/ml] and X(t) is the interstitial insulin activity. Looking at the structure of Eq. (1), it is clear thatX(t) does not represent a physiological, measurable quantity, but a variable with the unit [min-1], mimicking an effective insulin activity.Gbis the basal plasma glucose concentration [mg/dl] and Ib is the basal plasma insulin concentration [lU/ml]. Basal plasma concentrations of glucose and insulin are typically measured before administration of glucose (or sometimes 180–200 min after). There are four unknown parameters in this model: p1, p2, p3, and G0. The insulin sensitivity is defined as SI=p3/p2 and the glucose effectiveness is defined as SG=p1. Ordinary differential equations (1) and (2) can be reformulated as:
dG tð Þ
dt ¼SGðGbG tð ÞÞ X tð ÞG tð Þ; G tð Þ ¼0 G0; ð3Þ dX tð Þ
dt ¼p2ðSIðI tð Þ IbÞ X tð ÞÞ; X tð Þ ¼0 0; ð4Þ Instead of taking plasma glucose G(t) as output also plasma insulin, I(t) can be considered as key variable to develop a model that interprets the FSIGT data. Next, we modified the minimal model for insulin kinetics from. Insulin enters the plasma insulin compartment at a rate proportional to the product of time and the concentration of glucose above a basal plasma glucose concentrationGb. If the plasma glucose level drops below the basal plasma glucose concentration, then the rate of insulin entering the
0 20 40 60 80 100 120 140 160 180
plasma compartment is zero. Insulin is cleared from the plasma compartment at a rate proportional to the amount of insulin in the plasma compartment. The modified minimal model for insulin kinetics is given by the ordinary differential equations: wherek is the insulin clearance fraction, Gb is the basal glucose plasma level, andcis a measure of the secondary pancreatic response to glucose. The first phase pancreatic responsivity is defined as /1¼
ImaxIb
ð Þ
k Gð 0GbÞ min (lU/ml) (mg/dl)-1 where Imax is the maximum insulin response. The second phase pancreatic responsivity is defined as /2=c9104(lU/ml) (mg/dl)
-1 .
Derouich and Boutayeb (2002) introduced a model which simulates the effect of physical activity on the dynamics of glucose and insulin system. The model allows us to point out the different behaviors corresponding to healthy human, non-insulin-dependent diabetes (NIDD) and insulin-dependent diabetes (IDD) patients. Derouich and Boutayeb (2002) start underlining that physical effort: 1) Lowers the glucose concentration during and after the
exercise,
2) Increases the insulin use by sells.
Type 2 diabetes is a growing health epidemic that is caused by decreased insulin action in skeletal muscle, adipose tissue, and liver. Physical exercise dramatically enhances insulin-stimulated glucose uptake in individuals who are insulin resistant, an effect that lasts for 3–72 h post exercise. The mechanisms by which exercise enhances whole body insulin sensitivity are multi factorial and likely involve alterations in enzymes regulating non-oxidative glucose disposal, decreased muscle glycogen, and increased skeletal muscle blood flow.
Then, following Derouich and Boutayeb (2002) and the assumptions in above, we consider the following a modi-fied minimal model in physical exercise:
dG tð Þ
dt ¼ðp1þq1ÞðGbG tð ÞÞ ð1þq2ÞX tð ÞG tð Þ;
G tð Þ ¼0 G0; ð7Þ dX tð Þ
dt ¼ p2X tð Þ þðp3þq3ÞðI tð Þ IbÞ; X tð Þ ¼0 0; ð8Þ Parametersq1, q2 andq3increase with the increase of exercise intensity of the muscular exercise. The following
parameters are related to physical activity (Derouich and Boutayeb2002):
q1: The effect of the physical exercise in accelerating the utilization of glucose by muscles and in the liver,
q2: The effect of the physical exercise in increasing the muscular and liver sensibility to the action of the insulin, and,
q3: The effect of the physical exercise in increasing the utilization of the insulin
In the modified minimal model, the same assumptions of physical effort from Derouich and Boutayeb (2002), we present a mathematical model of the insulin kinetics for physical effort process as follows:
dI tð Þ
A mathematical function representing the insulin infusion process in insulin therapy in type 2 diabetes, we introduced into the modified minimal model using a model from Zheng and Zhao (2005). The proposed modified minimal model is as follows:
dI tð Þ stands for the exogenous insulin infusion rate and Vl [ml/kg] for the distribution volume.
The solutions of a system of simultaneous ordinary differential equations rather than a single equation, such system be represented in Eqs. (3)–(6) and Eqs. (7)–(12), are calculated using numerical methods. There are several common numerical methods to solve these problems. In this paper, we select the Runge–Kutta–Fehlberg numerical method. The main advantage of this method is that it can compute with high accuracy. However, a more powerful computer processor is still needed. This method is com-patible to be run with MATLAB R2012a software and computer with Intel Pentium B950 2.1 GHz processor and memory RAM of 6 GB.
The following are brief explanations of how to use the Runge–Kutta–Fehlberg method (Stanoyevitch 2005):
y0ð Þ ¼t f tð;y tð ÞÞ !ordinary differential equations;
from these form, the order-4 Runge–Kutta approximation is defined as: and the order-5 Runge–Kutta approximation is defined as:
ynþ1¼ynþ
Compute the local error estimation using:
E¼jynþ1znþ1j; ð15Þ
if E[he(step size is too large), then reduce h to h
2 and repeat above computation, and if E[he
4 (step size is too small), acceptyn?1but increasehto 2hfor next iteration, wheree is error tolerance. Otherwise (step size is good), acceptyn?1and continue iteration.
Results and discussion
The first step to be taken after developing a mathematical model is to check its accuracy which usually compared by either the experimental results or the analytical solutions. In order to be acceptable, any numerical solution needs to meet the condition of convergence. It is said to satisfy the condi-tion of convergence if it meets the condicondi-tion of consistency and stability. In this paper, the performance analysis of the modified minimal model will be presented by comparing it with the experimental results which obtained from the pre-vious study by Pacini and Bergman (1986) and Katz et al. (2000). Furthermore, several numerical experiments are carried out to observe the influences of each input parameter against the outcomes in physical exercises process.
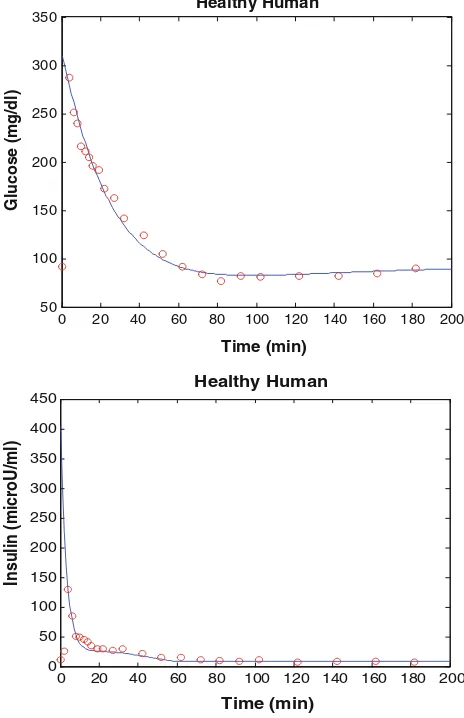
The simulation model of healthy human has been implemented in MATLAB and the estimated parameters are
k=0.257, c=0.3349910-2,Gb=92 mg dl
The first phase pancreas responsivity,/1, is estimated as 2.4 min (lU/ml)(mg/dl)-1and the second phase pancreas responsivity, /2, is estimated as 33.49 min
-2 (lU/ml)
(mg/dl)-1for this present results. This is slightly than the normal range for/1 and/2reported in Pacini and Berg-man (1986), but these results show that the subject exhib-ited normal insulin sensitivity and normal pancreatic responsivity. The approximate normal range pancreatic responsivity normal range SI 4.0–8.0910
-4lU-1
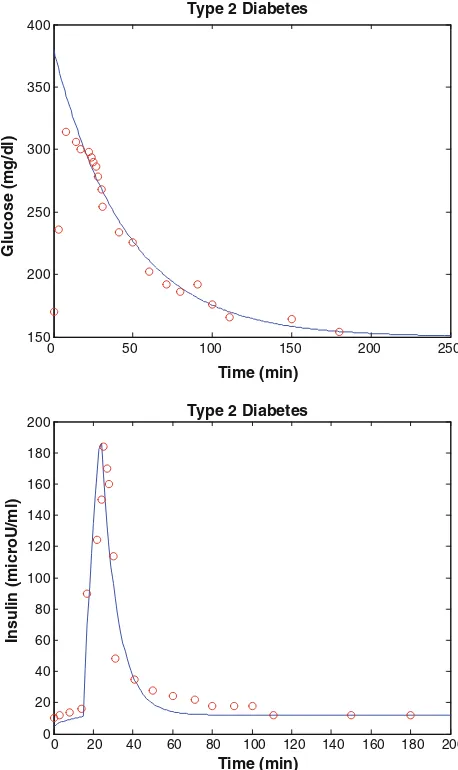
The simulation model of type 2 diabetes human has been implemented in MATLAB and the estimated param-eters are k=0.270, c=0.00033, Gb=160 mg dl
Fig. 3 Simulation results of healthy human. Theblue solid linesand
red circlerepresent results of the present model, and experiment data
We analyzed using the present model program, modified minimal model predictions of glucose disappearance fit well with the actual glucose disappearance data (Fig.4). The modified minimal model index of insulin sensitivity (SI) was 4.8910
-8
lU-1ml min-1for diabetic subject. We also analyzed the first phase pancreas responsivity (/1) and the second phase pancreas responsivity (/2). The present results were approximated as 0.75 and 3.3 min-2 (lU/ml)(mg/dl)-1sequentially. These results show that the subject exhibited normal insulin sensitivity and non-normal pancreatic responsivity. This is a well documented artifact of the present results for these diabetic subjects that occurs when data from subjects with poor insulin secretion.
Healthy human case with physical exercise
The simulation model of physical exercise in healthy human has been implemented in MATLAB and the
estimated parameters similar to the classical minimal model (Pacini and Bergman 1986) are k=0.257, c=0.3349910-2, Gb=92 mg dl
-1
, Ib=8 lU/ml,
p2=0.02093 min -1
, SI=5.07910 -4
lU-1ml min-1,
SG=0.031 min -1
, I0=403 lU/ml and G0=287 mg dl-1: results are shown in Fig.5.
In healthy human, the pancreaticb-cells, responsible for the production of insulin, are functioning normally. Insulin may be produced in sufficient quantity in response to the amount of carbohydrates intake or to other needs. On the other hand, there is an automatic shut off that avoids excess of insulin when the reserves of glucose are exhausted. Hence, the blood sugar concentration may slightly increase or decrease but it does not cross the thresholds leading to severe hypo- or hyperglycemia. We try to study the effect
0 50 100 150 200 250
150 200 250 300 350 400
Type 2 Diabetes
Time (min)
Glucose (mg/dl)
0 20 40 60 80 100 120 140 160 180 200 0
20 40 60 80 100 120 140 160 180
200 Type 2 Diabetes
Time (min)
Insulin (microU/ml)
Fig. 4 Simulation results of type 2 diabetes human. Theblue solid
lines and red circle represent results of the present model and
experiment data (Katz et al.2000) (colour figure online)
0 20 40 60 80 100 120 140 160 180 200 50
100 150 200 250 300
350 Healthy Human
Time (min)
Glucose (mg/dl)
0 20 40 60 80 100 120 140 160 180 200 0
20 40 60 80 100
120 Healthy Human
Time (min)
Insulin (microU/ml)
Fig. 5 Healthy human case with exercise; theblue circlerepresents healthy human without exercise; the black plusrepresents healthy human with normal exercise, q1=0.00001, q2=0.65,
q3=0.000009; and the red star represents healthy human with stronger exercise,q1=0.00003,q2=0.95,q3=0.00001 (q1,q2,q3 data from Derouich and Boutayeb (2002) (colour figure online)
of physical exercise and compare it to situations of rest or minimum effort. The effect of physical exercise on the dynamics of glucose and insulin is illustrated in Fig.5. A healthy human has hypoglycemia because the blood glu-cose level is below 60 mg/dl. Healthy human has suffered hypoglycemia, which can happen due to too much exercise and because of small amount of plasma glucose concen-tration. Hypoglycemia can result in losing of the con-science. Avoiding hypoglycemia is an important issue when we are using insulin as treatment. It is interesting to note the output of the model concerning extreme cases where exercise may be dangerous.
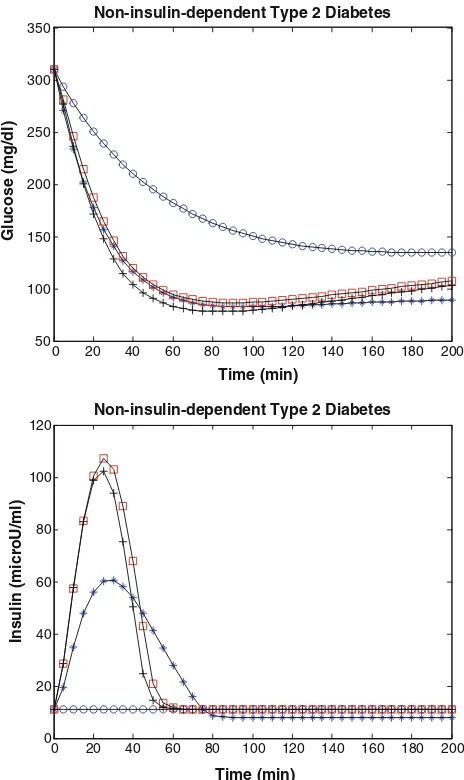
Non-insulin-dependent type 2 diabetes case with physical exercise
The simulation model of physical exercise in non-insulin-dependent type 2 diabetes has been implemented in MATLAB and the estimated parameters arek=0.270,c=0.55910-2,
: results are shown in Fig.6.
Figure6and Tables1and2show that while a non-insu-lin-dependent type 2 diabetes person may adapt to a basal blood sugar concentration over 140 mg dl-1at rest (SI= 0.62910-4lU-1ml min-1SG=2.0910
-2
min-1a per-son can achieve approximately a normal glycemia around 80–100 mg dl-1 with physical exercise (SI=5.079 10-4lU-1ml min-1, SG=3.08910
-2
min-1After physical exercise,SIapproximately was increased by 717 % (from 0.62 to 5.07 min-1910-4/(U/ml)), whereas SG remained unchanged or slightly changed (from 2.0 to 3.08910-2min-1similar to the results of Bordenave et al.
(2008). In general, the simulation results provided by our study (in Table2) is thatSI as measured by the modified minimal model is dramatically improved in non-insulin-dependent type 2 diabetes person and, in the short term, can even achieve the healthy human values at rest. In contrast, the physical exercise-induced increase in SG observed in healthy subjects was not seen in non-insulin-dependent type 2 diabetes person, suggesting little or no effect of short-term exercise on SG in non-insulin-dependent type 2 diabetes person. This finding is important for interpreting modified minimal model measures of SI and SG in non-insulin-dependent type 2 diabetes during physical exercise that are quantitatively important. Also, the magnitude of the short-term rise suggests that repeated physical exercise may be, on its own, powerful insulin-sensitizer independent of the additional and well-demonstrated long-term effects of reg-ular exercise training.
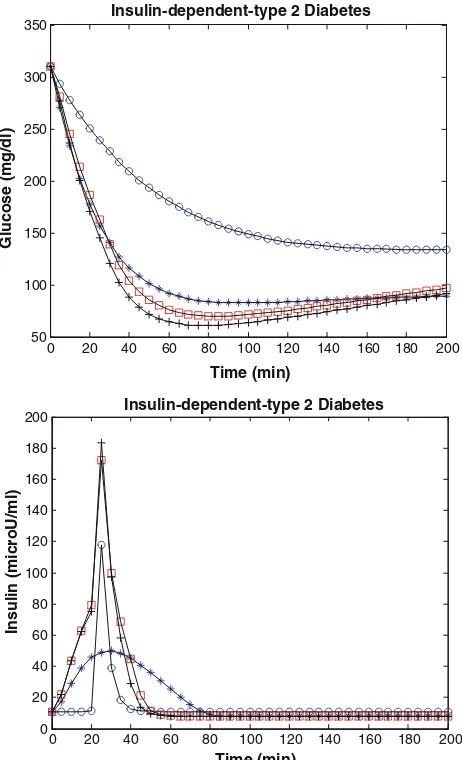
Insulin-dependent type 2 diabetes case with physical exercise
Therapeutic methods for management of hyperglycemia form the cornerstone of diabetes management, which have expanded considerably over the past two decades, and new drugs and combinations of drugs for control of glycemia have been developed. Insulin remains the most potent and best understood medication for lowering glucose concen-tration in patients with type 2 diabetes. Insulin therapy may be used for a short time, i.e., a few weeks to a few months, to manage significant hyperglycemia with glucose toxicity.
0 20 40 60 80 100 120 140 160 180 200
Fig. 6 Non-insulin-dependent type 2 diabetes case with exercise; the
blue starrepresents healthy human without exercise; theblue circle
represents non-insulin-dependent type 2 diabetes without exercise; the
black plus represents non-insulin-dependent type 2 diabetes with
normal exercise,q1=0.00001, q2=0.65, q3=0.000009; and the
red square represents non-insulin-dependent type 2 diabetes with
It is assumed that, despite the effects of glucose toxicity, there is some degree of basal and reactive insulin secretory capacity, which will improve as blood glucose concentra-tion decreases. In other circumstances, insulin therapy may be the only long-term therapy required. Moderate physical activity has significant cardiovascular benefits, and car-diovascular training is typically recommended for patients with diabetes (Kazlauskaite and Fogelfeld2003).
The simulation model of physical exercise in insulin-dependent type 2 diabetes has been implemented in MAT-LAB and the estimated parameters are k=0.270, c=
0.55910-2, Gb=140 mg dl -1
, Ib=15lU/ml, p2= 0.01 min-1, SI=0.62910
-4
lU-1ml min-1, SG= 2.0910-2min-1, I0=360lU/ml, and G0=310 mg dl-1. Glucose (0.5 g/kg body weight, 30 % solution) was slowly injected over 3 min, and 20 min later, insulin (0.01 U/kg body weight) was injected intravenously for 5 min: results are shown in Fig.7and Table3. In the other simulation model, 20 min later, insulin (0.04 U/kg body weight) was injected intravenously for 5 min: results are shown in Fig.8and Table4.
Figure7 shows that while a insulin-dependent type 2 diabetes person may adapt to a basal blood sugar concen-tration over 140 mg dl-1 at rest, a person can achieve approximately a normal glycemia around 80–100 mg dl-1 with physical exercise, but Fig.8 shows a insulin-depen-dent type 2 diabetes person may adapt to a basal blood sugar concentration over 140 mg dl-1at rest, a person can achieve approximately hypoglycemia (below 60 mg dl-1) with physical exercise. Regarding insulin-dependent type 2 diabetes, people may think that insulin is not needed when
physical exercise is practiced. If insulin is needed in physical exercise, then a dose-effort adaptation is needed. Patients receiving insulin who are involved in exercise programs should be aware of the potential for development of hypoglycemia. However, physical exercise-induced hypoglycemia does not develop in all patients with type 2 diabetes. The risk for hypoglycemia is proportional to duration and intensity of physical exercise. To avert hypoglycemia, the patient must consider consuming more carbohydrates or reduce the insulin dosage. Addition of carbohydrates (20–100 g/hr) is the easiest and fastest way to balance exercise. The best time to exercise is 90 min after a meal; thus, the patient can reduce the rapid-acting or intermediate-acting insulin dosage before the meal, typi-cally by 30 %. Patients with type 2 diabetes may have reduced muscle mass; therefore, starting an exercise pro-gram with muscle-building exercises might be advisable (Kazlauskaite and Fogelfeld2003).
Conclusion
Diabetes is a widespread disease in the world today. Many researchers are working on methods for diagnosing and treating diabetes. One of the tools used for diagnosing and treating diabetes is the mathematical models of the blood glucose and insulin kinetics. In this paper, modified mini-mal model is described trough derivation and simulations. Modifications and additions which could be done to describe the glucose and insulin kinetics more thoroughly are described.
Table 1 Parameter values used by the modified minimal model to measureSIandSGin healthy human during physical exercise
Gb Ib k c SI(rest) SG(rest) q1 q2 q3 Conditions (exercise)
92 8 0.257 0.3349910-2 5.07910-4 3.1910-2 0.000010 0.65 0.0000090 Hypoglycemia
92 8 0.257 0.3349910-2 5.07910-4 3.1910-2 0.000020 0.80 0.0000095 Hypoglycemia
92 8 0.257 0.3349910-2 5.07910-4 3.1910-2 0.000030 0.95 0.0000100 Hypoglycemia
92 8 0.257 0.3349910-2 5.07910-7 3.1910-2 0.000035 0.95 0.0000120 Hypoglycemia
92 8 0.257 0.3349910-2 5.07910-7 3.1910-2 0.000045 1.05 0.0000130 Hypoglycemia
92 8 0.257 0.3349910-2 5.07910-7 3.1910-2 0.000065 1.15 0.0000140 Hypoglycemia
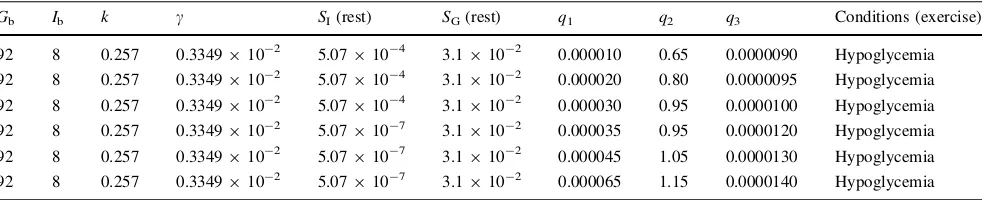
Table 2 Parameter values used by the modified minimal model to measureSIandSGin non-insulin-dependent type 2 diabetes during physical exercise
Gb Ib k c SI(rest) SG(rest) q1 q2 q3 SI(exercise) SG(exercise)
140 15 0.30 0.33910-2 0.62910-4 2.0910-2 0.000010 0.65 0.0000090 5.07910-4 3.08910-2
140 15 0.30 0.33910-2 0.62910-4 2.0910-2 0.000020 0.80 0.0000095 5.50910-4 3.10910-2
140 15 0.30 0.33910-2 0.62910-4 2.0910-2 0.000030 0.95 0.0000100 6.70910-4 3.12910-2
160 15 0.27 0.55910-2 0.48910-7 2.0910-2 0.000035 0.95 0.0000120 4.00910-4 3.10910-2
160 15 0.27 0.55910-2 0.48910-7 2.0910-2 0.000045 1.05 0.0000130 5.07910-4 3.12910-2
160 15 0.27 0.55910-2 0.48910-7 2.0910-2 0.000065 1.15 0.0000140 5.50910-4 3.15910-2
0 20 40 60 80 100 120 140 160 180 200 50
100 150 200 250 300 350
Insulin-dependent Type 2 Diabetes
Time (min)
Glucose (mg/dl)
0 20 40 60 80 100 120 140 160 180 200 0
20 40 60 80 100 120
Insulin-dependent-type 2 Diabetes
Time (min)
Insulin (microU/ml)
Fig. 7 Insulin-dependent type 2 diabetes case with exercise, theblue star represents healthy human without exercise; the blue circle represents non-insulin type 2 diabetes without exercise; theblack plus represents non-insulin type 2 diabetes with normal exercise, q1=0.00001,q2=0.65,q3=0.000009; and thered square repre-sents non-insulin type 2 diabetes with stronger exercise, q1=0.00003, q2=0.95, q3=0.00001 (q1, q2, q3 data from Derouich and Boutayeb (2002) (colour figure online)
Table 3 Parameter values used by the modified minimal model to measureSIandSGin insulin-dependent type 2 diabetes human during physical exercise
Gb Ib k c SI(rest) SG(rest) q1 q2 q3 Conditions (exercise)
140 15 0.30 0.33910-2 0.62910-4 2.0910-2 0.000010 0.65 0.0000090 Normal
140 15 0.30 0.33910-2 0.62910-4 2.0910-2 0.000020 0.80 0.0000095 Normal
140 15 0.30 0.33910-2 0.62910-4 2.0910-2 0.000030 0.95 0.0000100 Normal
160 15 0.27 0.55910-2 0.48910-7 2.0910-2 0.000035 0.95 0.0000120 Normal
160 15 0.27 0.55910-2 0.48910-7 2.0910-2 0.000045 1.05 0.0000130 Normal
160 15 0.27 0.55910-2 0.48910-7 2.0910-2 0.000065 1.15 0.0000140 Normal
Glucose (0.5 g/kg body weight, 30 % solution) was slowly injected over 3 min, and 20 min later, insulin (0.01 U/kg body weight) was injected intravenously for 5 min
0 20 40 60 80 100 120 140 160 180 200 50
100 150 200 250 300 350
Insulin-dependent-type 2 Diabetes
Time (min)
Glucose (mg/dl)
0 20 40 60 80 100 120 140 160 180 200 0
20 40 60 80 100 120 140 160 180
200 Insulin-dependent-type 2 Diabetes
Time (min)
Insulin (microU/ml)
In this paper, we present the new model of plasma insulin compartment in the Bergman’s minimal model. The modified minimal model with a new model of plasma insulin compartment was used to study the effect of physical exercise via parameters of a qualitative the mag-nitude of changes in insulin sensitivity (SI) and glucose effectiveness (SG) in response to exercise in healthy and type 2 diabetes human. Insulin sensitivity (SI) and glucose effectiveness (SG) are the two main factors controlling glucose tolerance. In using mathematical modeling of physical exercise, our purpose was to illustrate clearly the effect of exercise on dynamics of insulin sensitivity (SI) and glucose effectiveness (SG).
The results are important for interpreting modified minimal model measures ofSI and SG in type 2 diabetes and healthy human during short-term of physical exercise that SI as measured by the modified minimal model is dramatically improved in type 2 diabetes human. The magnitude of the short-term rise inSIsuggests that repe-ated physical exercise may be, on its own, a powerful insulin-sensitizer independent of the additional and well-demonstrated long-term effects of regular exercise training. In contrast, the physical exercise does not improve inSG simulation in type 2 diabetes human, suggesting little or no effect of short-term of physical exercise on SG in type 2 diabetes human.
The most important factor driving increased glucose disposal in skeletal muscle after a short-term of physical exercise is a remarkable increase in insulin sensitivity. Exercise training (i.e., many exercise sessions over days, weeks, or months) provides the benefit of repeated increases in insulin-dependent glucose disposal (during and for a short time after exercise) and repeated periods of insulin sensitivity after exercise. Physical exercise is indi-cated either to prevent or delay the onset of type 2 diabetes human or to assure a good control of type 2 diabetes human by increasing insulin sensitivity.
In developing countries, low income and poor health (service care), a large number of diabetics are struggling to
get just the necessary insulin dose. Our model advices and confirms the well-known that physical exercise is one of the natural and inexpensive treatment diabetes. In type 2 diabetes and healthy human, physical exercise improves insulin sensibility and lowers glucose concentration. This simulation confirms once more that everybody should incorporate some physical activity in daily life. This sim-ulation also is more indicated to people at diabetes risk.
Acknowledgments The author wishes to thank reviewers for their helpful comments and suggesting improvements to the original manuscript.
References
Bergman RN, Phillips LS, Cobelli C (1981) Physiologic evaluation of factors controlling glucose tolerance in man. J Clin Investiga 68:1456–1467
Bergman RN, Ader M, Huecking K, Citters Gv (2002) Accurate assessment of beta-cell function: the hyperbolic correction. Diabetes 51(Suppl 1):S212–S220
Bordenave S, Brandou F, Manetta J, Fe´dou C, Mercier J, Brun JF (2008) Effects of acute exercise on insulin sensitivity, glucose effectiveness and disposition index in type 2 diabetic patients. Diabete Metab 34:250–257
Cox JH, Cortright EN, Dohm GL, Houmard JA (1999) Effect of aging on response to exercise training in humans: skeletal muscle GLUT-4 and insulin sensitivity. J Appl Physiol 86:2019–2025 Dela F, Mikines KJ, Linstow Mv, Secher NH, Galbo H (1992) Effect
of training on insulin mediated glucose uptake in human skeletal muscle. Am J Physiol Endocrinol Metab 263:E1134–E1143 Dela F, Handberg A, Mikines KJ, Vinten J, Galbo H (1993) GLUT-4
and insulin receptor binding and kinase activity in trained human muscle. J Physiol 469:615–624
Dela F, Ploug T, Handberg A, Petersen LN, Larsen JJ, Mikines KJ, Galbo H (1994) Physical training increases muscle GLUT-4 protein and mRNA in patients with NIDDM. Diabetes 43: 862–865
Dela F, Mikines KJ, Larsen JJ, Ploug T, Petersen LN, Galbo H (1995) Insulin stimulated muscle glucose clearance in patients with type 2 diabetes mellitus. Effects of one-legged physical training. Diabetes 44:1010–1020
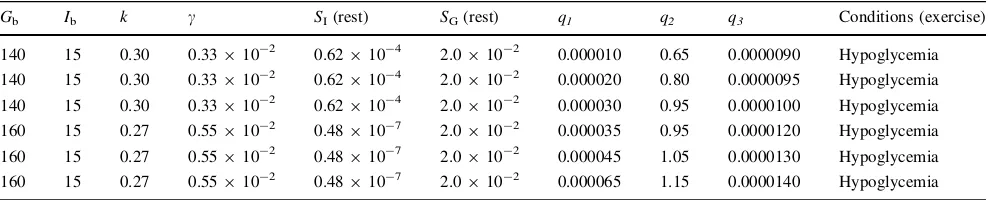
Derouich M, Boutayeb A (2002) The effect of physical exercise on the dynamics of glucose and insulin. J Biomech 35:911–917 Table 4 Parameter values used by the modified minimal model to measureSIandSGin insulin-dependent type 2 diabetes human during physical exercise
Gb Ib k c SI(rest) SG(rest) q1 q2 q3 Conditions (exercise)
140 15 0.30 0.33910-2 0.62910-4 2.0910-2 0.000010 0.65 0.0000090 Hypoglycemia
140 15 0.30 0.33910-2 0.62910-4 2.0910-2 0.000020 0.80 0.0000095 Hypoglycemia
140 15 0.30 0.33910-2 0.62910-4 2.0910-2 0.000030 0.95 0.0000100 Hypoglycemia
160 15 0.27 0.55910-2 0.48910-7 2.0910-2 0.000035 0.95 0.0000120 Hypoglycemia
160 15 0.27 0.55910-2 0.48910-7 2.0910-2 0.000045 1.05 0.0000130 Hypoglycemia
160 15 0.27 0.55910-2 0.48910-7 2.0910-2 0.000065 1.15 0.0000140 Hypoglycemia
Glucose (0.5 g/kg body weight, 30 % solution) was slowly injected over 3 min, and 20 min later, insulin (0.04 U/kg body weight) was injected intravenously for 5 min
Houmard JA, Cox JH, MacLean PS, Barakat HA (2000) Effect of short-term exercise training on leptin and insulin action. Metabolism 49:858–861
Kahn SE, Larson VG, Beard JC, Cain KC, Fellingham GW, Schwartz RS, Veith RC, Stratton JR, Cerqueira MD, Abrass IB (1990) Effect of exercise on insulin action, glucose tolerance, and insulin secretion in aging. Am J Physiol Endocrinol Metab 258:E937–E943
Kahn SE, Prigeon KL, McCulloch DK, Boyko EJ, Bergman RN, Schwartz MW, Neifing JL, Ward WK, Beard JC, Palmer JP et al (1993) Quantification of the relationship between insulin sensi-tivity and beta-cell function in human subjects. Evidence for a hyperbolic function. Diabetes 42:1663–1672
Katz A, Nambi SS, Mather K, Baron AD, Follmann DA, Sullivan G, Quon MJ (2000) Quantitative insulin sensitivity check index: a simple, accurate method for assessing insulin sensitivity in humans. J Clin Endocrinol Metab 85(7):2402–2410
Kazlauskaite R, Fogelfeld L (2003) Insulin therapy in type 2 diabetes. Dis Mon 49(6):377–420
Kirwan JP, Kohrt WM, Wojta DM, Bourey RE, Holloszy JO (1993) Endurance exercise training reduces glucose-stimulated insulin levels in 60- to 70-year-old men and women. J Gerontol Ser A 48:M84–M90
Pacini G, Bergman RN (1986) MINMOD: a computer program to calculate insulin sensitivity and pancreatic responsivity from the frequently sampled intravenous glucose tolerance test. Comput Methods Progr Biomed 23:113–122
Poehlman ET, Dvorak RV, De Nino WF, Brochu M, Ades PA (2000) Effects of resistance training and endurance training on insulin sensitivity in non-obese, young women: a controlled randomized trial. J Clin Endocrinol Metab 85:2463–2468
Riel Nv (2004) Minimal models for glucose and insulin kinetics: a MATLAB implementation. Department of biomedical engineer-ing and Department of electrical engineerengineer-ing, Eindhoven Uni-versity of technology
Rodnick KJ, Haskell WL, Swislocki AL, Foley JE, Reaven GM (1987) Improved insulin action in muscle, liver, and adipose tissue in physically trained human subjects. J Clin Endocrinol Metab 253:E489–E495
Short KR, Vittone JL, Bigelow ML, Proctor DN, Rizza RA, Coenen-Schimke JM, Nair KS (2003) Impact of aerobic exercise training on age-related changes in insulin sensitivity and muscle oxida-tive capacity. Diabetes 52:1888–1896
Stallknecht B, Andersen PH, Vinten J, Bendtsen LL, Sibbersen J, Pedersen O, Galbo H (1993) Effect of physical training on glucose transporter protein and mRNA levels in rat adipocytes. J Clin Endocrinol Metab 265:E128–E134
Stallknecht B, Larsen JJ, Mikines KJ, Simonsen L, Bu¨low J, Galbo H (2000) Effect of training on insulin sensitivity of glucose uptake and lipolysis in human adipose tissue. J Clin Endocrinol Metab 279:E376–E385
Stanoyevitch A (2005) Introduction to numerical ordinary and partial differential equations using MATLAB, Wiley-Interscience Turcotte LP, Fisher JS (2008) Skeletal muscle insulin resistance: roles