IMTC 2006-Instrumentation and Measurement Technology Conference
Warsaw,Poland, 1-3 May 2007
Allan Variance Analysis of Measurement Data Series for Instrument Verification
M.
Bertoccol, A.
Monetti2,
E.Mottin1,
C.
Narduzzi1,
E.Sienil
'Departmentof Information Engineering, University of Padova, viaGradenigo 6/b-35131Padova, Italy
Phone: +39 0498277500, Fax: +39 049 8277699, e-mail:matteo.bertocco, claudio.narduzzi, elisabetta.sieni@unipd.it
2InfineonTechnologies Italia Srl, Development Center Padova, via N. Tommaseo,65/b-35131Padova, Italy.
Abstract- The paper is concernedwith the analysis of measurand
and instrumentstability during the calibration verification process,
with a view on ensuring that comparison is carried out under suitable
assumptions. It will be shown howanalysis of the Allan variance
allowsstability characterization ofthe measurement circuit and yields
information about measurement noise, so that a correct procedure for the verification of the calibration status can be defined. This is
of particularsignificance in the context of an industrial laboratory,
where oneof the main purposes of the analysis would be to identify
improvements to the measurement system, that could allow toperform
calibrationverification within the limits of available equipment.
Keywords-Allanvariance, measurement noise, calibration labora-tory
I. INTRODUCTION
Quality control of production processes requires the peri-odic calibration of instrumentation used intestsand in process measurements[1], [2]. Using an instrument in a non-valid cal-ibration status invalidates measurements and wouldprobably require that they be repeated at the laboratory own cost.
Generally, instrument calibration is performed at suitably competentlaboratories, however thisoperationis rather expen-sive. Tomake the bestuseofresources whilereducing the risk ofanon-valid calibration status, alaboratory may perform in-ternal calibration verification in the time interval between two
calibrations, using procedures and instruments in accordance with the indications givenin [3]. In an industrial laboratory
environment themetrological support for this kind ofactivity
isgenerally far less comprehensive than in a dedicated calibra-tionlaboratory. This suggests the usefulness ofinvestigating
some aspects of the verification process more closely, in the hope of contributing some useful criteria to assure its correct-ness.
Verification of the calibration status ofan instrument can
beperformed by comparingmeasurementresults obtained for the same measurand using, respectively, a calibrated
instru-mentactingas aworking standard and theoneunder-test. The
comparison criterion can be seen as a mathematical rule trans-forming measurement results into an indexthat,by comparison with athreshold, allows a decision about the compatibility of measurements. Most common criteria are based on statistical indicators [4], [5], [6], that rely on hypotheses made about the statistics of the data sets, such as theircorrelation, probability distribution anduncertainty.
In common practice, data are supposed to be random, un-correlated and, possibly, having a Gaussian probability dis-tribution. Under these assumptions it can be considered that accuracy in the estimation of the mean value and variance of measurements improves as the number of values, N, in the data set getslarger. However, if N is large, deviations from the assumed conditions may occur, as a result of noise and trends superposed on the measured values. These effects limit the accuracy in the estimation ofa quantity, since variance may actually tend to diverge as the data set size N increases. Con-sequently, a moredetailedanalysis of the statistical properties of themeasurementdata series withregardstotimestability is required.
The paper is mainly concerned with the analysis of mea-surand and instrumentstability during the verification process, with aview onensuring thatcomparison is carriedoutunder suitableassumptions. Itshould beemphasizedthat the
investi-gation intomeasurement fluctuations needsto accountfor the wholemeasurementsystem [11],because contributionscanbe duetothe measurandaswellas toinstruments.
Twodifferent buttypical cases will be discussed: first,
com-parison of adigital multimeter with a calibrated one having
better resolutionby anorder ofmagnitude(61 versus 71
dig-its) will be considered. Then, comparison between multimeters having similar performances (6 digits) will be analyzed: the ra-tionale here isthat,withinapopulationof several similar multi-meters, one is maintained as aworking standard and kept under strictermetrologicalcontrol. Inthe former case, the aim is to
about measurement noise, so thata correct procedure for the verification of the calibration status can be defined. This is ofparticular significance in thecontext ofan industrial
labo-ratory,where oneof the mainpurposes of the analysis would
betoidentify improvements tothemeasurement system, that could allowtoperform calibration verification within the limits of availableequipment.
II. ALLAN VARIANCE ANALYSIS
Measurement variability can be due to the variability of
the measurand itself, to variations in some influence
quan-tity (e.g. environmental temperature) and, possibly, to noise and drift within themeasuring instrument itself. Forinstance,
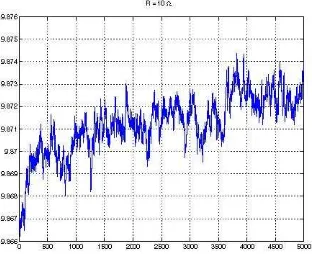
Fig.1 shows a sequence of 5000 resistance measurements for
astandard commercial resistor with anominal value of 10Q,
obtained by adigital multimeter (Agilent 34401A).
Measure-ments weretaken in a room with no temperature control. It
is difficulttodetermine a meanvalue thatcanbeagood
rep-resentation of themeasurand, as trends and local fluctuations
are rather clearly present inthe time series of data. In other words, thesemeasurementsshould be dealtwith, more
appro-priately, as a time series, whose relevant features need tobe analyzed. Ofcourse,theassumption ofaGaussian distribution wouldcertainlynothold in thiscasefor the whole dataset.
Fluctuationsarecommonly described byapower-law
spec-traldensity model [14]:
S(f) =
Eh,f
ae
(2)
whereaisaninteger and it is assumed that -2 <a <+2. Al-though the model originates from theanalysis of noisesources
in high stability frequency standards, it is in fact fairly
gen-eral and has been extended to other kinds of standards (e.g., [10]). Thetermin(2)forwhicha=0, representswhite noise.
If its contribution dominates the model, a standard statistical approachmay beapplicable. On the otherhand, if thepower
spectral density of the observedquantity isnotwhite and
val-ues arecorrelated,useof standard methodstoestimate TypeA
uncertainty from acquireddata, referredtoin [7], ishardly jus-tifiable [8], [9], [10]. Forthispurposethe Allan variance and
thepowerspectraldensity of the the series should be analyzed
[12],[13], [14].
The empirical plot ofor (T) canbe compared with the Al-lan variance model underlying (2), which is described by the following expression [12]:
72(T) =
J
kltT.
/1
The coefficients kft are constants and u is relatedto aby: (3)
{ -a 1 for: a<I
j =
-2 for:
a>1
1.OE+O
a)
C)
CZ 1.OE-1
1.OE-2
Fig.1. Set of5000measurementresults for a 10 Q resistor(Agilent 34401A).
The Allan variance is commonly used in metrologyto
de-fine the stability ofa reference. Given a time series of data
indicatedby y(kT), where T is theconstantinterval between
consecutivemeasurements,Allan variance is calculatedby the
expression:
koZ0+N-1
kzo+2N-1
-2
2(T)=
I2N
[E
xS(
)
x(kT)
(1)k=ko k=ko+N
with T = NT and N apositive integer. Analysis ofan
em-pirical Allan variance plotcan, inmoregeneralterms,provide
useful information about thestabilityofanykind of
measure-mentsystemunderanalysis. Thus, itmay proveauseful tool
[image:2.595.96.252.436.563.2]intheanalysis of the calibration verificationprocess.
Fig. 2. Time-variance plot for the Allan variance model (3) with:
k-I =0.015,ko=0.04,k+1 =0.002.
Different values of,u indicate different noise components:
,u =-1 refers to white noise, ,u = 0 refers to a 1/f noise
component, ,u =+1 to arandom walk noise component and
=+2toadeviation of themeanvalue, [10], [13]. Their
rel-ativeweights, that depend on theconstants kft, determine the
shape of the Allan variance plot.
Using plots of Allan variance versus averaging time, the
structureof the noisecontributioncanbe evidenced anda
max-imum time intervalinwhich noisecanbe considered white
in-dicated, asdiscussedin[9]. Ideally, aU-shaped plotwould
re-sult: this is shownintheexampleofFig. 2,whereaminimum
is obtained foran averaging time between 1 and 10 s. Inthis
(4)
10 100
[image:2.595.351.551.441.587.2] [image:2.595.65.298.664.701.2]case further averaging would in no way improve the results.
Inthe following, someexamples of the proposed useof Allan varianceplots in the analysis of themeasurementprocedure in normal laboratory practiceareshown.
III. PRACTICAL EXAMPLES
A. Verification based on TUR criteria
This subsection considers calibration verification of a
61
2digit multimeter (Keithley 2000) by comparison with the indi-cations of a 71 digit multimeter (Keithley 2001). Following
recommended practice [3], the value TUR= 4 is taken as a
reference.
Presented results refertothe DC voltage function: a
volt-age sourceisappliedtothe referencevoltmeter andmeasured,
then thesame sourceis measuredby the multimeter undertest
and readings compared. Results presented here refer to the
1 V range of the instrument under test, whose resolution is
1 ,uV; for the reference instrument the correspondingrangeis
2 V and the resolution 100 nV. It should be noticed that the specified uncertainty of the K2000 multimeter in the 1 V range
is ±37,uV atfull scale; therefore the specification TUR= 4
yields arequirement fora verificationuncertainty notgreater
than±9,uV.
The reference multimeter is assumedtobefully
calibrated,
thereforeonly TypeAuncertainty will be accounted for. How-ever this should make allowance for the measurement sys-temstability, considering also the dead time between
measure-mentstaken with thetwomultimeters. Calibration verification
therefore requires the availability ofa suitably stable voltage
source. This may be a critical point, in view of the
resolu-tionspecificationsof the instruments. Allan variance analysis
canthenhelpassesswhether calibration verification is feasible with themeasurementsystem athand.
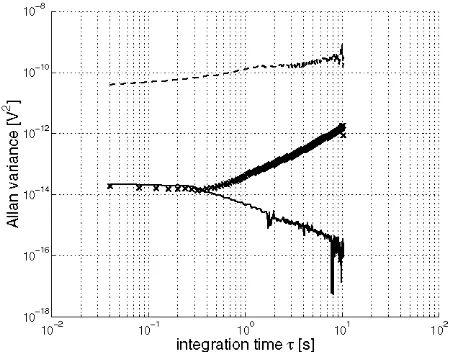
Figure 3 shows the Allan variance plots formeasurementsin
the2 V range of the reference instrument. Allplots werebuilt
by acquiringa setof 8192values; averaging involved at most
256 consecutivereadings, sothat each value is determinedby
averaging atleast 32 estimates. The curverepresented bythe dashed line referstothemeasurementof theoutputvoltageofa
commercialadjustable laboratorypowersupply. Itisusefulto
compareit with that obtainedby acquiringmeasurementswith
ashortedinput, represented bythe continuous line. The former
accountsfor instabilities and noise of the whole measurement
system,while the latter referstothe instrument alone.
Comparison between thetwoplots canprovide an assess-mentof the relativeimportance of the instrument contribution
[15]. Inthiscasethemeasurementsystem as awhole is char-acterized by a considerably larger Allanvariance, about four orders ofmagnitude higher. This canbe attributed tovoltage
fluctuations of thepowersupplyoutput, while the continuous linetraceshows that intrinsicstabilityof themeasuring
instru-mentis much better.
Using the laboratory powersupplyas areference does not
allowto reach the specified uncertaintytarget. Therefore, we
analyzed the feasibility of using a low-pass filterto stabilize
the power supply output. The first-order filter employed for
thispurpose hadatime constant of 560s, resulting ina very
long settling time: it takes anestimated21 hours for the filter
output to settletowithin 0.1 ppmof the final value.
Introduc-tion of such unsophisticated, butvery narrow-band low pass
filter achievesasurprising improvement: thecurvemarked by 'x' refersto measurementsof the filteredpowersupplyoutput
andpractically coincides with the continuous line. Thismeans
that,overtime intervalsup to200ms,the Allan deviation is of the order of 100nV,well below thetargetuncertainty.
108
10 10
1 0
10 16
C)-10 2 1o-1 100
[image:3.595.325.550.283.459.2]integration timeX[s] 101 102
Fig. 3. Allan variance plots for measurement of unfiltered voltage (dashed line), filtered voltage('x')and shorted input (continuous line), 2 V range
(Keithley 2001).
However, even after such a long time, only a relatively
short-termstability canbe ensured for thegenerated voltage. Theupward slope in the rightpartof theplot is duetothe slow voltage variations relatedtothelow-pass filter. These limit the long-term stability of themeasurement,puttinganupperbound ofafew secondsonthe time availabletoperformcomparisons
with the instrument undertest.
B. Dataanalysis forstatistical tests
Results shown here are based on resistance measurement
dataacquired usinganAgilent34401Amultimeter. Inthiscase
Allan varianceanalysis is mainly usedtostudy noise contribu-tions and theirsources, as apreliminarystep totheapplication
of statisticaltestsforcompatibilityofmeasurements. A setof
commoncommercial resistors mountedon asupportprovided
with bananaplugshave beenemployedina roomwithout
tem-perature control. Connections are provided by equal length
cables. The autozerofunction of the instrument has been dis-abled in ordertoobtain the maximumsamplingrate,resulting
inasampling interval of 200ms. Foreach series of
measure-ments5000samples have been taken; acquisitionsareabout 16
Ii:
.... 60 0#0. ::I
minutes
long
andareperformed automatically using
aPCandaLabVIEW program.
xlO0 Dati
1.0118
1.0116-
1.0114-
1.0112-,1.011 U51.0108 1.0106
1.0104
1.0102
1.01
0
100 200 300 400 500 600 700 800 900 1000
time(s) (a) time series. 10.
10
..1 0.
101
101 10o 101
time[s]
(b) Allan varianceplot.
10'
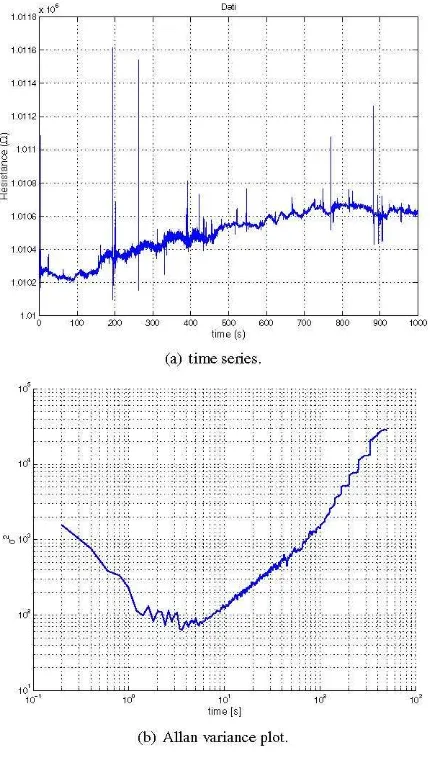
Fig.4. Measurement results fora1MQresistor(Agilent 34401A).
Measured values for a 1 MQ resistor are shown in
Fig. 4(a),
with thecorresponding
Allan variancebeing plotted
in
Fig. 4(b).
The initialslope
u 1 is followedby
aflattractevidencing, respectively,
white and flicker noise contributions.'The curve
slope
next shows arandom walk noise contribution(,u=
+1)
and,finally,
the effect of atrend in the measured values becomes dominant(,u=
+2).
An
important
aspect of theanalysis
is that thelength
of the time windowduring
which theassumption
of a white noise model isacceptable
canbe determinedby evaluating
theposi-tion of the first knee in the Allan variancecurve,
starting
from theslope
of -1. Forinstance, theplot
inFig. 4(b)
showsthat,foran
acquisition
time shorter than2smeasurementvariability
canbe described as a white noise contribution
superposed
onthe measured values.
In this case the
probability
distribution of measuredval-ues
might reasonably
be assumed to be Gaussian, thereforeinstrument
comparison by
statisticaltests canrely
onwelles-tablished
techniques.
The window sizecorresponds
tojust
20samples,
buttaking
morevalues cannotimprove
measurementaccuracy [10]. On the other hand, this limitation also
influ-encesthe confidence level that anystatisticaltest onthe
com-patibility
ofmeasurements canhave.Foran
acquisition
window between2and 5sthe Allanvari-anceremains constant, howeveraGaussian distributioncan no
longer
be assumed. If theacquisition
islonger
than 5 sdrift ef-fects areevidenced. Therefore, with themeasurement systemconsidered in this case the
comparison
ofmeasurements ob-tained fromtwodifferent instrumentscanbeperformed only
ifacquisition
time is shorter than 5 s,thatmeans acomparatively
small dataset. Itshould also be remembered that initial
mea-surementconditionsmustbe restored before the secondset of
measurement
acquisitions
starts. Care has to be taken toen-surethat conditions
(e.g.,
resistorheating)
in twosubsequent
acquisitions
canbe assumedtoremainreasonably
constant.Fig.
5 shows acomparison
between the Allan varianceplots
evaluated for two series ofmeasurement values, obtained
re-spectively
with a 10 Q resistor and a short circuit connectedto the same instrument
input.
It can be noticed that the flattracts
(,u= 0)
associated with flicker noise coincide in thetwocurves. This means that
Type
A measurementuncertainty
is boundedby
the instrument contribution andcorresponds
toanAllan variance of2x 10 ' Q2. The final partof the
plot
forthe 10 Q resistor shows alinear trend with
slope
,u= +2 thathighlights
adrift in measuredvalues, as seeninFig.
1. Thecurves inFig.
5 also showapeculiar
behavior for smallvalues ofT, where a
slope
,u= +1 is evidenced. This isasso-ciated with band limited white noise and is aconsequence of the instrument bandwidth limitation [14]. Itshould be noticed that the effect is also
dependent
onthesampling frequency
em-ployed
toacquire
measurement data. Itprogressively
disap-pears ifmeasurements aretaken witha
longer sampling
inter-val,which has the effect of
decorrelating
consecutivesamples.
10-'
10 lo short
10-6
107_
1081
101 10o 101
time[s] 102
Fig.5. Comparisonof Allan variances for resistancemeasurementbya
6-digitmultimeter(Agilent 34401A).
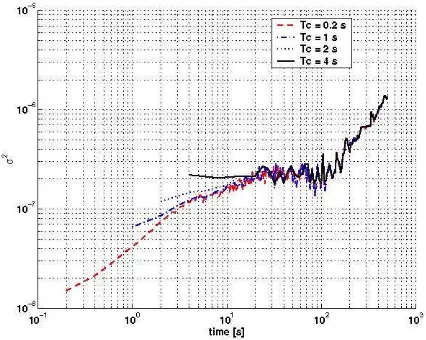
[image:4.595.68.283.157.537.2] [image:4.595.334.544.570.740.2]This is practically demonstrated in Fig. 6, that shows the Allan variance plots of the 10 Q resistor, calculated byvarying the sampling time between 0.2 s and4 s. It can be seenthat, by increasing the sampling time, the initial slope of the curve is reduced, while the level of flicker noise is not modified.
0.
[image:5.595.68.281.193.363.2]-.-:..-.-:-.-:.
... ... 0.2
Tc =1s
Tc = 2 s
::. Tc=4s
10v
-10-7_
108-10-1 10 10
time[s] 102 103
Fig. 6. Evaluation of Allan variance for a 10 Qresistor,with different
samplingtimes.
[6] EA-2-03,(EAL-P7),EALInterlaboratory Comparisons,1996. [7] ENV 13005, Guide to the expression of uncertainty in measurement,
1999.
[8] T.J. Witt, "Low-frequency spectral analysisof DCnanovoltmeters and voltage referencestandards," IEEETrans. on Instrument.nand Meas., vol.46, pp.318-321,1997.
[9] P.Helist6and H. Seppa, "Measurementuncertainty in the presence of low-frequency noise," IEEE Trans. on Instrument.n and Meas., vol. 50, pp.453-456,2001.
[10] T.J. Wittand D. Reymann, "Using power spectra and Allan variance to characterise the noise of Zener-diodevoltagestandards,"IEEEProc-Sci Meas. Technol., vol. 147, pp. 177-182, 2000.
[11] J. Valdes, M. E. Porfiri, E. E. Lobbe, F. Kornblit, M. N. Passarino de Marques, and J. A.Leiblich, "Longtermfluctuations associated with differentstandards," IEEETrans. onInstrument.n and Meas., vol. 42,
pp.269-272, 1993.
[12] D. W.Allan, "Should the classical variance be used as a basic measure instandardsmetrology?," IEEE Trans. on Instrument.n and Meas., vol. 147, pp.646-654,1987.
[13] T.J. Witt, "Using the Allan variance and powerspectral densityto char-acterize DCnanovoltmeters," IEEETrans. on Instrument.nandMeas.,
vol.50,pp.445-448,2001.
[14] J. Rutman andF.L.Walls, "Characterization offrequency stabilityin precisionfrequency sources," Proc.s of the IEEE, vol.79,pp.952-960,
1991.
[15] T.J.Witt, "Allan variances andspectral densities for DCvoltage mea-surements withpolarity reversals," IEEE Trans. onInstrument.n and Meas.,vol.54,pp.550-553, 2005.
[16] AgilentTechnologies, Agilent 34401A,Service'sGuide, 1996.
IV. CONCLUSIONS
Allan variance results have been used toanalyze the mea-surementsystems usedtoverifythe calibrationstatusofdigital
multimeters. Inparticular, resistance measurementdata series have been analyzed to decide about the maximum number of
samplesthatcanbeacquiredtoobtain uncorrelated realizations of the measurand. Ithas been shown that the effects ofchanges
inthe measurement system set-upcanbe studiedby the
analy-sis of Allan varianceplots,evidencingdifferent contributions. Theproposed approach can be usedbytestlaboratoriesas a
help in the design of the proceduresemployedtoverifythe cal-ibration status of their instrumentation. Inparticularthe
analy-siscanbe usedtodetermine better waystoreduce noise effects
or measurement trends and assess whether noise is primarily
duetothe instrumentorifthe measurand noise contribution is important.
REFERENCES
[1] [2] [3]
[4] [5]
ISO9001,Qualitymanagement systems.Requirements,2000.
ISO/IEC 17025, General requirementsforthe competenceof testingand calibrationlaboratories,1999.
UNI ENISO10012, Measurement management systems.Requirements formeasurementprocesses andmeasuring equipment,2004,
(Interan-tional reference: ISO 10012:2003).
G.Zingales, "Compatibilityinindustrialmeasurements,"Proc.ofIMTC,
pp.377-380,1999.
E.Arri,F.Cabiati,S.D'Emilio,and L.Gonella, "On theapplicationof theexpressionofuncertaintyinmeasurement tomeasuringinstruments,"