MIIC EMA 12th Unive rsity o f Be ng kulu 1255 | P a g e
EARNINGS MANAGEMENT PRACTICES IN COMPANIES
LISTED IN JAKARTA ISLAMIC INDEX-INDONESIAN
STOCKS EXCHANGE
Wiyadi and Nanang Prasnowo
Economics Faculty and Magister Management Program Muhammadiyah University of Surakarta
Jl. A. Yani Tromol Pos 1 Pabelan Surakarta, Central Java, Indonesia
ABSTRACT
Earnings management existed because it was impacted from accrual basis. In practice, managers choose policies to maximize their utility and market value of the firm (Scott, 2006). Agency theory provides a view that earnings management issues can be minimized through monitoring mechanisms to align interest differences between owners and management and others, Based on agency theory, it was reduced by control itself from Corporate Governance (CG) mechanism. The purpose of this study is to analyze the earnings management practices in companies which listed in Jakarta Islamic Index. The sample is 153 companies which listed in Jakarta Islamic Index from 2004-2010 periods. The results indicate the earnings management (DACC) in Jakarta Islamic index are 0.0962 (2004), 0.11104 (2005), 0.03673 (2006), 0.20509 (2007), 0.087056 (2008), 0.045405 (2009) and 0.100421 in 2010. The results of this analysis also shows that during the period 2004 - 2010 companies listed in the Jakarta Islamic index in Indonesian stocks exchange follow the pattern of earnings management to maximize its profit (increasing their profit). The average value of accruals (DACC) is 0.098318. This finding supports research conducted by DeFond and Jiambalvo (1994), Sweeney (1994); Peltier-Rivest (1999); Jaggi and Lee (2001), Rosner (2003); Djakman (2003), Sham (2004); Andriyani ( 2004); and Kusumawati and Sasongko (2005), who provide empirical evidence regarding the pattern of earnings management in the form of increasing for earnings reported. Earnings management perspective used in this study is opportunistic perspective. For further research, earnings management needs to be reviewed from the positive perspective.
MIIC EMA 12th Unive rsity o f Be ng kulu 1256 | P a g e INTRODUCTION
According to Scott (1997) earnings management are measures to reported earnings that managers can maximize their personal or company using the method of accounting policies. The practice of earnings management is done by selecting the accrual method of accounting or policy. This method controls the accrual transactions, that profits would seem high, but the transaction does not affect cash flow. The practice of earnings management is the impact of the use of accrual basis in the preparation of financial statements, so the phenomenon is difficult to avoid. According to Roshan (2001), the accrual transactions consist of transactions non-discretionary accruals and discretionary accruals.
The managers practice earnings management to maximize the utility and market value of the firm (Scott, 1997). They have the flexibility to choose some alternative transaction record, as well as choose the options that exist in the accounting treatment. This flexibility is used by the management company to manage earnings. So, the behavior management of the underlying occur of earnings management is opportunistic behavior and efficient contracting manager. Opportunistic behavior of managers known as earnings management. Manipulation is done, so profit appears as expected and investors remain interested in the company. Meanwhile, as the efficient contracting is intended to increase earnings in communicating private information.
The practice of earnings management can be viewed from two different perspectives, namely as a wrong action (negative) and management actions that should be (positive). By some circles, the practice of earnings management is considered as a professional judgments on the financial statements. Healy and Wahlen (1998) consider earnings management as an act of misleading and deceiving shareholders. This is due to management have asymmetric information about the condition of the company.
Widarto (2004) states that earnings management is considered unethical, even a form of manipulation of information so misleading. When the company doing the practice of earnings management, earnings picture is no longer able to fairly represent the performance of the company, which will reduce the reliability of profit itself. As such information becomes less relevant earnings (Whelan and McNamara, 2004) and Kusuma, (2005), because management had deliberately act of manipulation or other acts that could affect the financial statements. If the management does not manipulate the financial statements, the earnings quality has a positive value. It means that the data reported trustworthy and reliable. Without the intervention of earnings management, financial statements truly reflect the actual condition of the company and will assist stakeholders in predicting economic performance of companies in the future.
Another view assumes that earnings management is an effort to positive action. The research by Tucker and Zarowin (2006) showed that changes in stock prices run on the company with a higher income smoothing contains more information about future earnings rather than changes in stock prices of companies with lower income smoothing.
MIIC EMA 12th Unive rsity o f Be ng kulu 1257 | P a g e
could affect the financial statements. So, investor would look 'stupid' if you trust those statements.
Associated with Shariah index had been launched in the Indonesian capital market, it is very interesting to study on the practice of earnings management on this index. Because until now, earnings management is a controversial area. The practice of earnings management can be viewed from two different perspectives, namely as a wrong action (negative) and actions that should be (positive).
There are not much researches have been found associated with the practice of earnings management on Shariah index. So it needs serious attention for the stakeholders of Shariah bank, either owners or shareholders, commissioners, directors, employees, and the Shari'ah supervisory board, customers, or other Shariah scholars economy.
The main purpose of this study is to identify earnings management practices that occur in publicly traded companies incorporated in the Jakarta Islamic Index (Shariah Index) using the modified Jones model. Further specifically identify earnings management practices that do tend to raise or lower the rate of profit. One of the advantages modified Jones (aggregate accruals) approach is an approach that can potentially uncover ways to raise or lower profits, because it means less attention is to be known by outsiders (Gumanti 2000). This research was conducted for the period 2004 - 2010, due to formally launch the capital market with the principles of Islamic Shariah on March 14, 2003.
LITERATURE REVIEW
1. Agency Theory
The emergence of earnings management can be explained by agency theory. Agency theory states that the agency relationship arises when one or more principals employ another person as agent to provide a service and then delegate the decision-making authority to the agents (Ujiyantho and Scout, 2007). According Mursalim (2005), agency theory can be viewed as a version of game theory to create a contractual model between two or more persons (parties), one party called the agent and the other called the principal. Principal delegate responsibility for decision making to the agent. Principal means to give a mandate to the agent to perform certain tasks in accordance with the agreed contract. The powers and responsibilities of agents and principals set forth in the employment contract upon mutual consent.
The relationship between principal and agent can lead to an imbalance condition of information (asymmetrical information), because the agent is in a position that has more information about the company than the principal. In conditions asymmetry, the agent may affect the accounting figures presented in financial statements by way of earnings management. As for the owners of capital or investors, they will be difficult to control effectively the actions taken by managers. As manager of the company, managers have an obligation to maximize the welfare of the owners and their welfare. Pooling the interests of these parties often lead agency conflict.
MIIC EMA 12th Unive rsity o f Be ng kulu 1258 | P a g e
According to Eisenhardt (1989), agency theory of human nature using three assumptions: (1) generally, human makes a human selfishness (self interest), (2) humans have a limited power of thought regarding the perception of the future (bounded rationality) and (3) human always avoid risk (risk averse). Based on the assumption of human nature, so the managers will act opportunistic, such as give priority to personal interests. From the information imbalance will lead to the emergence of a condition asymmetrical information that can provide the opportunity for managers to make earnings management.
2. Stewardship Theory
Stewardship theory also gives an overview, where the managers are not motivated by individual goals, but rather, to their main objectives for the benefit of the organization. This theory has a basic psychology and sociology that have been designed, where executives are motivated to act as steward of the principal as you wish. On the other hand steward's behavior will not leave the organization, because the steward tried to achieve organizational goals.
The researches of stewardship theory is more focused on a structure that allows managers at higher levels (Donalson and Davis, 1989, 1991, 1994; Fox and Hamilton, 1994). Donalson and Davis (1991) argue that CEOs who act as the steward would have pro-organizational attitudes as structures of authority and management company providing high flexibility. The structures reveal a dysfunctional model of man from the agency theory. But the model of man on the Stewardship Theory will maximize the utility steward to achieve organizational goals as compared to goals for their selves.
3. Earnings Management
Schipper (1989) defines earnings management as "disclosure management in the sense of a purposeful intervention in the external financial reporting process, with the intent of obtaining some private gain". According to Healy and Wahlen (1999) earnings management occurs when managers use judgments in financial reporting and the preparation of transactions to alter financial statements are misleading to the shareholders on the basis of economic performance of the organization or to influence the outcome in accordance with the contract depends on the accounting figures reported.
From the second definition above, the earnings management is an accounting policy choice by the manager of accounting standards that exist naturally and to maximize utility or value of the enterprise market. Earnings management can also be viewed as managers attempt to obtain certain personal gain. As stated by Wolk et al. (2001), that earnings management is an intervention in the external financial reporting process with the intent to gain personal advantage.
According to Scott (1997), the motivation of earnings management companies are: (1) Bonus Plan (Bonus scheme), (2) Contract Long Term Debt (debt covenants), (3) Motivation Politics (Political motivation), ( 4) Motivation Taxation (Taxation motivation), (5) Change of CEO, and (6) Prime Stocks Offer (Initial Public Offering). Various forms of earnings management by managers, such as: (1) Taking a bath, (2) Income minimization, (3) Income maximization, (4) Income smoothing.
MIIC EMA 12th Unive rsity o f Be ng kulu 1259 | P a g e
According to Healy and Wahlen (1999), the definition of earnings management contains several aspects. First, intervention income management over financial reporting can be done with the use of judgment, for example judgment needed in estimating the number of economic events in the future to shown in the financial statements, such as the estimated economic life and residual value of fixed assets, the responsibility for pensions, deferred taxes, losses receivables and a decrease in asset values. In addition, the manager has the option of accounting methods, such as the depreciation method and cost method. Second, the purpose of earnings management to mislead stakeholders about the economic performance of companies. This occurs when management has access to information not accessible by outsiders.
In Indonesia, studies on the performance of companies in the Jakarta Islamic Index have been conducted by several researchers previously. Their results showed that the stocks in the companies group of JII is better than companies group in LQ 45. Cahyaningsih, Suwardi and Setiawan (2008) showed that the performance of conventional mutual funds is worse than the performance of Islamic mutual funds and the performance of Islamic mutual fund portfolio managers are better than the performance of conventional mutual fund portfolio managers.
Another study by Hanafi (2006), through the cost of capital approach to stock JII compared with a group of stocks LQ 45. His results showed that the cost of capital stock JII is lower than the LQ 45. Cost of Capital shows the existence of some assumptions of a lower level of risk, lack of information asymmetry and agency costs are lower in firms JII, so investors are not too demanding rates of return.
RESEARCH METHOD
This research designed explanatory study and analyze the practice of earnings management performed publicly traded company listed on the Jakarta Islamic Index. This study analysis during 7 years to see the management practices by managers and the study use panel data or data pooled.
The population was the companies which listed Jakarta Islamic Index. The sampling method conducted purposive sampling, with criteria: (1) The company issued financial statements as of December 31 during 2004 -2010 completely, (2) the published financial statements have a positive equity balance in dollars as the reporting currency, (3) and they entered in Jakarta Islamic index (JII) category, published by the Indonesia Stock Exchange. The data was collected using the annual report or financial statements issued by the companies which published by the Capital Market Reference Center (PRPM) and financial reports from the Indonesian Capital Market Directory (ICMD) and from the web site each companies. The data used the financial statements during 2004 to 2010.
The variable is earnings management (DACC), which is defined as the manager's actions to increase or decrease reported earnings of a business entity, without resulting in an increase or decrease in long-term economic profitability. To detect the presence of earnings management practices and to see how to manipulate earnings management behavior (whether it tends to increase or decrease the rate of profit) with DACC and calculated using the Modified Jones Model. The steps in calculating discretionary accruals as follows:
MIIC EMA 12th Unive rsity o f Be ng kulu 1260 | P a g e
TACCit/TAi,t-1 = α1 (1/TAi,t-1) + α2 ((∆REVit - ∆RECit)/TAi,t-1) + α 3 (PPEi t/TAi,t-1).
From the regression equation above, NDACC (non discretionary) can be calculated by re-enter the coefficients alpha (α) is as follows:
NDACCit = α1(1/TAi,t-1)+ α2((∆REVi t - ∆RECit)/TAi,t-1) + α3 (PPEit/TAi,t-1) TACCit : Total accruals company i in t period
EXBTit : Earnings Before Extraordinary Item company i in t period
OCFit : Operating Cash Flows company i in t period
NDACC it : Non discretionary accruals company in t period
TAi,t-1 : Total assets company i in t-1 period
∆REVit : Revenue exchange company i in t period ∆RECit : Receivable exchange company i in t period
PPEit : Fixed assets (gross) company i in t period
Then, the discretionary accruals value can be calculated by these formula: DACCit = ( TACCit/TAi,t-1 ) - NDACCit
DACCit : Discretionary accruals company i in t period
TACCit : Total accruals company i in t period
TAi,t-1 : Total assets company i in t-1 period
NDACCit : Non discretionary accruals company i in t period
Furthermore, the value NDACC further analyzed to determine the practice of earnings management in companies incorporated in the JII during the period 2004 to 2010.
RESULTS AND DISCUSSION
The data acquired from financial statements audited and registered companies at the Jakarta Islamic Index-Indonesian Stock Exchange (IDX) during the period 2004 to 2010. The Shariah share is one form of ordinary shares which have a special characteristic form and strict control in terms of `halal` scope of business activities. Jakarta Islamic Index is an index issued by PT. Jakarta Stock Exchange which is a subset of the Composite Stock Price Index. The amount of sample determined can be seen in the following table.
Table 1 Number of sample
The number of companies listed on the JII during the period 2004 - 2010 The number of companies which data are incomplete
The number of companies that can be analyzed
163 (10) 153
Source : www.idx.co.id
MIIC EMA 12th Unive rsity o f Be ng kulu 1261 | P a g e
Table 2 Research Sample Number Per Year
Company Samples in Shariah index (JII) The number of companies listed on the JII 2004 The number of companies listed on the JII 2005 The number of companies listed on the JII 2006 The number of companies listed on the JII 2007 The number of companies listed on the JII 2008 The number of companies listed on the JII 2009 The number of companies listed on the JII 2010 Total sample
To analysis the practice of earnings management by the companies in JII index, it used descriptive statistical analysis. This analysis is intended to illustrate the description of earnings management practices undertaken by all listed companies in Jakarta Islamic Index for the period 2004 to 2010.
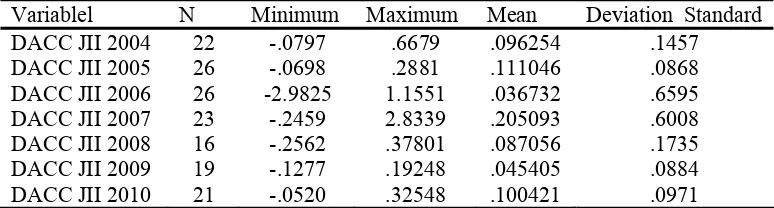
Table 3 The practice of earnings management during the years 2004 – 2010
Variablel N Minimum Maximum Mean Deviation Standard
DACC JII 2004 Sources: Secondary data are processed
The table above showed almost the companies are incorporated in the Jakarta Islamic Index tend to raise the profit rate by an average DACC during these period is 0.098318. The value of DACC is positive. It means the earnings management practice has the positive pattern by raising the profit rate. During the period 2004 – 2010, the highest level of earnings management practices occurred in 2007 (DACC = 0.205093), and the lowest level of earnings management practices occurred in 2006 (DACC = 0.036732). Furthermore, to know the practice of earnings management from year to year can be explained as follows.
1.
Earnings management practice in 2004MIIC EMA 12th Unive rsity o f Be ng kulu 1262 | P a g e
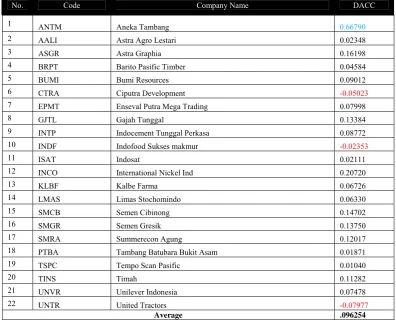
Table 4 The DACC value in 2004
No. Code Company Name DACC
1 ANTM Aneka Tambang 0.66790
2 AALI Astra Agro Lestari 0.02348
3 ASGR Astra Graphia 0.16198
4 BRPT Barito Pasific Timber 0.04584
5 BUMI Bumi Resources 0.09012
6 CTRA Ciputra Development -0.05023
7 EPMT Enseval Putra Mega Trading 0.07998
8 GJTL Gajah Tunggal 0.13384
9 INTP Indocement Tunggal Perkasa 0.08772
10 INDF Indofood Sukses makmur -0.02353
11 ISAT Indosat 0.02111
12 INCO International Nickel Ind 0.20720
13 KLBF Kalbe Farma 0.06726
14 LMAS Limas Stochomindo 0.06330
15 SMCB Semen Cibinong 0.14702
16 SMGR Semen Gresik 0.13750
17 SMRA Summerecon Agung 0.12017
18 PTBA Tambang Batubara Bukit Asam 0.01871
19 TSPC Tempo Scan Pasific 0.01040
20 TINS Timah 0.11282
21 UNVR Unilever Indonesia 0.07478
22 UNTR United Tractors -0.07977
Average .096254 Sources: Secondary data are processed
From 22 companies as sample in this study, 19 companies have patterns tend to raise profit because their DACC have positive value. While three r companies do the practice earnings management with the patterns tends to lower profits. They are Ciputra Development (DACC = -0.05023), Indofood Sukses Makmur (DACC = -0.02353), and United Tractor (DACC = -0.07977).
DACC calculation results show the average value of discretionary accruals from 22 companies is 0.096254. It means the practice of earnings management performed by most publicly traded companies listed in the shariah index during 2004 period tend to increase the earnings. The company that has the lowest value of discretionary accruals is the United Tractor (DACC = -0.079770) and the highest value of discretionary accruals is PT Aneka Tambang (DACC = 0.66790).
2.
Earnings management practice in 2005MIIC EMA 12th Unive rsity o f Be ng kulu 1263 | P a g e
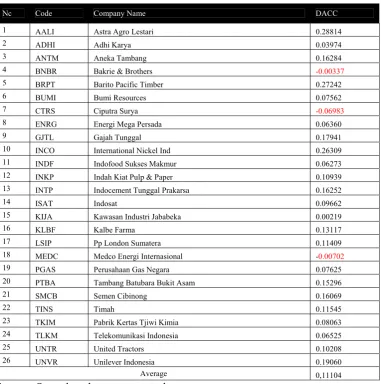
Table 5 The DACC value in 2005
Nc Code Company Name DACC
1 AALI Astra Agro Lestari 0.28814
2 ADHI Adhi Karya 0.03974
3 ANTM Aneka Tambang 0.16284
4 BNBR Bakrie & Brothers -0.00337
5 BRPT Barito Pacific Timber 0.27242
6 BUMI Bumi Resources 0.07562
7 CTRS Ciputra Surya -0.06983
8 ENRG Energi Mega Persada 0.06360
9 GJTL Gajah Tunggal 0.17941
10 INCO International Nickel Ind 0.26309
11 INDF Indofood Sukses Makmur 0.06273
12 INKP Indah Kiat Pulp & Paper 0.10939
13 INTP Indocement Tunggal Prakarsa 0.16252
14 ISAT Indosat 0.09662
15 KIJA Kawasan Industri Jababeka 0.00219
16 KLBF Kalbe Farma 0.13117
17 LSIP Pp London Sumatera 0.11409
18 MEDC Medco Energi Internasional -0.00702
19 PGAS Perusahaan Gas Negara 0.07625
20 PTBA Tambang Batubara Bukit Asam 0.15296
21 SMCB Semen Cibinong 0.16069
22 TINS Timah 0.11545
23 TKIM Pabrik Kertas Tjiwi Kimia 0.08063
24 TLKM Telekomunikasi Indonesia 0.06525
25 UNTR United Tractors 0.10208
26 UNVR Unilever Indonesia 0.19060
Average 0,11104
Sources: Secondary data are processed
The results of the calculation of DACC in 2005 stated that the average discretionary accruals for companies listed in the Jakarta Islamic index is 0.11104. It has a positive number that means most companies do earnings management practices and tend to raise the earnings pattern. From the 26 companies, there are three companies that have negative DACC value, so they tend to reduce the profit rate. They are the Bakrie & Brothers (DACC = -0.00337), Ciputra Surya (DACC = -0.06983), and Medco Energi Internasional (DACC = -0.00702) . Bakrie & Brothers is a company that has the lowest DACC. While companies that have the highest value of DACC is Astra Agro Lestari (DACC = 0.28814).
3.
Earnings Management practice in 2006MIIC EMA 12th Unive rsity o f Be ng kulu 1264 | P a g e
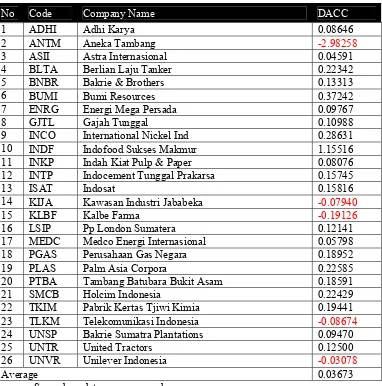
Table 6 The DACC value in 2006
No Code Company Name DACC
1 ADHI Adhi Karya 0.08646
2 ANTM Aneka Tambang -2.98258
3 ASII Astra Internasional 0.04591
4 BLTA Berlian Laju Tanker 0.22342
5 BNBR Bakrie & Brothers 0.13313
6 BUMI Bumi Resources 0.37242
7 ENRG Energi Mega Persada 0.09767
8 GJTL Gajah Tunggal 0.10988
9 INCO International Nickel Ind 0.28631
10 INDF Indofood Sukses Makmur 1.15516
11 INKP Indah Kiat Pulp & Paper 0.08076
12 INTP Indocement Tunggal Prakarsa 0.15745
13 ISAT Indosat 0.15816
14 KIJA Kawasan Industri Jababeka -0.07940
15 KLBF Kalbe Farma -0.19126
16 LSIP Pp London Sumatera 0.12141
17 MEDC Medco Energi Internasional 0.05798
18 PGAS Perusahaan Gas Negara 0.18952
19 PLAS Palm Asia Corpora 0.22585
20 PTBA Tambang Batubara Bukit Asam 0.18591
21 SMCB Holcim Indonesia 0.22429
22 TKIM Pabrik Kertas Tjiwi Kimia 0.19441
23 TLKM Telekomunikasi Indonesia -0.08674
24 UNSP Bakrie Sumatra Plantations 0.09470
25 UNTR United Tractors 0.12500
26 UNVR Unilever Indonesia -0.03078
Average 0.03673
Sources: Secondary data are processed
DACC calculation showed that the average discretionary accruals for companies listed in the Jakarta Islamic index is 0.03673. The value of DACC is positive, so the practice of earnings management tend to raise the profit. Company that has the smallest discretionary accruals value is PT. Aneka Tambang, that is -2.98258. While company that has the greatest value of discretionary accruals is PT. Indofood Sukses Makmur, that is 1.1551. There are five companies which have negative pattern of DACC. It means, they tend to decrease their profit rate. These companies are Unilever Indonesia, Telekomunikasi Indonesia, Kalbe farma, Kawasan Industri Jababeka and Aneka tambang
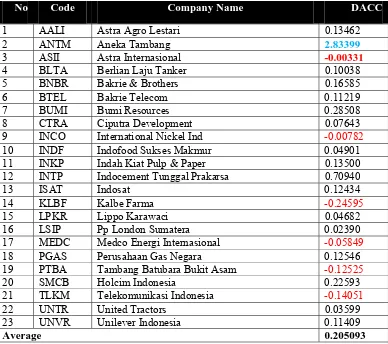
4. Earnings Management Practice in 2007
MIIC EMA 12th Unive rsity o f Be ng kulu 1265 | P a g e
Table 7 The DACC value in 2007
No Code Company Name DACC
1 AALI Astra Agro Lestari 0.13462
2 ANTM Aneka Tambang 2.83399
3 ASII Astra Internasional -0.00331
4 BLTA Berlian Laju Tanker 0.10038
5 BNBR Bakrie & Brothers 0.16585
6 BTEL Bakrie Telecom 0.11219
7 BUMI Bumi Resources 0.28508
8 CTRA Ciputra Development 0.07643
9 INCO International Nickel Ind -0.00782
10 INDF Indofood Sukses Makmur 0.04901
11 INKP Indah Kiat Pulp & Paper 0.13500
12 INTP Indocement Tunggal Prakarsa 0.70940
13 ISAT Indosat 0.12434
14 KLBF Kalbe Farma -0.24595
15 LPKR Lippo Karawaci 0.04682
16 LSIP Pp London Sumatera 0.02390
17 MEDC Medco Energi Internasional -0.05849
18 PGAS Perusahaan Gas Negara 0.12546
19 PTBA Tambang Batubara Bukit Asam -0.12525
20 SMCB Holcim Indonesia 0.22593
21 TLKM Telekomunikasi Indonesia -0.14051
22 UNTR United Tractors 0.03599
23 UNVR Unilever Indonesia 0.11409
Average 0.205093
Sources: Secondary data are processed
The earnings management practice tends to increase the profit rate, that is equal to 0.205093. Some companies that have a negative DACC, They are Astra International (DACC = -0.00331), International Nickel Ind (DACC = -0.00782), Kalbe Farma (DACC = -0.24595), Medco Energy International (DACC = -0.05849) Coal Mine Bukit Asam (DACC = -0.12525) and Telekomunikasi Indonesia (DACC = -0.14051). Their practice of earnings management tends to reduce profit rate. The table 7 showed that company that has the lowest value of discretionary accruals is PT. Astra International (DACC = -0.00331) and PT. Aneka Tambang has the highest value of discretionary accruals (DACC = 2.83399)
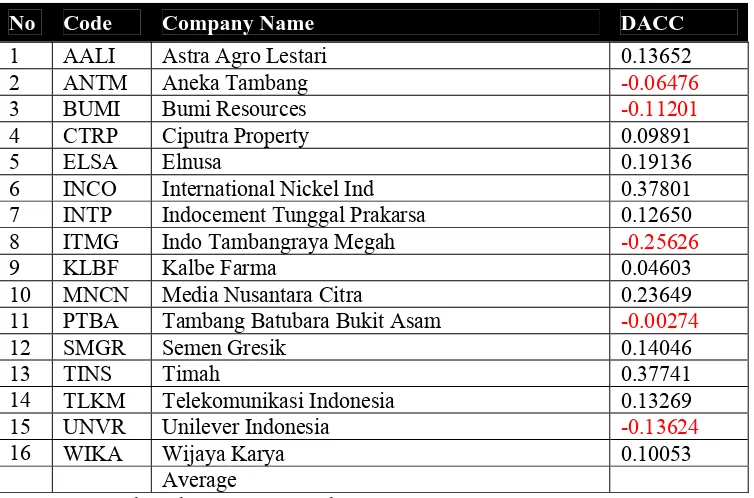
4.
Earnings Management practice in 2008MIIC EMA 12th Unive rsity o f Be ng kulu 1266 | P a g e
Tambangraya (DACC = -0.25626), Bukit Asam Coal Mine (DACC = -0.00274), and Unilever Indonesia (DACC = -0.13624). It can be seen in table following
Table 8 The DACC value in 2008
No Code Company Name DACC
1 AALI Astra Agro Lestari 0.13652
2 ANTM Aneka Tambang -0.06476
3 BUMI Bumi Resources -0.11201
4 CTRP Ciputra Property 0.09891
5 ELSA Elnusa 0.19136
6 INCO International Nickel Ind 0.37801
7 INTP Indocement Tunggal Prakarsa 0.12650
8 ITMG Indo Tambangraya Megah -0.25626
9 KLBF Kalbe Farma 0.04603
10 MNCN Media Nusantara Citra 0.23649
11 PTBA Tambang Batubara Bukit Asam -0.00274
12 SMGR Semen Gresik 0.14046
13 TINS Timah 0.37741
14 TLKM Telekomunikasi Indonesia 0.13269
15 UNVR Unilever Indonesia -0.13624
16 WIKA Wijaya Karya 0.10053
Average Sources: Secondary data are processed
The table above showed that PT. Indo Tambangraya has the lowest value of discretionary accruals (DACC = -0.25626), and PT. International Nickel Ind has the highest value of discretionary accruals (DACC = 0.378010).
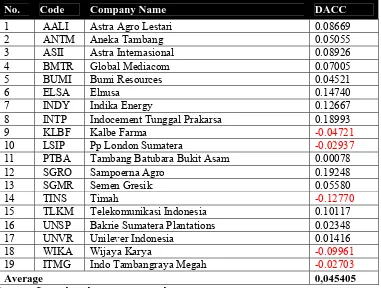
6. Earnings Management Practice in 2009
MIIC EMA 12th Unive rsity o f Be ng kulu 1267 | P a g e
Table 9 The DACC value in 2009
No. Code Company Name DACC
1 AALI Astra Agro Lestari 0.08669
2 ANTM Aneka Tambang 0.05055
3 ASII Astra Internasional 0.08926
4 BMTR Global Mediacom 0.07005
5 BUMI Bumi Resources 0.04521
6 ELSA Elnusa 0.14740
7 INDY Indika Energy 0.12667
8 INTP Indocement Tunggal Prakarsa 0.18993
9 KLBF Kalbe Farma -0.04721
10 LSIP Pp London Sumatera -0.02937
11 PTBA Tambang Batubara Bukit Asam 0.00078
12 SGRO Sampoerna Agro 0.19248
13 SGMR Semen Gresik 0.05580
14 TINS Timah -0.12770
15 TLKM Telekomunikasi Indonesia 0.10117
16 UNSP Bakrie Sumatera Plantations 0.02348
17 UNVR Unilever Indonesia 0.01416
18 WIKA Wijaya Karya -0.09961
19 ITMG Indo Tambangraya Megah -0.02703
Average 0,045405
Sources: Secondary data are processed
In 2009, the majority of firms conduct earnings management practices by increasing earnings patterns (average DACC = 0.045405). But there are also some companies that make the practice of earnings management with the pattern of reduce profits, namely: Kalbe Farma (DACC = -0.04721), PP London Sumatra (DACC = -0.02937), PT. Tin (DACC = -0.12770). Wijaya Karya (DACC = -0.09961), and Indo Tambangraya (DACC =- 0.02703). PT. Sampoerna Agro has the highest value of DACC, that is equal to 0.192480 and PT. Indonesia Timah has the lowest value of DACC, that is equal to -0.12770.
7. Earnings Management Practice in 2010
MIIC EMA 12th Unive rsity o f Be ng kulu 1268 | P a g e
Table 10 The DACC value in 2010
No. Code Company Name DACC
1 AALI Astra Agro Lestari -0.05200
2 ANTM Aneka Tambang 0.04350
3 ASII Astra Internasional 0.16648
4 BMTR Global Mediacom 0.16275
5 ELSA Elnusa 0.09731
6 INCO International Nickel Ind 0.11428
7 INTP Indocement Tunggal Prakarsa 0.32548
8 KLBF Kalbe Farma 0.06199
9 LSIP Pp London Sumatera 0.01157
10 PTBA Tambang Batubara Bukit Asam 0.00488
11 SGRO Sampoerna Agro 0.03393
12 SGMR Semen Gresik 0.23291
13 TINS Timah 0.08864
14 TLKM Telekomunikasi Indonesia 0.14246
15 UNSP Bakrie Sumatera Plantations 0.25460
16 UNVR Unilever Indonesia 0.07507
17 ITMG Indo Tambangraya Megah 0.05449
18 BSDE Bumi Serpong Damai -0.03358
19 CTRA Ciputra Development 0.00962
20 LPKR Lippo Karawaci 0.12780
21 UNTR United Tractors 0.18667
Average 0.100421
Sources: Secondary data are processed
In general, these results support the research conducted by De Fond and Jiambalvo (1994); Sweeney (1994); Peltier-Rivest (1999); Jaggi and Lee (2001); Rosner (2003); Djakman (2003); Sham (2004 ); Andriyani (2004); and Kusumawati and Saso (2005). Empirically, most companies tend to engage in earnings management practices with the pattern of increasing profit, although some companies tend to decrease their profits. The results of this study also supports research by Cahyaningsih, Suwardi and Setiawan (2008) that compares the performance of Islamic mutual funds with performance of conventional mutual fund portfolio managers, and Hanafi (2006) that compares the cost of capital stock with the cost of capital JII stock LQ 45.
CONCLUSIONS
MIIC EMA 12th Unive rsity o f Be ng kulu 1269 | P a g e
always doing earnings management practice during the 2004 - 2010 are PT Aneka Tambang, PT. Indocement Tunggal Perkasa, PT. Kalbe Farma, PT. Bukit Asam Coal Mine, PT. Unilever Indonesia and PT. Telekomunikasi Indonesia.
Earnings management perspective in this study used opportunistic perspective and the model used to calculate the discretionary accrual (DACC) is a modified Jones model. For further research, needs to use another perspective as efficiency perspective, and to analyze the earnings management practices with another models, such as: cross-sectional abnormal accrual model (Peasnell et al., 1998), or absolute discretionary accrual models (Rajgofal et al. ,1999), and test the best model that suitable with the conditions of capital markets in Indonesia.
MIIC EMA 12th Unive rsity o f Be ng kulu 1270 | P a g e REFFERENCES:
Djakman, Chaerul D. 2003. Manajemen Laba dan Pengaruh Kebijakan Multi Papan Bursa Efek Jakarta. Makalah disampaikan dalam Simposium Nasional Akuntansi VI di Surabaya, 16-17 Oktober.
Dechow, P.M., R.G. Sloan, and A.P. Sweeney. 1995. Detecting Earnings Management. The Accounting Review 70, p. 193-225.
Donaldson, L. and Davis, J.H. 1991. Stewardship theory or agency theory: ceo governance and shareholder returns. Australian Journal of Management, 16(1): 49-64. Eisenhardt, Kathleem. M. 1989. Agency Theory: An Assesment and Review. Academy of Management Review, 14, p. 57-74
Gumanti, Tatang Ary. 2000. Earning Management: Suatu Telaah Pustaka. Jurnal Akuntansi dan Keuangan Vol. 2, No. 2, Nopember 2000: 104 – 115. Universitas Kristen Petra.
Gumanti, T.A. 2000. Earnings Management Dalam Penawaran Saham Perdana di Bursa Efek Jakarta. Makalah Simposium Nasional Akuntansi III. 124-148.
Hanafi, Syafiq. M. 2007. Ethical Screening Pada Jakarta Islamic Index (JII): Antara Strategi Bisnis Dan Bisnis Strategi?
Hanafi, Syafiq. M. 2006. Corporate Governance: Kajian Empiris Cost of Capital Jakarta Islamic Index (JII) sebagai Ethical Investment. As-Syir’ah, Vol. 40 No. 1 Tahun 2006
Healy, Paul M. and J.M. Wahlen. 1999. A Review Of The Earnings Management Literature And Its Implications For Standard Setting. Accounting Horizons13, p. 365-383.
Jaggi, B. & Baydoun, N. 2001. Evaluation of Extraordinary and Exceptional Items Disclosed by Hong Kong Companies. Abacus, 37(2), 217-232
Jensen, Michael C. dan W.H. Meckling. 1976. Theory of The Firm: Managerial Behavior, Agency Cost and Ownership Structure. Journal of Financial Economics3. hal. 305-360.
Jones, Jennifer J., 1991. Earnings Management During Import Relief Investigations. Journal of Accounting Research, Vol. 29, No. 2, Autumn, pp 193-228.
Kusuma, Hadri. 2004. Dampak Manajemen Laba terhadap Relevansi Informasi Akuntansi: Bukti Empiris dari Indonesia. Jurnal Akuntansi Dan Keuangan, Vol. 8, No. 1, Mei 2006: 1-12
Kusumawati, Astri Arfani Nur dan Noer Sasongko. 2005. Analisis Perbedaan Pengaturan Laba (Earnings Management) pada Kondisi Laba dan Rugi pada Perusahaan Manufaktur di Indonesia. Jurnal Akuntansi dan Keuangan, Vol. 4, No. 1. hal.1-20.
MIIC EMA 12th Unive rsity o f Be ng kulu 1271 | P a g e
Nasution, Marihot dan Doddy Setiawan. 2007. Pengaruh Corporate Governance Terhadap Manajemen Laba di Industri Perbankan Indonesia. Makalah disampaikan dalam Simposium Nasional Akuntansi X di Makassar, 26-28 Juli.
Peasnell, K.V, P.F. Pope. dan S.Young. 2001. Board Monitoring and Earnings Management: Do Outside Directors Influence Abnormal Accruals. Accounting and Business Research, Vol. 30. hal.41-63.
Rajgopal, S., M. Venkatachalam, and J. Jiambalvo. 1999. Is Institutional Ownership Associated with Earnings Management and the Extent to which Stock Prices Reflect
Future Earnings?. Working Paper, http://papers.ssrn.
com/sol3/papers.cfm?abstract_id=163433, March, pp 1-30.
Schipper, Katherine. 1989. Comentary Katherine on Earnings Management. Accounting Horizon. 3, 91-102
Scott, William R. 2006. Financial Acconting theory. 4th Edition. Canada Inc : Pearson Education.
Sekaran, Uma. 2000. Research Methods for Business: A Skill Building Approach. Third Edition. New York: John Wiley & Sons, Inc
Siallagan, Hamonangan dan Mas’ud Machfoedz. 2006. Mekanisme Corporate Governance, Kualitas Laba dan Nilai Perusahaan. Simposium Nasional Akuntansi IX, Ikatan Akuntan Indonesia. Padang 23-26 Agustus 2006
Sugiarta, I Putu. 2004. Earnings Management and Information Content of Audit Committee Announcement. Artikel yang Dipresentasikan pada Simposium Nasional Akuntansi 7 Denpasar tanggal 2 -3 Desember 2004
Ujiyantho, Muh. Arief, dan B. A. Pramuka, 2007. Mekanisme Corporate Governance, Manajemen Laba dan Kinerja Keuangan: Studi Pada Perusahaan Go Publik Sektor Manufaktur. Kumpulan Makalah, Simposium Nasional Akuntansi (SNA) X,
Makassar, 26-27 Juli, h 1-26.
Veronica, Sylvia, dan Siddharta Utama. 2005. Pengaruh Struktur Kepemilikan, Ukuran Perusahaan, dan Praktek Corporate Governance terhadap Pengelolaan Laba (Earnings Management). Artikel yang Dipresentasikan pada Simposium Nasional Akuntansi 8 Solo tanggal 15 - 16 September 2005