DOI: 10.12928/TELKOMNIKA.v11i4.1645 797
Ovarian Cancer Identification using One-Pass
Clustering and k-Nearest Neighbors
Isye Arieshanti*, Yudhi Purwananto, Handayani Tjandrasa
Teknik Informatika, FTIf, Institut Teknologi Sepuluh Nopember, Surabaya, Indonesia Gedung Teknik Informatika, Kampus ITS Sukolilo
*Corresponding author, e-mail: [email protected]
Abstrak
Tingkat kesembuhan pasien dapat ditingkatkan jika kanker ovarium dapat dideteksi lebih awal. Identifikasi deteksi dini kanker ovarium menggunakan profil ekspresi protein (SELDI-TOF MS). Akan tetapi, analisis profil ekspresi protein tidak mudah karena karakteristiknya yang berdimensi tinggi dan mengandung derau. Untuk menangani karakteristik data SELDI-TOF MS tersebut, penelitian ini mengajukan sebuah model identifikasi kanker ovarium yang terdiri atas One-Pass Clustering dan klasifier k-Nearest Neighbors. Hanya dengan komputasi yang sederhana dan efisien, performa model klasifikasi ini mencapai tingkat ketepatan hasil mencapai 97%. Hasil ini menunjukkan bahwa model yang diajukan dapat menjadi alternatif yang menjanjikan dalam identifikasi kanker ovarium.
Kata kunci: kanker ovarium, klasterisasi one-pass clustering, k-nearest neighbors
Abstract
The identification of ovarian cancer using protein expression profile (SELDI-TOF-MS) is important to assists early detection of ovarian cancer. The chance to save patient’s life is greater when ovarian cancer is detected at an early stage. However, the analysis of protein expression profile is challenging because it has very high dimensional features and noisy characteristic. In order to tackle those difficulties, a novel ovarian cancer identification model is proposed in this study. The model comprises of One-Pass Clustering and k-Nearest Neighbors Classifier. With simple and efficient computation, the performance of the model achieves Accuracy about 97%. This result shows that the model is promising for Ovarian Cancer identification.
Keywords: ovarian cancer, one-pass clustering, k-nearest neighbors
1. Introduction
Ovarian cancer is one of most common cancers in Indonesia. The successfull of the disease treatment depend on the stage of disease. The chance to save patient’s life is greater when ovarian cancer is detected at an early stage. In most cases, the disease is detected at advanced stage because the cancer detection at an early stage is quite challenging. Indeed, the protein abnormality as a sign of initial cancer development could be inspected in the protein profiles. One of protein profiling techniques is Surface Enhanced Laser Desorption/Ionization Time-of-Flight Mass Spectrometry (SELDI-TOF MS). The SELDI-TOF MS data could be analyzed for ovarian cancer identification because a cancerous protein expression profile is different from the non-cancer one [1]. However, the comparison process is not trivial because the protein profile has very high dimensional feature and noisy characteristic. In order to tackle the problem of very high dimensional feature and noisy data, a computational model is required to assist the discrimination between cancerous protein and normal protein.
(KPLS). The achieved accuracy is about 98% for data without reduction and 99% for data with feature reduction. The superior performance of the kernel-method-based is also shown in several case studies such as bancruptcy prediction [4] and image processing [5]. Although the performance of model that is developed by [3] is superior compare to previous studies [1,2] the improvement space still remains.
In this study, we propose a novel model for predicting ovarian cancer using a combination of One-Pass clustering and k-Nearest Neighbors. The model is driven by SELDI-TOF MS data. The main contribution is an improvement in time complexity that is more efficient compare to the previous model [3]. Furthermore, the performance in term of accuracy is comparable to KPLS model [3] for data without feature reduction.
This paper is organized as follows, Section II explains about dataset and algorithm that is used in this study. Next, Section III illustrates the result and discussion. Finally, Section IV describes the conclusion.
2. Research Method 2.1. Dataset
Ovarian cancer could be identified from analysis of protein expression profile. The profile can be obtained from several techniques. One of the techniques is Surface Enhanced Laser Desorption/Ionization Time-of-Flight Mass Spectrometry (SELDI-TOF MS). In this study, the model of ovarian cancer identification is developed using SELDI-TOF MS data. The data is available publicly at [6].
The dataset consists of 121 cancer data and 95 non-cancer data. Each data contains more than 370000 features. A feature represents intensity of an m/z ratio. Because values of several features are missing, a preprocessing step to remove feature with missing value is performed. After preprocessing step, the number of retained features is 39905. Subsequently, the dataset with these features will be used for training and testing. The model consists of one-pass clustering model and k-Nearest Neighbor classifier.
2.2. One-pass Clustering
One-pass clustering is an incremental clustering algorithm. As a non-iterative clustering algorithm, it generates clusters of SELDI-TOF MS vector dataset in a single iteration. A data will be placed in a cluster when a similarity between the data and the cluster centroid is the highest compare to other centroids. The similarity metrics is Cosine similarity as defined in Equation 1. The algorithm of one-pass clustering [7] is described in Table 1.
Table 1. One-pass clustering algorithm One-Pass(data_training) return set_of_clusters
Input: data training; Output: set of clusters 1. Initialization:
D = a set of data_training; C = empty set of clusters; t = threshold; i = 0 (index data training); j = 0 (index cluster)
2. Create a new cluster cj and set di as its member. Set di’s label as cj’s label. Add to C.
3. If D is empty go to step 4 else
i = i+1
calculate similarity of di and each centroid cj.
If the similarity>t and label di = label cj
add di to cj and update centroid of cj
else j = j+1 go to step 2
4. Stop clustering. Return C as a set of clusters
data, this model will only use centroids from the set of clusters. This approach reduces the computational time significantly.
2.3. k-Nearest Neighbors
The k-NN is a type of instance-based classification method. In order to classify a query data, k-NN will vote the majority class of k neighbours that are most similar to the query data. Subsequently, the voted class will be transferred to the query data as its label class. The neighbours are chosen from the training dataset. In this model, the training dataset is represented by centroids of clusters from previous one-pass clustering process. The distance metric to compute the similarity between query data and centroids of clusters is Cosine similarity. The Equation of Cosine similarity is defined in Equation 1. The detail of the k-NN algorithm [8] is described in Table 2.
Table 1. k-nearest neighbor algorithm
k-Nearest-Neighbour(training_dataset, query_data, number_of_neighbours) return label_of_data_query Input:
training dataset
a query data
number of neighbours Output: class label of the query data
1. Initialization: D = training dataset k = number of neighbours 2. For each training data in D
compute cosine similarity between query data and training data 3. Sort the training dataset according to similarity value.
4. Choose k training data with largest similarity value 5. Vote majority class of the k training data from step 4 6. Return the majority class as the class label of query data
The performance of the prediction model is measured using accuracy, sensitivity and specificity metric. Accuracy evaluates the ability of the model in predicting the negative and positive data. While sensitivity measures the model ability in predicting the positive result, the specificity evaluates the model ability in predicting negative result. The formulas of accuracy, sensitivity and specificity are described in Equation 2, Equation 3 and Equation 4 respectively.
(1)
(2)
(3)
(4)
In Equation 1, xi and xj denote vector data of SELDI-TOF MS or centroid of a cluster. In Equation 2, 3, and 4 TP, TN, FP and FN are True Positive, True Negative, False Positive and False Negative respectively.
3. Results and Analysis
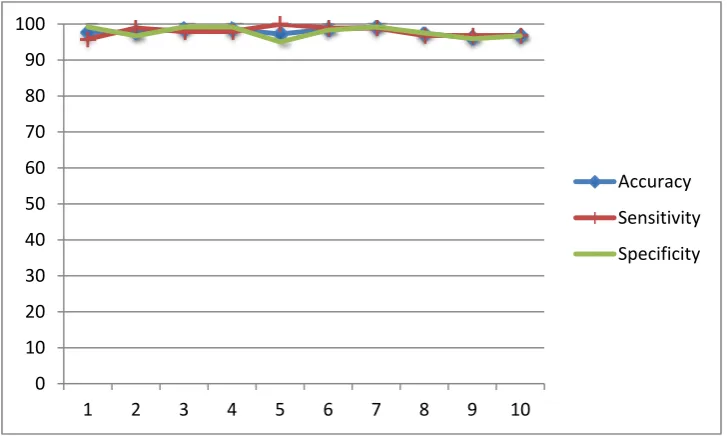
According to the evaluation result that is shown in Figure 1, the accuracy of the proposed model is range from 96.3% to 99.1% with average accuracy is about 97.8%. The average for the sensitivity and specificity are 97.9% and 97.7% respectively. In addition, the range for sensitivity is 95.8%-100% and the range for specificity is 95%-99.2%. These results illustrate the good ability of the model in discriminating cancer protein profiles from non-cancer protein profiles. The performance in identification of positive result (sensitivity) is as high as the performance in classifying negative result (specificity) even though the number of positive training data is more than the number of negative training data.
Figure 1. The performance of the proposed model in terms of accuracy, sensitivity and specificity (%). The mean and standard deviation of accuracy, sensitivity and specificity are 97.8%, 97.9%, 97.7% respectively and standard deviation of accuracy, sensitivity and specificity
are 0.009, 0.012 and 0.015 respectively.
In order to compare the model performance with that of other classification models, the prediction process is also performed in ordinary k-Nearest Neighbour [8], Complement Naïve Bayes [9], Naïve Bayes Multinomial [10], Support Vector Machine (SMO algorithm) [11], Radial Basis Function Network (RBF Network) [12], Decision Tree (J48) [13] and Random Forest [14]. All of those compared classifiers [9-14] are in WEKA [12] implementation with the same Mac OS environment as the proposed model. The memory setting is also the same as the proposed model, 2 Gigabytes. The comparison results are listed in Table 3.
Table 3. Comparison of accuracy between proposed model and other classifiers
Classifier Accuracy (%)
Complement Naïve Bayes 76.8
Naïve Bayes 74.6
Support Vector Machine (SMO) 96.8
RBF Network 86
Decision Tree (J48) 83
Random Forest 84.7
1-Nearest Neighbour 88.5
One-Pass Clustering + k-NN (the proposed model) 97.8
Indeed, we also performed classfication using Bayes Network, Multilayer Perceptron, Voted Perceptron and Logistic Regression. However, the classification is not successful because of the memory problem. The possible explanation is because of the high dimensional
0 10 20 30 40 50 60 70 80 90 100
1 2 3 4 5 6 7 8 9 10
Accuracy
Sensitivity
characteristic of SELDI-TOF MS data. Thus, the Bayes Network, Multilayer Perceptron, Voted Perceptron and Logistic Regression require much more memory compare to other classifiers.
Table 3 illustrates the performance of other classifiers compare to the performance of the proposed model. For Naïve Bayes-based classifier, the result yields about 74%-76%. For other classifiers except SVM (SMO), the performance range about 80%-88%. Exclusively for SVM (SMO), its performance is quite high, about 96%. The performance of SVM is similar to the performance of the proposed model. However, SVM training process requires expensive computational cost. The time complexity for standard SVM is O(n3) and at least O(Nn) for SMO. Where N denotes the number of support vectors and n denotes the number of training samples. Furthermore, when comparing the performance of the KPLS model of [3], their accuracy is about 98%. However, still the time complexity of KPLS is more expensive than that of the proposed model. The time complexity of the KPLS is at least O(n2). On the contrary, the time complexity for the training process in the proposed model is only linear O(n). Where n represents the number of training samples. The time complexity in the training process is required in generating the clusters. Because the clusters are formed in a single-pass of each data training, the process only needs n times basic operation.
4. Conclusion
According to the classification accuracy of various classifiers (Table 4), the SELDI-TOF-MS data could be used for ovarian cancer identification. The classification accuracy of various classifiers are between 74% and 97%. These results conform that the cancerous SELDI-TOF MS data is different from the normal SELDI-TOF MS data.
Furthermore, in terms of classification accuracy, the proposed model in this study has higher performance than the performance of other classifiers as listed in Table 4. The performance of the proposed model is comparable to the performance of SVM (SMO). However, the time complexity of the proposed model is much more efficient than the time complexity of the SVM (SMO).
With the characteristics of the ovarian cancer SELDI-TOF MS data, which has 39905 features, the proposed model also exhibits a superior ability in processing very high dimensional features. When other classifiers such as Bayes Network, Multilayer Perceptron, Voted Perceptron and Logistic Regression fail to process those data (with memory setting 2 Gigabytes), the proposed model is able to compute and perform well in the same setting memory and environment.
Acknowledgement
This work is supported by grant "Bantuan Operasional Perguruan Tinggi Negeri" (BOPTN) in the scheme "Penelitian Dosen Muda" Institut Teknologi Sepuluh Nopember 2013.
References
[1] Zhang H, Kong B, Qu X, Jia L, Deng B, Yang Q. Biomarker discovery for ovarian cancer using SELDI-TOF-MS. Gynecol Oncol. 2006; 102(1): 61-6.
[2] Wu SP, Lin YW, Lai HC, Chu TY, Kuo YL, Liu HS. SELDI-TOF MS profiling of plasma proteins in ovarian cancer. Taiwan J Obstet Gynecol. 2006; 45(1): 26-32.
[3] Tang KL, Li TH, Xiong WW, Chen K. Ovarian cancer classification based on dimensionality reduction for SELDI-TOF data. BMC Bioinformatics. 2010; 27(11): 109.
[4] Arieshanti I, Purwananto Y, Ramadhani A, Ulinnuha M, Ulinnuha N. Comparative Study of Bancruptcy Prediction Models. TELKOMNIKA Telecommunication Computing Electronics and Control. 2013; 11(3): 591-596.
[5] Cui E. Wide Baseline Matching Using Support Vector Regression. TELKOMNIKA Telecommunication Computing Electronics and Control. 2013; 11(3)
[6] Gordon Whiteley. Biomarker Profiling, Discovery and Identification. Center for Cancer Research, National Cancer Institute. Available. online at: http://home.ccr.cancer.gov/ncifdaproteomics/ppatterns.asp
[7] S Rieber, VP Marathe. The Single Pass Clustering Method.
[8] D Aha, D Kibler. Instance-based learning algorithms. Machine Learning. 1991; (6) 37-66.
[10] Andrew McCallum and Kamal Nigam. A Comparison of Event Models for Naive Bayes Text Classification. AAAI-98 Workshop on 'Learning for Text Categorization' 1998
[11] J Platt. Fast training of support vector machines using sequential minimal optimization. in B. Schoelkopf, C. Burges and A. Smola. Kernel Methods - Support Vector Learning. MIT press 1998 [12] M Hall, OF L Frank, G Holmes, B Pfahringer, P Reutemann, I H Witten. The WEKA data mining
software: an update. ACM SIGKDD Explorations. 2009; 11(1): 10-18
[13] R Quinlan. C4.5: Programs for Machine Learning. Morgan Kaufmann Publishers. San Mateo, CA. 1993