ABSTRACT
NUR AISYAH NUZULIA. Study of Biphasic Calcium Phosphate Ceramics and HA-Chitosan Composite Implanted into Sheep’s Bone. Under direction of AKHIRUDDIN MADDU and
KIAGUS DAHLAN.
Biphasic Calcium Phosphate (BCP) biomaterials are recognized as biodegradable, bioresorbable, and osteoconductive material and, therefore, it is suitable for filling bone defects to aid regeneration process of new bone tissue. This study aimed to synthesize BCP ceramics by precipitation method and observe bone growth using BCP ceramics and HA-Chitosan composite implanted into sheep’s bone. BCP ceramics was prepared by precipitation of Na2HPO4.2H2O which was dropped by CaCl2.2H2O at temperature 700C with various molar ratios and various volume of solution. Molar ratio of Ca and P was variated approximately 0.2M:0.2M and 0.334M:0.2M while various volume of solution was 50 ml and 100 ml. BCP ceramics was formed which was indicated by mass of precipitate and the result showed that sample with greater molarity of Ca was resulting in bigger mass precipitate. It showed that higher molarity of Ca/P tends to be more mass precipitate. The X-Ray Diffraction results showed that BCP 100 ml with molar ratio Ca/P about 0.334M:0.2M had the expected characteristics of implant material for in vivo experiment into sheep’s bone. Moreover, it showed the consistency of sample which indicates that it was a reproducible biomaterial. This result was also supported by Fourier Transform Infrared (FTIR) and Scanning Electron Microscopy (SEM) characterization. In vivo study of BCP ceramics and HA-Chitosan composite showed that bone recovery without bone graft (control) was more complete than that with BCP and HA-Chitosan bone grafts. Based on pathological evaluation, the results indicated that BCP ceramics was biodegradable and bioresorbable but less osteoconductive. In the contrary, HA-chitosan composite was not biodegradable and bioresorbable but more osteoconductive. Moreover, BCP bone graft was more readily resorbed by the body than HA-Chitosan. Resorption of HA-Chitosan bone graft was very slow but new tissue growth was faster than that of BCP bone graft. In contrary, resorption of BCP bone graft was very fast but new tissue growth was very slow.
16
Appendix 1 Flow chart
Yes Materials and equipment preparation
ready
Solution preparation
Precipitation of biphasic apatite
Analysis data
Report arrangement
No
XRD, FTIR and SEM Characterization
17
Appendix 2 Maximum XRD peak of samples
A
Sample TCP HA OCP
PHASE
2θ int int-f 2θ int %Δ2θ 2θ int %Δ2θ 2θ int %Δ2θ
10.56 94 22.169811 10.847 12 97.354107 10.82 12 97.597043 HA
22.58 61 14.386792 22.206 4 98.315771 22.902 10 98.594009 22.723 80 99.370682 OCP
25.6 177 41.745283 25.802 25 99.217115 25.879 40 98.921906 25.576 80 99.906162 OCP
27.48 59 13.915094 27.42 8 99.781182 27.681 80 99.27387 TCP
28.62 86 20.283019 28.68 2 99.790795 28.966 18 98.805496 28.126 80 98.243618 TCP
31.46 424 100 31.026 100 98.601173 31.773 100 99.014887 31.474 100 99.955519 OCP
31.88 253 59.669811 31.773 100 99.663236 31.589 100 99.078793 HA
32.54 282 66.509434 32.448 20 99.716469 32.196 60 98.931544 32.533 90 99.978483 OCP
33.74 102 24.056604 33.484 8 99.235456 33.928 90 99.445885 OCP
39.4 106 25 39.8 10 98.994975 39.204 8 99.500051 39.311 80 99.7736 OCP
46.3 142 33.490566 46.034 2 99.422166 46.711 30 99.120122 46.534 80 99.497142 OCP
49.12 151 35.613208 49.496 90 99.240343 OCP
50.86 58 13.679245 50.733 6 99.74967 50.493 20 99.273167 TCP
52.86 83 19.575472 52.944 25 99.841342 TCP
18
Continue B
Sample TCP HA OCP
PHASE
2θ int int-f 2θ int %Δ2θ 2θ int %Δ2θ 2θ int %Δ2θ
10.8 104 23.582766 10.847 12 99.5667 10.82 12 99.815157 HA
22.8 50 11.337868 22.902 10 99.554624 22.723 80 99.661136 HA
25.92 164 37.188209 25.802 25 99.542671 25.354 2 97.767611 25.955 100 99.865151 TCP
27.8 56 12.698413 27.769 55 99.888365 27.681 80 99.570102 TCP
28.78 69 15.646259 28.68 2 99.651325 28.966 18 99.357868 29.257 90 98.369621 HA
31.08 85 19.274376 31.026 100 99.825952 31.361 80 99.103983 TCP
31.68 441 100 31.773 100 99.707299 31.589 100 99.711925 OCP
32.18 372 84.353741 32.448 20 99.174063 32.196 60 99.950304 32.291 90 99.656251 HA
32.74 361 81.85941 32.902 60 99.507629 32.533 90 99.363723 HA
34.02 88 19.954649 34.048 25 99.917763 HA
34.32 44 9.9773243 34.371 65 99.851619 34.466 90 99.576394 TCP
39.58 114 25.85034 39.8 10 99.447236 39.818 20 99.40228 39.855 70 99.309999 TCP
41.78 48 10.884354 41.683 12 99.767291 42.029 10 99.407552 41.988 90 99.50462 TCP
46.52 174 39.455782 46.635 4 99.753404 46.711 30 99.591103 46.534 80 99.969914 OCP
47.88 55 12.471655 47.968 16 99.816544 TCP
49.4 149 33.786848 49.785 12 99.226675 49.468 40 99.862537 49.496 90 99.806045 HA
49.52 86 19.501134 49.785 12 99.467711 TCP
50.96 71 16.099773 50.733 6 99.552559 51.283 12 99.370162 HA/TCP
53.22 83 18.820862 53.512 8 99.454328 53.143 20 99.855108 HA
61.18 32 7.2562358 60.897 4 99.535281 61.66 10 99.221537 TCP
19
Continue B1-1
Sample TCP HA OCP
PHASE
2θ int int-f 2θ int %Δ2θ 2θ int %Δ2θ 2θ int %Δ2θ
13.56 24 12 13.633 16 99.464535 TCP
16.84 32 16 16.841 6 99.994062 16.043 90 95.032101 HA
23.16 26 13 22.902 10 98.873461 23.082 80 99.662074 OCP
25.88 60 30 25.802 25 99.697698 25.879 40 99.996136 25.955 80 99.711038 HA
27.8 96 48 27.769 55 99.888365 27.681 80 99.570102 TCP
29.74 28 14 29.655 16 99.71337 29.858 70 99.604796 TCP
31.08 200 100 31.026 100 99.825952 31.361 80 99.103983 TCP
31.56 94 47 31.773 100 99.329619 31.589 100 99.908196 OCP
32.56 150 75 32.448 20 99.654832 32.902 60 98.96055 32.533 90 99.917007 OCP
34.32 110 55 34.371 65 99.851619 34.048 25 99.201128 34.466 90 99.576394 TCP
35.6 38 19 35.597 12 99.991572 35.48 6 99.661781 35.164 80 98.760096 TCP
37.34 34 17 37.328 10 99.967853 TCP
39.38 48 24 39.8 10 98.944724 39.204 8 99.551066 39.311 80 99.824477 OCP
41.14 52 26 41.088 14 99.873442 40.796 90 99.15678 TCP
43.88 30 15 43.893 6 99.970383 43.804 8 99.8265 43.472 80 99.061465 TCP
46.44 58 29 46.635 4 99.581859 46.711 30 99.419837 46.534 80 99.797997 OCP
48 60 30 48.402 14 99.169456 48.103 16 99.785876 48.929 90 98.10133 HA
50.12 36 18 50.314 6 99.614421 50.493 20 99.261284 TCP
53.08 80 40 53.512 8 99.192704 53.143 20 99.881452 HA
57.54 22 11 57.557 4 99.970464 57.128 8 99.278812 TCP
59.66 42 21 59.513 12 99.752995 59.938 6 99.536187 TCP
60.92 30 15 60.897 4 99.962231 60.457 6 99.234166 TCP
20
Continue B1-2
Sample TCP HA OCP
PHASE
2θ int int-f 2θ int %Δ2θ 2θ int %Δ2θ 2θ int %Δ2θ
25.86 58 39.72603 25.802 25 99.77521 25.879 40 99.92658 25.955 100 99.63398 HA
27.82 72 49.31507 27.769 55 99.81634 27.681 80 99.49785 TCP
28.82 30 20.54795 28.68 2 99.51185 28.966 18 99.49596 28.126 80 97.53253 HA
29.6 28 19.17808 29.655 16 99.81453 29.554 80 99.84435 TCP
31.16 146 100 31.026 100 99.5681 31.361 80 99.35908 TCP
31.66 142 97.26027 31.589 100 99.77524 OCP
31.72 122 83.56164 31.773 100 99.83319 HA
32.76 132 90.41096 32.448 20 99.03846 32.902 60 99.56842 32.533 90 99.30225 HA
34.38 88 60.27397 34.371 65 99.97382 34.048 25 99.02491 TCP
39.54 54 36.9863 39.8 10 99.34673 39.818 20 99.30182 HA
41.12 44 30.13699 41.088 14 99.92212 TCP
43.94 26 17.80822 43.893 6 99.89292 43.804 8 99.68953 TCP
45.38 28 19.17808 45.305 8 99.83446 45.305 6 99.83446 HA/TCP
46.66 62 42.46575 46.635 4 99.94639 46.711 30 99.89082 HA
48.02 52 35.61644 48.402 14 99.21078 48.103 16 99.82745 HA
49.4 52 35.61644 49.785 12 99.22667 49.468 40 99.86254 HA
50.2 44 30.13699 50.314 6 99.77342 50.493 20 99.41972 HA
53.22 50 34.24658 53.512 8 99.45433 53.143 20 99.85511 HA
59.62 44 30.13699 59.513 12 99.82021 59.938 6 99.46945 TCP
61 30 20.54795 60.897 4 99.83086 61.66 10 98.92961 TCP
64.04 34 23.28767 64.677 4 99.01511 64.078 13 99.9407 HA
66.24 24 16.43836 66.28 6 99.93965 66.386 4 99.78007 TCP
71.3 24 16.43836 71.651 5 99.51013 HA
73.66 20 13.69863 73.995 7 99.54727 HA
21
Continue B2-1
Sample TCP HA OCP PHASE
2θ int int-f 2θ int %Δ2θ 2θ int %Δ2θ 2θ int %Δ2θ
21.46 104 18.909091 21.393 4 99.68681 21.819 10 98.35465 20.785 70 96.75247 TCP
23.14 114 20.727273 22.902 10 98.96079 23.082 80 99.74872 HA
26.1 108 19.636364 26.188 4 99.66397 25.879 40 99.14603 26.346 80 99.06627 TCP
28.54 84 15.272727 28.68 2 99.51185 28.126 12 98.52805 28.126 80 98.52805 TCP
29.58 140 25.454545 29.655 16 99.74709 29.554 80 99.91203 TCP
31.52 490 89.090909 31.026 100 98.40779 31.773 100 99.20373 31.474 100 99.85385 OCP
32.5 550 100 32.448 20 99.83974 32.196 60 99.05578 32.533 90 99.89856 OCP
33.66 202 36.727273 33.484 8 99.47438 34.048 25 98.86043 33.536 90 99.63025 HA
39.28 148 26.909091 39.8 10 98.69347 39.204 8 99.80614 39.311 80 99.92114 HA
40.98 132 24 41.088 14 99.73715 40.452 2 98.69475 40.796 90 99.54898 TCP
44.92 66 12 44.902 4 99.95991 45.305 6 99.1502 45.067 80 99.67382 TCP
46.4 202 36.727273 46.635 4 99.49609 46.711 30 99.3342 46.534 80 99.71204 HA
49.54 148 26.909091 49.785 12 99.50788 49.468 40 99.85445 49.496 90 99.9111 HA
50.64 94 17.090909 50.733 6 99.81669 50.493 20 99.70887 TCP
53.86 80 14.545455 53.512 8 99.34968 54.44 4 98.93461 TCP
57.98 50 9.0909091 57.557 4 99.26508 58.073 4 99.83986 HA
59.62 60 10.909091 59.513 12 99.82021 59.938 6 99.46945 TCP
62.58 50 9.0909091 63.011 12 99.31599 HA
64.12 78 14.181818 64.677 4 99.1388 64.078 13 99.93445 HA
22
Continue B2-2
Sample TCP HA OCP
PHASE
2θ int int-f 2θ int %Δ2θ 2θ int %Δ2θ 2θ int %Δ2θ
22.92 42 28.767123 22.206 4 96.784653 22.902 10 99.921404 22.723 80 99.133037 HA
26.08 48 32.876712 26.188 4 99.587597 25.879 40 99.223308 26.346 80 98.990359 TCP
27.88 46 31.506849 27.769 55 99.600274 28.126 12 99.125364 27.681 80 99.281095 TCP
31.46 146 100 31.026 100 98.601173 31.773 100 99.014887 31.474 100 99.955519 OCP
32.6 132 90.410959 32.448 20 99.531558 32.902 60 99.082123 32.533 90 99.794055 OCP
33.72 64 43.835616 33.484 8 99.295186 33.536 90 99.451336 OCP
34.32 60 41.09589 34.371 65 99.851619 34.048 25 99.201128 34.466 90 99.576394 TCP
39.52 42 28.767123 39.8 10 99.296482 39.818 20 99.251595 39.311 80 99.468342 HA
41 52 35.616438 41.088 14 99.785826 40.796 90 99.499951 TCP
46.5 70 47.945205 46.635 4 99.710518 46.711 30 99.548286 46.534 80 99.926935 HA
49.6 60 41.09589 49.785 12 99.628402 49.468 40 99.733161 49.496 90 99.789882 HA
53.64 42 28.767123 53.512 8 99.760801 53.143 20 99.064787 HA
59.56 30 20.547945 59.513 12 99.921026 59.938 6 99.369348 TCP
61.02 24 16.438356 60.897 4 99.79802 61.66 10 98.96205 TCP
64.12 36 24.657534 64.677 4 99.138797 64.078 13 99.934455 HA
71.24 16 10.958904 71.651 5 99.426386 HA
23
Appendix 3 JCPDS reference
Hydroxyapatite
24
Octa Calcium Phosphate
25
Appendix 4 Lattice parameter calculation match to HA
B1-1
2θ h k l α γ (rad) 2θ θ δ
sin2θ αsin 2θ γ
sin2θ δsin2θ α2 γ 2 δ2 αγ δγ αδ a (Å) accuracy c (Å) accuracy
16.8 1 0 1 1 1 0.294 0.147 0.839 0.021 0.021 0.021 0.018 1 1 0.704 1 0.839 0.839 9.295 98.7 6.797 98.73
25.9 0 0 2 0 4 0.452 0.226 1.905 0.05 0 0.201 0.096 0 16 3.63 0 7.621 0
48 3 1 2 13 4 0.838 0.419 5.523 0.165 2.151 0.662 0.914 169 16 30.5 52 22.09 71.79
53.1 0 0 4 0 16 0.926 0.463 6.392 0.2 0 3.194 1.276 0 256 40.85 0 102.3 0
64 3 0 4 9 16 1.117 0.559 8.081 0.281 2.529 4.496 2.271 81 256 65.3 144 129.3 72.73
Σ 0.718 4.701 8.574 4.574 251 545 141 197 262.1 145.4 δ
γ α
θ = C + B + A
2 sin 2 2 2 2 2 2 3 4 1 c l a k hk h
d ⎟⎟⎠+
⎞ ⎜⎜ ⎝ ⎛ + + = 2 2 2 2 2 2 sin sin sin
∑
∑
∑
∑
∑
∑
∑
∑
∑
∑
∑
∑
+ + = + + = + + = δ δγ αδ θ δ γδ γ αγ θ γ αδ αγ α θ α A B C A B C A B C ) (h2 + hk + k2= α 2 l = γ θ δ =10 sin 2 2
26
Continue B1-2
2θ h k l α γ 2θ
(rad) θ δ sin2θ αsin
2θ γsin2θ δsin2θ α2 γ 2 δ2 αγ δγ αδ a (Å) accuracy c (Å) accuracy
25.9 0 0 2 0 4 0.451 0.226 1.902 0.05 0 0.2 0.095 0 16 3.619 0 7.61 0 9.443 99.73 6.863 99.69
28.8 2 1 0 7 0 0.503 0.252 2.324 0.062 0.434 0 0.144 49 0 5.4 0 0 16.27
31.7 2 1 1 7 1 0.554 0.277 2.764 0.075 0.523 0.075 0.206 49 1 7.641 7 2.764 19.35
32.8 3 0 0 9 0 0.572 0.286 2.928 0.08 0.716 0 0.233 81 0 8.574 0 0 26.35
39.5 3 1 0 13 0 0.69 0.345 4.053 0.114 1.487 0 0.464 169 0 16.43 0 0 52.69
45.4 2 0 3 4 9 0.792 0.396 5.066 0.149 0.595 1.339 0.754 16 81 25.67 36 45.6 20.27
46.7 2 2 2 12 4 0.814 0.407 5.29 0.157 1.882 0.627 0.83 144 16 27.98 48 21.16 63.47
48 3 1 2 13 4 0.838 0.419 5.526 0.166 2.152 0.662 0.915 169 16 30.54 52 22.1 71.84
49.4 2 1 3 7 9 0.862 0.431 5.765 0.175 1.222 1.572 1.007 49 81 33.23 63 51.88 40.35
50.2 3 2 1 19 1 0.876 0.438 5.903 0.18 3.419 0.18 1.062 361 1 34.84 19 5.903 112.1
53.2 0 0 4 0 16 0.929 0.464 6.415 0.201 0 3.21 1.287 0 256 41.15 0 102.6 0
64 3 0 4 9 16 1.118 0.559 8.084 0.281 2.53 4.498 2.273 81 256 65.35 144 129.3 72.75
71.3 4 3 1 37 1 1.244 0.622 8.972 0.34 12.57 0.34 3.048 1369 1 80.5 37 8.972 332
73.7 4 2 3 28 9 1.286 0.643 9.208 0.359 10.06 3.234 3.309 784 81 84.8 252 82.88 257.8
76 4 3 2 37 4 1.326 0.663 9.415 0.379 14.02 1.516 3.569 1369 16 88.64 148 37.66 348.3
27
Continue B2-1
2θ h k l α γ 2θ
(rad) θ δ sin
2θ αsin
2θ γsin2θ δsin2θ α2 γ 2 δ2 αγ δγ αδ a (Å) accuracy c (Å) accuracy
23.1 1 1 1 3 1 0.404 0.202 1.544 0.04 0.121 0.04 0.062 9 1 2.385 3 1.544 4.633 9.385 99.65 6.804 98.83
33.7 2 0 2 4 4 0.587 0.294 3.072 0.084 0.335 0.335 0.258 16 16 9.438 16 12.29 12.29
39.3 2 1 2 7 4 0.686 0.343 4.008 0.113 0.791 0.452 0.453 49 16 16.07 28 16.03 28.06
46.4 2 2 2 12 4 0.81 0.405 5.244 0.155 1.862 0.621 0.814 144 16 27.5 48 20.98 62.93
49.5 2 1 3 7 9 0.865 0.432 5.789 0.176 1.229 1.58 1.016 49 81 33.51 63 52.1 40.52
58 5 0 1 25 1 1.012 0.506 7.189 0.235 5.872 0.235 1.689 625 1 51.68 25 7.189 179.7
62.6 5 0 2 25 4 1.092 0.546 7.879 0.27 6.744 1.079 2.125 625 16 62.08 100 31.52 197
64.1 3 0 4 9 16 1.119 0.56 8.095 0.282 2.536 4.508 2.281 81 256 65.52 144 129.5 72.85
77.2 5 1 3 31 9 1.347 0.673 9.506 0.389 12.06 3.5 3.697 961 81 90.37 279 85.56 294.7
28
Continue B2-2
2θ h k l α γ 2θ
(rad) θ δ sin
2θ αsin
2θ γsin2θ δsin2θ α2 γ 2 δ2 αγ δγ αδ a (Å) accuracy c (Å) accuracy
22.9 1 1 1 3 1 0.4 0.2 1.517 0.039 0.118 0.039 0.06 9 1 2.3 3 1.517 4.55 9.648 97.56 7.006 98.23
39.5 3 1 0 13 0 0.69 0.345 4.049 0.114 1.486 0 0.463 169 0 16.4 0 0 52.64
46.5 2 2 2 12 4 0.812 0.406 5.262 0.156 1.87 0.623 0.82 144 16 27.68 48 21.05 63.14
49.6 2 1 3 7 9 0.866 0.433 5.799 0.176 1.232 1.583 1.02 49 81 33.63 63 52.19 40.6
53.6 0 0 4 0 16 0.936 0.468 6.485 0.204 0 3.257 1.32 0 256 42.06 0 103.8 0
64.1 3 0 4 9 16 1.119 0.56 8.095 0.282 2.536 4.508 2.281 81 256 65.52 144 129.5 72.85
71.2 4 3 1 37 1 1.243 0.622 8.966 0.339 12.55 0.339 3.041 1369 1 80.38 37 8.966 331.7
77.1 5 1 3 31 9 1.345 0.673 9.5 0.388 12.03 3.494 3.688 961 81 90.25 279 85.5 294.5
29
Appendix 5 Lattice parameter calculation match to TCP
B1-1
2θ h k l α γ 2θ
(rad) θ δ sin2θ
αsin2θ γ sin2θ δ
sin2θ α2 γ 2 δ2 αγ δγ αδ a (Å)
accuracy c (Å) accuracy
13.6 1 0 4 1 16 0.237 0.118 0.55 0.014 0.014 0.223 0.008 1 256 0.302 16 8.796 0.55 10.4 99.76 37.22 99.56
27.8 2 1 4 7 16 0.485 0.243 2.175 0.058 0.404 0.923 0.126 49 256 4.731 112 34.8 15.23
29.7 3 0 0 9 0 0.519 0.26 2.461 0.066 0.593 0 0.162 81 0 6.055 0 0 22.15
31.1 0 2 10 4 100 0.542 0.271 2.665 0.072 0.287 7.178 0.191 16 10000 7.102 400 266.5 10.66
34.3 2 2 0 12 0 0.599 0.299 3.179 0.087 1.045 0 0.277 144 0 10.11 0 0 38.15
35.6 2 1 10 7 100 0.621 0.311 3.389 0.093 0.654 9.345 0.317 49 10000 11.48 700 338.9 23.72
37.3 1 2 11 7 121 0.652 0.326 3.679 0.102 0.717 12.4 0.377 49 14641 13.53 847 445.2 25.75
41.1 4 0 4 16 16 0.718 0.359 4.328 0.123 1.975 1.975 0.534 256 256 18.73 256 69.25 69.25
43.9 2 3 2 19 4 0.766 0.383 4.805 0.14 2.652 0.558 0.671 361 16 23.08 76 19.22 91.29
50.1 3 2 10 19 100 0.875 0.437 5.889 0.179 3.409 17.94 1.057 361 10000 34.68 1900 588.9 111.9
57.5 5 1 4 31 16 1.004 0.502 7.119 0.232 7.181 3.706 1.649 961 256 50.69 496 113.9 220.7
59.7 5 1 7 31 49 1.041 0.521 7.448 0.247 7.67 12.12 1.843 961 2401 55.48 1519 365 230.9
60.9 2 1 22 7 484 1.063 0.532 7.638 0.257 1.799 124.4 1.963 49 234256 58.33 3388 3697 53.46
Σ 1.671 28.4 190.8 9.173 3338 282338 294.3 9710 5947 913.7 δ
γ α
θ = C + B + A
2 sin 2 2 2 2 2 2 3 4 1 c l a k hk h
d ⎟⎟⎠+
⎞ ⎜⎜ ⎝ ⎛ + + = 2 2 2 2 2 2 sin sin sin
∑
∑
∑
∑
∑
∑
∑
∑
∑
∑
∑
∑
+ + = + + = + + = δ δγ αδ θ δ γδ γ αγ θ γ αδ αγ α θ α A B C A B C A B C ) (h2 + hk + k2= α 2 l = γ θ δ =10 sin 2 2
30
Continue B1-2
2θ h k l α γ 2θ
(rad) θ δ sin2θ
αsin2θ γ sin2θ δ
sin2θ α2 γ 2 δ2 αγ δγ αδ a (Å) accuracy c (Å) accuracy
27.8 2 1 4 7 16 0.486 0.243 2.178 0.058 0.405 0.925 0.126 49 256 4.744 112 34.85 15.25 10.46 99.57 37.4 99.951
29.6 3 0 0 9 0 0.517 0.258 2.44 0.065 0.587 0 0.159 81 0 5.952 0 0 21.96
31.2 0 2 10 4 100 0.544 0.272 2.677 0.072 0.289 7.214 0.193 16 10000 7.168 400 267.7 10.71
34.4 2 2 0 12 0 0.6 0.3 3.189 0.087 1.048 0 0.279 144 0 10.17 0 0 38.26
41.1 4 0 4 16 16 0.718 0.359 4.325 0.123 1.973 1.973 0.533 256 256 18.7 256 69.2 69.2
43.9 2 3 2 19 4 0.767 0.383 4.815 0.14 2.659 0.56 0.674 361 16 23.18 76 19.26 91.49
45.4 2 2 12 12 144 0.792 0.396 5.066 0.149 1.786 21.43 0.754 144 20736 25.67 1728 729.5 60.8
59.6 5 1 7 31 49 1.041 0.52 7.442 0.247 7.661 12.11 1.839 961 2401 55.39 1519 364.7 230.7
61 2 1 22 7 484 1.065 0.532 7.65 0.258 1.803 124.7 1.97 49 234256 58.52 3388 3702 53.55
66.2 5 2 6 39 36 1.156 0.578 8.377 0.299 11.64 10.75 2.501 1521 1296 70.17 1404 301.6 326.7
Σ 1.498 29.85 179.6 9.028 3582 269217 279.7 8883 5489 918.6
B2-1
2θ h k l α γ 2θ
(rad) θ δ sin2θ
αsin2θ γ sin2θ δ
sin2θ α2 γ 2 δ2 αγ δγ αδ a (Å) accuracy c (Å) accuracy
21.5 0 1 8 1 64 0.375 0.187 1.338 0.035 0.035 2.218 0.046 1 4096 1.791 64 85.66 1.338 10.17 97.621 36.16 96.738 26.1 2 1 1 7 1 0.456 0.228 1.935 0.051 0.357 0.051 0.099 49 1 3.746 7 1.935 13.55
28.5 1 2 5 7 25 0.498 0.249 2.283 0.061 0.425 1.519 0.139 49 625 5.21 175 57.07 15.98 29.6 3 0 0 9 0 0.516 0.258 2.437 0.065 0.586 0 0.159 81 0 5.938 0 0 21.93 41 4 0 4 16 16 0.715 0.358 4.301 0.123 1.96 1.96 0.527 256 256 18.5 256 68.81 68.81 44.9 3 1 11 13 121 0.784 0.392 4.986 0.146 1.897 17.66 0.728 169 14641 24.86 1573 603.3 64.82 50.6 5 0 2 25 4 0.884 0.442 5.978 0.183 4.573 0.732 1.093 625 16 35.74 100 23.91 149.4 53.9 3 0 18 9 324 0.94 0.47 6.522 0.205 1.846 66.46 1.338 81 104976 42.53 2916 2113 58.7 59.6 5 1 7 31 49 1.041 0.52 7.442 0.247 7.661 12.11 1.839 961 2401 55.39 1519 364.7 230.7
31
B2-2
2θ h k l α γ 2θ
(rad) θ δ sin
2θ αsin 2θ γ
sin2θ δ
sin2θ α2 γ 2 δ2 αγ δγ αδ a (Å) accuracy c (Å) accuracy
26.1 2 1 1 7 1 0.455 0.228 1.933 0.051 0.356 0.051 0.098 49 1 3.735 7 1.933 13.53 10.32 99.08 36.91 98.75
27.9 2 1 4 7 16 0.487 0.243 2.187 0.058 0.406 0.929 0.127 49 256 4.782 112 34.99 15.31
34.3 2 2 0 12 0 0.599 0.299 3.179 0.087 1.045 0 0.277 144 0 10.11 0 0 38.15
41 4 0 4 16 16 0.716 0.358 4.304 0.123 1.962 1.962 0.528 256 256 18.53 256 68.87 68.87
59.6 5 1 7 31 49 1.04 0.52 7.433 0.247 7.647 12.09 1.834 961 2401 55.25 1519 364.2 230.4
61 2 1 22 7 484 1.065 0.532 7.653 0.258 1.804 124.7 1.972 49 234256 58.56 3388 3704 53.57
32
33
34
35
1
INTRODUCTION
Background
Over 8 million surgical procedures are performed annually in the United States to treat million of Americans experiencing organ failure or tissue loss. Although the procedures for organ transplantation and reconstruction surgery improve the quality of life, and in some cases save life, there are problems associated with them. In most cases these procedures require either organ donation from a donor individual or tissue transplantation from a second surgical site of patient. The major problem with organ transplantation is the drastic shortage of donor organs. In 1996 alone, only 20.000 donor organs were available for 50.000 patients in need. In fact, patients are more likely to die while waiting for a human donor heart than in the first two years after transplantation. The problem with second site surgeries is that these procedures are associated with pain and morbidity. As a result of these problems, the science of tissue engineering has emerged with the goal of developing organs, tissues, and synthetic materials outside of the body ready for future
transplant use1. Besides tissue engineering
offers a promising approach toward healing of large bone defects and could help an estimated 200.000 patients each year2.
Hard tissue diseases and defects, osteoporosis, and osteoarthritis are some of the most significant related medical conditions leading to an extensive need for the use of appropriate implant materials. Therefore, an appropriate technique is needed to stimulate tissue repairing by induction and regeneration despite of eliminating problems of donor scarcity, supply limitation, pathogen transfer, and immune rejection. Different approaches applying synthetic materials are in current utilization to solve bone tissue related clinical conditions. One of them is the use of materials as bone substitute. Several materials produced by different synthesis methods have been developed and used as bone plants such as corals derivatives, calcium phosphates, alumina, titania, polyurethane, Co–Cr alloys,
PMMA3.
The use of Calcium Phosphate materials as bone substitutes has increased in the last years. Although the autologous bone grafts remain as the gold standard, the low disponibility and the morbidity of the patient donor site have made Calcium Phosphate materials as the best bone substitutes for
certain applications, bone grafting, bone fillers in trauma, fracture repair or in dental applications. Their chemical structure are close to bone mineral, their osteoconductivity and osteoinductivity, the ability to be resorbed by the organism and the biocompatibility of the degradation products as a source of calcium and phosphate ions in the implant site, make them very suitable biomaterials4. Most calcium phosphate ceramics are classified as bioactive ceramics, they elicit a direct bond between the ceramics and living bone tissue. Because of this excellent compatibility with bone tissue, these materials are appealing for bone tissue engineering. Although there are many varieties of bioactive ceramics, bone tissue engineers have focused almost exclusively on hydroxyapatite (HA) and tricalcium phosphate (TCP); ceramics that closely resemble the mineral phase of bone. Although HA is a well-defined crystalline material which is very stable under physiological conditions, TCP, the dehydrated version of HA, is much less defined and less stable under physiological conditions. Because HA is very stable under physiological conditions leading to extremely slow or nonexistent resorption, TCP may have a biological advantage over HA in its biodegradability, resulting in a faster replacement of the material with bone tissue2. Both of these osteoconductive bioceramics bond tightly with bone, but HA is less resorbable than -TCP. As an ideal bone grafting material should be replaceable by new bone, it needs to be both biodegradable and osteoconductive. A mixture of HA and -TCP produces biphasic calcium phosphate (BCP) which possesses the reactivity of -TCP and the stability of HA, providing more bioactivity, involving more new bone growth, and ensuring better resistance of the implants to strain5.
The inorganic component of the bone tissue is non-stoichiometric apatite. This evidence stimulated design and development of a new generation of synthetic resorbable apatite substitutes, which, stimulating some properties of the biological phase, which after implantation can actively participate to the bone generation, solving the problem caused
by stoichiometric HA implants7. In order to
2
Objectives of the Research
1.Synthesizing biomaterial which analyzed
by X-Ray Diffraction (XRD), Fourier Transform Infrared (FTIR), and Scanning Electron Microscopy (SEM) characterization
2.Observing biomaterial growth which is
implanted by in vivo experiment into sheep’s bone.
Time and Place of Research
This research was conducted from December 2008 through July 2009 which held in IPB-Biophysics Laboratory. The characterization was done in three different laboratory; Balai Penelitian dan Pengembangan Kehutanan Bogor for XRD, Integrated Laboratory - Biofarmaka Bogor Agricultural University for FTIR, and Pusat Penelitian Geologi Laut (PPGL) Bandung for SEM.
THEORY
Hidroxyapatite
Apatite minerals are found in almost all igneous rocks as well as in sedimentary and metamorphic rocks. They are the most abundant phosphorus bearing minerals. The commonest varieties are:
Fluorapatite Ca10(PO4)6F2 Chloroapatite Ca10(PO4)6Cl2 Hydroxyapatite Ca10(PO4)6(OH)2 Podolite Ca10(PO4)6CO3 Dahliite Ca10(PO4 , CO3)6(OH)2 Francolite Ca10(PO4 , CO3)6(F , OH)2
“Apatite” is a general term for crystalline minerals with composition of M10(ZO4)6X2. The name was taken from the Greek word “apato” by Werner which means deceit. Many elements occupy the M, Z, and X sites: M = Ca, Sr, Ba, Cd, Pb, etc.
Z = P, V, As, S, Si, Ge, CO3, etc. X = F, Cl, OH, O, Br, CO3, etc8.
The apatite structure is very hospitable in allowing the substitutions of many other ions.
Ca, PO4, and OH groups in apatite can be
substituted. Carbonate (CO3) can substitute
either for the hydroxyl (OH) or the phosphate
(PO4) group, designated as Type A or Type B
substitution, respectively. The substitutions cause morphological changes in precipitated apatite crystals as well as their properties. For
example, CO3 substituted apatite is more
soluble than CO3 – free synthetic apatite9
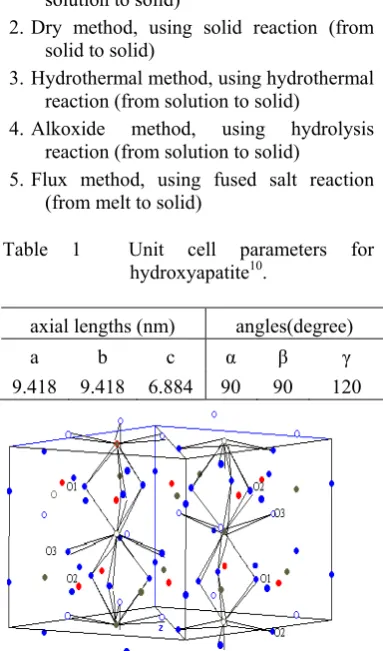
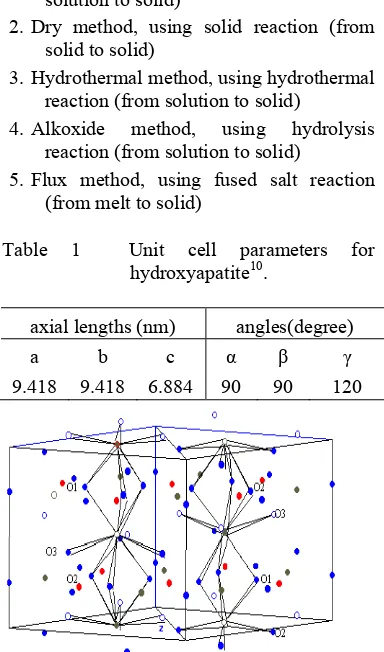
“Hydroxyapatite” is a member of the apatite group of minerals, and its chemical formula is Ca10(PO4)6(OH)2. Hydroxyapatite is a calcium phosphate including hydroxide and its Ca/P ratio is represented as 1.678. Hydroxyapatite is a hexagonal crystal with P63/m symmetry and lattice parameters quite similar to aragonite, and has even been hydrothermally converted from biological and geological aragonite10.
Hydroxyapatite is the most commonly used calcium phosphate in the medical field, as it possesses excellent biocompatibility and is osteoconductive9. Hydroxyapatite has been utilized as a fertilizer, a fluorescent substance, an absorbent, a catalyst, and many kinds of biomaterials. Biomaterials based on hydroxyapatite have been applied to dental, orthopedic, and other medical uses8.
Generally, there are three essential methods for preparing crystals, including the process from solid reaction to solid crystals, from solution to solid crystals, and from vapor to solid crystals. Up to the present, the following various methods for preparing hydroxyapatite have been:
1.Wet method, using solution reaction (from solution to solid)
2.Dry method, using solid reaction (from
solid to solid)
3.Hydrothermal method, using hydrothermal
reaction (from solution to solid)
4.Alkoxide method, using hydrolysis
reaction (from solution to solid)
5.Flux method, using fused salt reaction
(from melt to solid)
Table 1 Unit cell parameters for hydroxyapatite10.
axial lengths (nm) angles(degree)
a b c α γ
9.418 9.418 6.884 90 90 120
2
Objectives of the Research
1.Synthesizing biomaterial which analyzed
by X-Ray Diffraction (XRD), Fourier Transform Infrared (FTIR), and Scanning Electron Microscopy (SEM) characterization
2.Observing biomaterial growth which is
implanted by in vivo experiment into sheep’s bone.
Time and Place of Research
This research was conducted from December 2008 through July 2009 which held in IPB-Biophysics Laboratory. The characterization was done in three different laboratory; Balai Penelitian dan Pengembangan Kehutanan Bogor for XRD, Integrated Laboratory - Biofarmaka Bogor Agricultural University for FTIR, and Pusat Penelitian Geologi Laut (PPGL) Bandung for SEM.
THEORY
Hidroxyapatite
Apatite minerals are found in almost all igneous rocks as well as in sedimentary and metamorphic rocks. They are the most abundant phosphorus bearing minerals. The commonest varieties are:
Fluorapatite Ca10(PO4)6F2 Chloroapatite Ca10(PO4)6Cl2 Hydroxyapatite Ca10(PO4)6(OH)2 Podolite Ca10(PO4)6CO3 Dahliite Ca10(PO4 , CO3)6(OH)2 Francolite Ca10(PO4 , CO3)6(F , OH)2
“Apatite” is a general term for crystalline minerals with composition of M10(ZO4)6X2. The name was taken from the Greek word “apato” by Werner which means deceit. Many elements occupy the M, Z, and X sites: M = Ca, Sr, Ba, Cd, Pb, etc.
Z = P, V, As, S, Si, Ge, CO3, etc. X = F, Cl, OH, O, Br, CO3, etc8.
The apatite structure is very hospitable in allowing the substitutions of many other ions.
Ca, PO4, and OH groups in apatite can be
substituted. Carbonate (CO3) can substitute
either for the hydroxyl (OH) or the phosphate
(PO4) group, designated as Type A or Type B
substitution, respectively. The substitutions cause morphological changes in precipitated apatite crystals as well as their properties. For
example, CO3 substituted apatite is more
soluble than CO3 – free synthetic apatite9
“Hydroxyapatite” is a member of the apatite group of minerals, and its chemical formula is Ca10(PO4)6(OH)2. Hydroxyapatite is a calcium phosphate including hydroxide and its Ca/P ratio is represented as 1.678. Hydroxyapatite is a hexagonal crystal with P63/m symmetry and lattice parameters quite similar to aragonite, and has even been hydrothermally converted from biological and geological aragonite10.
Hydroxyapatite is the most commonly used calcium phosphate in the medical field, as it possesses excellent biocompatibility and is osteoconductive9. Hydroxyapatite has been utilized as a fertilizer, a fluorescent substance, an absorbent, a catalyst, and many kinds of biomaterials. Biomaterials based on hydroxyapatite have been applied to dental, orthopedic, and other medical uses8.
Generally, there are three essential methods for preparing crystals, including the process from solid reaction to solid crystals, from solution to solid crystals, and from vapor to solid crystals. Up to the present, the following various methods for preparing hydroxyapatite have been:
1.Wet method, using solution reaction (from solution to solid)
2.Dry method, using solid reaction (from
solid to solid)
3.Hydrothermal method, using hydrothermal
reaction (from solution to solid)
4.Alkoxide method, using hydrolysis
reaction (from solution to solid)
5.Flux method, using fused salt reaction
(from melt to solid)
Table 1 Unit cell parameters for hydroxyapatite10.
axial lengths (nm) angles(degree)
a b c α γ
9.418 9.418 6.884 90 90 120
3
The wet method is useful for preparing very small crystals of hydroxyapatite while the dry method is convenient for preparing well-crystallized hydroxyapatite. The hydrothermal method is used for preparing single crystals of hydroxyapatite. The alkoxide method is used for preparing thin membranes of polycrystalline hydroxyapatite. The flux method is used for preparing large single crystals of apatite compounds. Pure hydroxyapatite has not been prepared by the flux method8.
Tri Calcium Phosphate (TCP)
TCP is a kind of Calcium Phosphate with Ca/P ratio 1.50 and represented as Ca3(PO4)28. TCP has four polymorphs: α, , γ, and super-α. The γ polymorph is a high pressure phase
and the super- α polymorph is observed at
temperature above approximately 15000C.
Therefore, the most frequently observed TCP polymorphs in the field of bioceramics are α and -TCP9.
α-TCP crystal is in the monoclinic space
group P21/a with lattice parameters
a = 1.2887 nm, b = 2.7280 nm, c = 1.5219
nm, and = 126.200. There are 24 formula
units per unit cell. There is a prominent approximate sub cell with a b axis parameter of b/3 (0.909 nm) that contains eight formula units. The structure comprises columns of Ca2+ and PO43- ions parallel to the c axis9.
-TCP has the rhombohedral space group R3c with unit cell a = 1.0439 nm, c = 3.7375 nm (hexagonal setting) with 21 formula units per hexagonal unit cell. The structure of -TCP has been determined and described in
terms of a distortion from the Ba3(VO4)2
structure. The -TCP structure is similar to Ba3(VO4)2 but has three fewer formula units per hexagonal unit cell. -TCP is stable up to
11250C but above this temperature and up to
14300C, α-TCP becomes the stable phase.
Super-α-TCP forms between 14300C and the
melting point at 17560C9.
Compared to -TCP , α-TCP has a lower
density and a higher free energy of formation and therefore it is expected to be more reactive. α-TCP is fairly reactive in aqueous systems and can be hydrolyzed to mixtures of DCPD, calcium-deficient oxyhydroxyapatite, and other calcium phosphates in varying proportions, depending upon the conditions.
-TCP does not form in aqueous systems. Some evidence showed that -TCP is always more soluble than oxyhydroxyapatite, but above pH = 6, it is less soluble than other
calcium phosphate. Moreover, the solubility
of -TCP decreases with increase in
temperature9.
Most of the reports on TCP have concluded that TCP is biodegradable, although there are some differences that is depending on the characteristics of the material used. Due in part to its crystalline structure, the biodegradation rate of TCP has been shown to be much greater than that of HA. TCP has an important role as a resorbable bioceramics due to its high solubility and bioactivity. -TCP has been accepted and used as a biocompatible, resorbable material for bone repair in the form of ceramics blocks, granules, and calcium phosphate cement9.
X-Ray Diffraction (XRD)
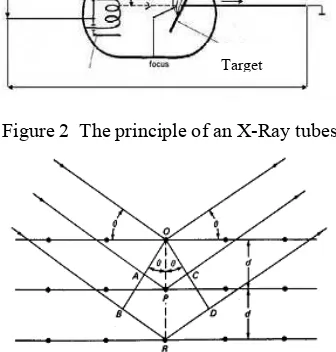
X-ray Diffraction analysis utilizes X-ray emission resulting from collision between electron and target that can be Cr, Fe, Co, Cu, Mo or W. X-ray emission is distributed continuously and specifically for each certain wavelength of target (Figure 2). As side affect, the electron kinetic energy change become heat, so the X-ray quantities influenced by melting point and thermal conductivity of target. This analysis could inform us about the structure of sample, such as crystal system, lattice parameter, and preferred orientation. It is also useful to identify a mixture which is referred to as semi quantitative identification of sample phase.
Figure 2 The principle of an X-Ray tubes.
Figure 3 Diffraction of X-Ray by a crystal. Target
4
Then X-ray is transmitted through sample that will be characterized, so x-ray will be transformed into varied type of energy and absorbed some11.
Interaction of X-rays with sample creates secondary diffracted beams of X-rays related to interplanar spacings in the crystalline powder according to a mathematical relation called Bragg’s Law below, which refers to Figure 3:
n =2 d sin θ
where n is an integer, is the wavelength of
the X-rays, d is the interplanar spacing
generating the diffraction, θ is the diffraction angle. and d are measured in the same units, usually angstroms12.
Scanning Electron Microscope (SEM)
The Scanning Electron Microscope (SEM) has unique capabilities for analyzing surfaces. It is analogous to the reflected light microscope, although different radiation sources serve to produce the required illumination. Whereas the reflected light microscope forms an image from light reflected from a sample surface, the SEM uses electrons for image formation.
The difference between light and scanning electron imaging concerns the depth of field defined as the ability to maintain focus across a held of view regardless of surface roughness. Conventional photographs and photomicrographs are two-dimensional representations; the dimension of depth is suppressed when recording an image with a diffuse light source. In contrast, SEM micrograph maintains the three-dimensional appearance of textured surfaces, a phenomenon due to the high depth of field of scanning instruments. Depth of field is further suppressed in both macrophotography and photomicrography as magnification is increased. At 10x, the relative depth of field of a light microscope is about 250 m, while that of the SEM is about 1000 m; at 1200x the depth of field of a light microscope is ~0.08 m; at 10000x, the depth of field of the SEM is 10 m.
The combination of high resolution, an extensive magnification range, and high depth of field makes the SEM uniquely suited for the study of surfaces. As such, it is an indispensable tool in materials science research and development13.
Figure 4 Schematic of scanning electron microscope experiment.
Figure 5 SEM micrographs of BCP micro particle (a) particle size < 2 m (b) particle size 80-200 m14.
5
In the SEM, the image is formed and displayed by making use of electrons. The column of an SEM contains an electron gun for producing electrons and electromagnetic lenses corresponding to the condenser system. However, these lenses are operated in such a way as to produce a very fine electron beam, which is focused on the surface of the sample.
At any given moment, the sample is bombarded with electrons over a very small area. They may be elastically reflected from the sample or absorbed by the sample and give rise to secondary electrons of very low energy, together with X- rays. They may be absorbed and give rise to the emission of visible light. In addition, they may give rise to electric currents within the sample. All these effects can be used to produce an image. By far the most common, however, is image formation by means of the low-energy secondary electrons11.
Fourier Transform Infrared (FTIR)
Infrared (IR) spectroscopy is one of the most common spectroscopic techniques used by organic and inorganic chemists. Simply, it is the absorption measurement of different IR frequencies by a sample positioned in the path of an IR beam. The main goal of IR spectroscopic analysis is to determine the chemical functional groups in the sample. Different functional groups absorb characteristic frequencies of IR radiation. Using various sampling accessories, IR spectrometers can accept a wide range of sample types such as gases, liquids, and solids. Thus, IR spectroscopy is an important and popular tool for structural elucidation and compound identification.
Figure 6 Schematic illustration of FTIR system.
In simple terms, IR spectra are obtained by detecting changes in transmittance (or absorption) intensity as a function of frequency. Most commercial instruments separate and measure IR radiation using dispersive spectrometers or Fourier transform spectrometers. Fourier transform spectrometers have recently replaced dispersive instruments for most applications due to their superior speed and sensitivity. They have greatly extended the capabilities of infrared spectroscopy and have been applied to many areas that are very difficult or nearly impossible to analyze by dispersive instruments. Instead of viewing each component frequency sequentially, as in a dispersive IR spectrometer, all frequencies are examined simultaneously in Fourier transform infrared (FTIR) spectroscopy15.
Animal used
Animal used in this experiment was sheep. In the period of 1990-2001, sheep were used in 9-12% of orthopedic research involving fractures, osteoporosis, bone-lengthening and osteoarthritis, in comparison with just over 5% in the period from 1980-1989. Most of the literature reports that the dog is more suitable as a model for human bone from a biological standpoint than the sheep; however, adult sheep offer the advantage of being of a more similar body weight to humans and having long bones of dimensions suitable for the implantation of human implants and prostheses, which is not possible in smaller species such as rabbits or smaller breeds of dog5.
While macroscopically, sheep’s bones relatively similar to the human bones, histologically, the bone structure of the sheep is quite different. Sheep are described as having a predominantly primary bone structure (osteons less than 100µm diameter containing at least two central blood vessels and the absence of a cement line) in comparison with the largely secondary bone of humans5.
6
(a weight-bearing model), show that sheep and humans have a similar pattern of bone in-growth into porous implants over time5.
MATERIALS AND METHODS
Materials and Equipments
The materials used in this research are
pro-analyze Na2HPO4.2H2O, pro-analyze
CaCl2.2H2O, nitrogen (N2), aquadest, and aquabidest. While the equipments are beaker glass, mortar, aluminum foil, whatman paper, Mohr pipette, magnetic stirrer, hotplate, analytical scales, furnace, digital thermometer, and press machine.
Materials and equipments used for in vivo experiment are sheep as animal model, minor surgery set, orthopedic surgery tools, anesthetic material, and surgery room for aseptical implantation.
Methods
Preparation and characterization of Biphasic Calcium Phosphate (BCP) ceramics
Table 2 Various concentrations of starting solutions
Code
CaCl2.2H2O
M
Na2HPO4.2H2O
M
A 0.2 0.2
B 0.334 0.2
Starting materials used in this research were analytical grade CaCl2.2H2O as Calcium (Ca) source and Na2HPO4.2H2O as Phosphor (P) source with Ca/P ratio 1.67. BCP was synthesized by reacting 100 ml of
CaCl2.2H2O solution and 100 ml of
Na2HPO4.2H2O solution using a precipitation
method. In this process, Na2HPO4.2H2O
solution was put into the beaker glass and CaCl2.2H2O solution was put in the burette and added drop by drop to the solution in beaker glass. Before reacting these solution,
Na2HPO4.2H2O solution was added with
nitrogen gases at least 3 minutes then stirred up to 700C. After reaching that temperature, precipitation was done with constant temperature on hot plate. The result was precipitated for ± 12 hours then filtered and heated up to 10000C for 10 hours. The result of this process was powder of biphasic ceramics containing a mixture of HA and
TCP. Then, this powder was analyzed using
X-Ray Diffraction with a CuKα source
operated at 40 kV and 30mA. The microstructure and particle size distribution of the sample were observed by Scanning Electron Microscopy. The sample was also characterized using FTIR for observing the chemical functional groups of the sample. After characterization, this powder was pressed in form pellet using press machine. Then, it was coated with bone cement and heated up to 150oC for two hours.
In vivo study in sheep
Six two years old sheep, 18-24 kg in weight, were used in the study. All experiments were conducted with strict observation of institutional guidelines for the care and use of laboratory animals. Prior to surgery the sheep were observed closely for 2 weeks in order to check their health status. They were maintained under identical environment, management and standard diet
with ad libitum supply of drinking water.
Sheep’s maintenance was done for ten days pre surgery for evaluation of animal used condition before experimentation. Sheep’s maintenance was done in stall of animal used of FVM Bogor Agricultural University.
The sheep were anaesthetized by intravenous injection of xylazin 2%. Before the operation, bone grafts were sterilized by exposure to ultraviolet light. Under aseptical conditions, right os tibia of each sheep was drilled to create a segmental defect with a critical size defect of 6 mm in diameter. This segmental defect then implanted with bone graft prepared before. As control requirement, left os tibia of each sheep was drilled in the same manner and diameter with the right os tibia without implantation of the bone graft. Each biomaterial implantation was performed under same veterinary surgeon.
7
RESULTS AND DISCUSSION
Formation of Biphasic Calcium Phosphate Ceramics with Various Concentrations
Biphasic Calcium Phosphate (BCP) ceramics was resulted by precipitation of
precursor materials Na2HPO4.2H2O which
dropped by CaCl2.2H2O with Ca/P ratio of
1.67. Molarity ratio variations of Ca and P were 0.2 M : 0.2 M and 0.334 M : 0.2 M. Result of this method was powder with mass of sample A and sample B was 0.8841 gram and 1.3162 gram, respectively. Sample with greater molarity of Ca was resulting in bigger mass precipitate. It showed that higher molarity of Ca : P tends to be more mass precipitate.
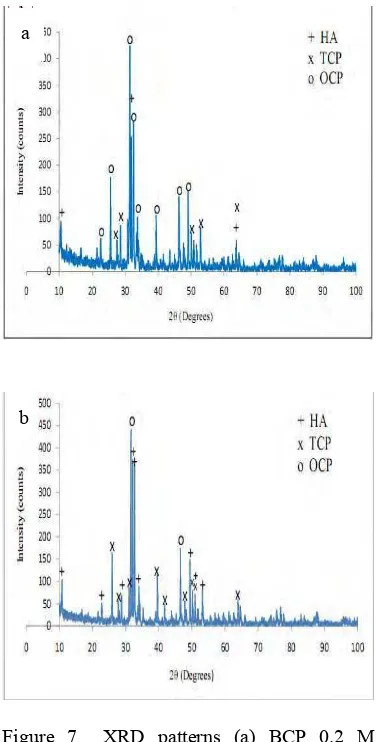
Different molarity ratio was resulting in different XRD pattern. As shown in Figure 7, the XRD pattern of sample A and sample B was different. XRD pattern of sample A showed that the majority of precipitate correspond to Octacalcium Phosphate (JCPDS 44-0778) whereas XRD pattern of sample B correspond to Hydroxyapatite (JCPDS 0432) and Tricalcium Phosphate (JCPDS 09-0169) although the highest peak of this XRD pattern correspond to Octacalcium Phosphate. In summary, sample B was more suitable than sample A for bone implantation because of the characteristics similarly with BCP containing HA and TCP.
Table 3 Sample Code
Sample Code
BCP 50 ml B1-1
B1-2
BCP 100 ml B2-1
B2-2
Table 4 Mass of precipitates
Sample Mass (gram)
[image:31.595.322.511.82.453.2]B1-1 0.8748 B1-2 0.8528 B2-1 1.7908 B2-2 1.9292
Figure 7 XRD patterns (a) BCP 0.2 M (b) BCP 0.334 M.
Optimizing and Characterization of BCP Ceramics with Various Volumes
Optimizing of BCP was done in order to get higher mass of BCP ceramics for sheep’s bone implantation. Molarity ratio of Ca and P was 0.334 M : 0.2 M based on the optimum result in Figure 7. BCP ceramics was obtained by reacting 50 ml CaCl2.2H2O solution and 50
ml Na2HPO4.2H2O solution. On the other
hand, it was obtained by reacting 100 ml
CaCl2.2H2O solution and 100 ml
Na2HPO4.2H2O solution. Each sample with
various volumes of starting solutions was done duplo which shown in Table 3.
a
8
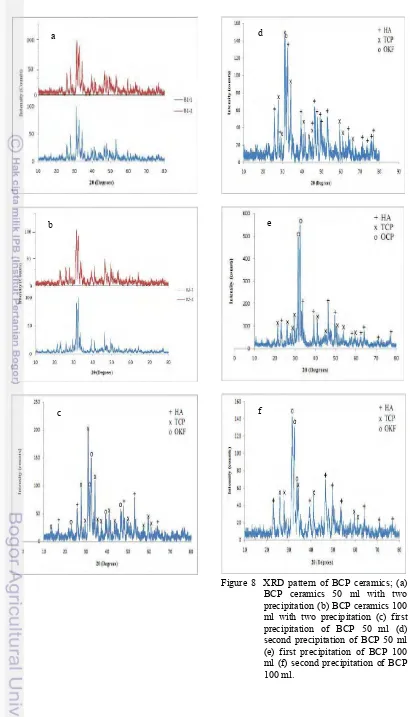
[image:32.595.102.512.69.786.2]
Figure 8 XRD pattern of BCP ceramics; (a) BCP ceramics 50 ml with two precipitation (b) BCP ceramics 100 ml with two precipitation (c) first precipitation of BCP 50 ml (d) second precipitation of BCP 50 ml (e) first precipitation of BCP 100 ml (f) second precipitation of BCP 100 ml.
a
b
c
d
e
9
Table 5 Lattice parameters of BCP samples
Sample Code HA
a (Å) c (Å)
BCP 50 ml B1-1 9.295 6.797
B1-2 9.443 6.863
BCP 100 ml B2-1 9.385 6.804
B2-2 9.648 7.006
Sample Code TCP
a (Å) c (Å)
BCP 50 ml B1-1 10.395 37.217
B1-2 10.465 37.398
BCP 100 ml B2-1 10.172 36.161
B2-2 10.324 36.913
XRD patterns in Figure 8 showed the difference pattern of difference volume. BCP 50 ml volume was resulting in different XRD pattern of two precipitation which can be seen in Figure 8a. It was seen from the pattern and each three highest peaks of two samples. The result of each sample was different because a little volume of solution need more carefulness and has more error factor. On the contrary, BCP 100 ml volume almost had same pattern of two samples shown in Figure 8b. Even though three highest peaks of each sample were different but the characteristic and phases of XRD pattern were almost same. The difference was the intensity of each peak. In short, BCP 50 ml volume was not reproducible ceramics known from different pattern of two samples whereas BCP 100 ml volume can be assumed as reproducible ceramics which shown by same pattern and phases. Therefore, BCP ceramics used for sheep’s bone implantation was BCP 100 ml volume.
Detailed graph of each sample was shown in Figures 8c, 8d, 8e, and 8f. Figures 8c and 8d were XRD pattern of BCP 50 ml volume; on the other hand, Figures 8e and 8f were BCP 100 ml volume. As shown in Figure 8c, the majority of precipitate was TCP but in this precipitate OCP was more dominant than HA. Nevertheless, the aim of this research was synthesizing BCP (Biphasic Calcium Phosphate). Figure 8d showed different pattern with 8c even though the procedure and volume of solutions were same. In Figure 8d, the majority of precipitate was TCP and HA but OCP still exist. Actually the characteristics of XRD pattern of this sample
were suitable to the expected characteristics of constituent phases but it can not use for implantation because there were no consistency of each precipitation result. Moreover, Figures 8e and 8f also showed XRD pattern that suitable to the expected characteristics of constituent phases whereas the highest peak was OCP. Small amount of TCP and the existence of OCP as the majority phase of the samples were caused by temperature heating on BCP formation which less than 1050oC16,17. This agrees with other report in which it is reported that Ca-deficient HA can transform to TCP at temperature
above 800oC. Despite of that, TCP was
considered as a poor sinterable phase because the only small variation of TCP content and eventual grain growth at temperatures ranging
from 1250 to 13500C18. However, the
existence of OCP did not matter for ceramics used for implantation because synthetic OCP showed its osteoconductive characteristics in the bone marrow space such as enhance bone regeneration at the initial bone apposition stage and stimulate resorption of the newly formed bone. In addition, biodegrade rate of synthetic OCP is faster than -TCP ceramics and OCP enhance bone formation more than HA and -TCP ceramics when implanted in rat calvaria19.
The lattice parameters of the synthesized Biphasic Calcium Phosphate samples were obtained from the diffraction pattern by fitting the peaks of identified reflections. The determined hexagonal lattice parameters of BCP samples were shown in Table 5.
Previous report clearly demonstrated that infrared spectroscopy is an indispensable tool in order to learn some special features of the preparation of calcium hydroxyapatite
ceramics20. Therefore, Fourier Transform
Infrared characterization was carried out for BCP samples to study the spectral characteristics which indicated the chemical bonding. The FTIR spectra of BCP samples either BCP 50 ml volume or BCP 100 ml volume shown in Figure 9. The IR results obtained were completely consistent with crystallization process observed by XRD measurements.
These spectra indicates the formation of a
typical HA structure containing PO43- band
and OH- band, TCP structure containing PO4
3-band, and OCP structure containing HPO4
10
difference of BCP 50 ml spectra and BCP 100 ml spectra was the sharpness of the spectra. BCP 50ml spectra was sharper than BCP 100 ml but the chemical bonding of those sample were same. The first indication for hydroxyapatite formation of B1-1 and B1-2 were in the form of broad IR band centered at
about 1007-1119 cm-1 which arise due to
factor group splitting of the stretching
asymmetry vibration ( 3) fundamental
vibration mode of the PO43- band19. The bands of B1-1 and B1-2 at ~ 432 cm-1 and at ~ 563-605 cm-1 correspond to bending vibration ( 2) and bending asymmetry vibration ( 4) of the PO43- ion, respectively20,21. Moreover, the
characteristic bands of PO43- for TCP
formation was in the form of broad IR band
around 600 cm-1 wavenumber22 and OCP
formation was in the form of HPO42- band at
979 cm-1 for B1-1 and 980 cm-1 for B1-2.
While the band assigned to the stretching
modes of hydroxyl groups (OH-) in the
hydroxyapatite of B1-1 and B1-2 at 3432 cm-1 and 3435 cm-1 , respectively.
B2-1 and B2-2 also had same chemical bonding with B1-1 and B1-2. The indication for hydroxyapatite formation was in the same range of B1-1 and B1-2 which was at about 1008-1117 cm-1 correspond to 3 fundamental
vibration mode of the PO43-. The bands of
B2-1 at ~ 432-469 cm-1 and at ~ 566-605 cm-1 correspond to 2 and 4 of the PO43- ion, respectively. Despite of that, the bands of B2-2 correspond to 2 and 4 of the PO43- ion at ~ 431-471 cm-1 and at ~564-604 cm-1. There was overlapping at PO43- band around
600 cm-1 with TCP formation and OCP
formation of B2-1 and B2-2 was in the form of HPO42- band at 981 cm-1 and 980 cm-1 respectively. While the band assigned to the stretching modes of hydroxyl groups (OH-) in the hydroxyapatite of B2-1 and B2-2 at 3437 cm-1 and 3435 cm-1 , respectively.
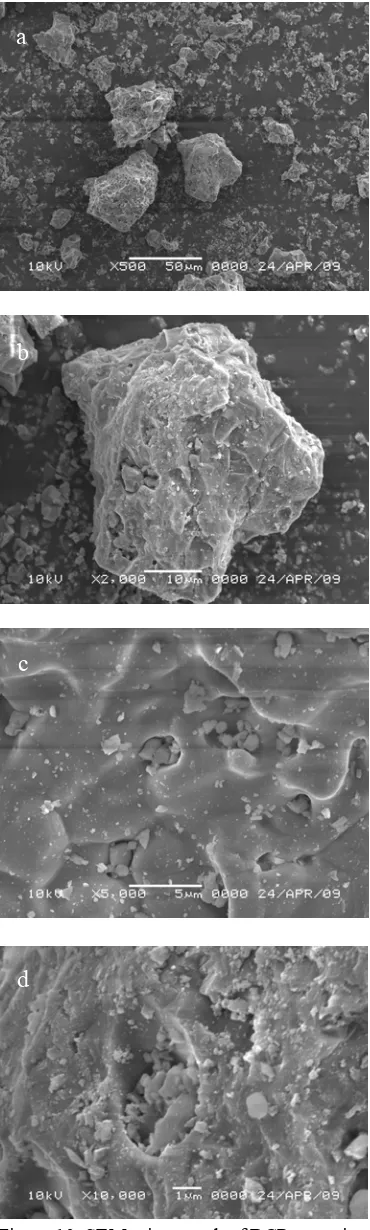
[image:34.595.324.509.84.699.2]Figure 9 FTIR spectra of BCP ceramics
Figure 10 SEM micrograph of BCP ceramics; (a) Magnification 500x (b) Magnification 2000x (c) Magnification 5000x (d) Magnification 10000x
a
b
c
11
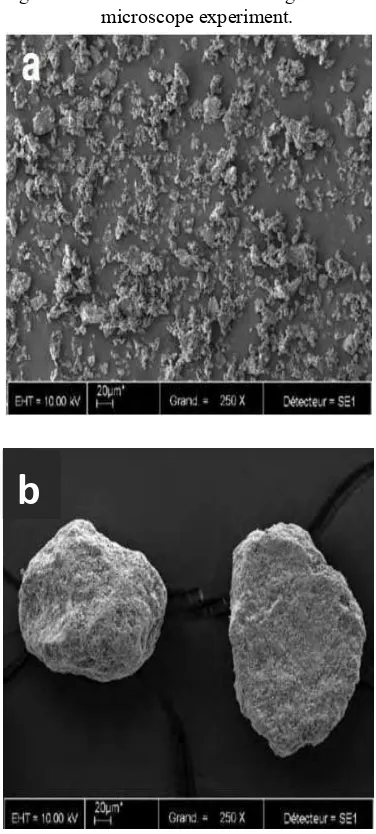
Morphology of BCP 100 ml ceramics was investigated by Scanning Electron Microscopy, from which the grain size and typical morphologies of BCP could be obtained. The morphological features of the sample were given in the SEM pictures of Figure 10. Figure 10 showed the SEM micrograph of BCP ceramics which was composed of agglomerates of broad size distribution. A representative of scanning electron microscopy of BCP sample in Figure 10a showed that BCP ceramics was formed. As seen, agglomerates like a big ball densely shown formation of BCP and a huge amount of small ball surround a big ball was
hydoxyapatite14. The form of BCP ceramics
was shown clearly in Figure 10b. On the other hand, Figure 10d showed the formation of OCP shown with aggregates consisting of small plate-like particle on the surface of sample19.
Formation and Optimizing of HA-Chitosan
HA-Chitosan bone graft used for sheep’s bone implantation was done by Ai Nurlaela. This bone graft was resulted by precipitation method with Ca/P molar ratio of 0.5M:0.3M. The Ca source was obtained from hen’s
eggshell which heated up to 10000C for 5
hours and P source was obtained from
KH2PO4. The precipitation was done with
370C temperature and pH 10. Based on the
research, the highest efficiency value was resulted from sample with addition of chitosan as much as 20%. Even though the addition of chitosan in crystalline apatite caused changing of composite’s color which was more yellowness than crystalline apatite but addition of chitosan 20% did not cause color changing at least for three months storage. Therefore, composite used for sheep’s bone implantation was HA-Chitosan 20% because it was the optimum result. It was shown from mixing of chitosan with apatite completely and all of chitosan bonded with apatite. Despite of that, the precipitate was completely separated in this precipitation and mass of composite was the highest among all samples.
The XRD result showed that the composite corresponds to HA and Apatite Carbonate type-B. The pattern of this composite was almost same to that of adult man’s os tibia. The difference was in width of FWHM which possibly caused by organic component of chitosan. In contrast, XRD pattern of os tibia was resulted from sample
which was heated up to 1100C for leaving out its organic component23.
In Vivo Evaluation
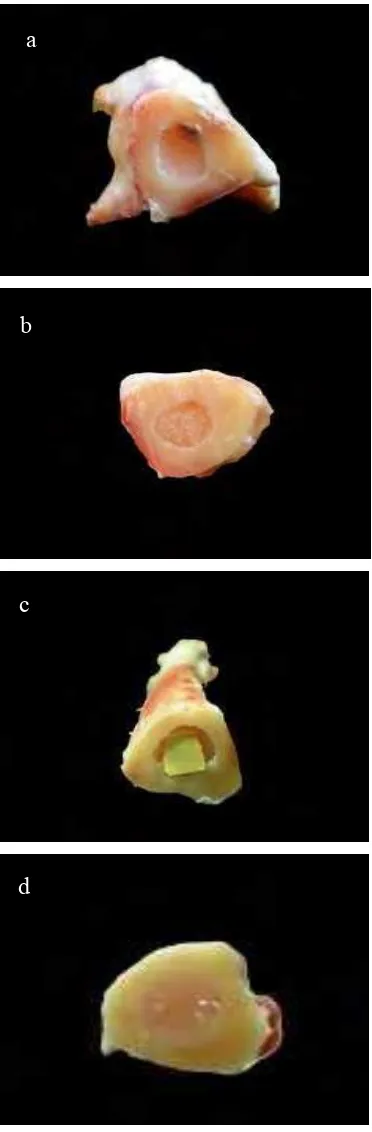
In vivo evaluation was done for observing bone grafts remodeling and its characteristics when implanted into sheep’s bone. Bone grafts used in this evaluation were Biphasic Calcium Phosphate (BCP) ceramics and HA-chitosan composite. This research in In Vivo evaluation was performed cooperatively with team of veterinarians and students in Faculty of Veterinary Medicine Bogor Agricultural University. Detailed results were presented by FVM team. Based on pathological observation from bone specimen harvested on day 90 PI, the results indicated that BCP ceramics was more biodegradable and bioresorbable than HA-Chitosan composite. Nevertheless, osteoconductive process using HA-Chitosan bone graft and control was more complete than that using BCP bone graft.
As seen on Figure 11, on the day 90 PI BCP ceramics seemed to be dissolved with smaller size and showed unintact implant remnant. The unintact implant remnant of BCP ceramics showed the slow osteoconductive process which was probably caused by coating with bone cement. On the other hand HA-Chitosan composite seemed to be intact with the same size as pre-implantation condition. It showed that there was no significant resorption of HA-Chitosan composite.
There was no difference on bone recovery between control sample and HA-Chitosan implanted bone. Nevertheless, it was suggested that HA-Chitosan bone graft which pushed inside bone marrow was caused by bone recovery process. On the other hand, bone recovery inside BCP ceramics seemed to be incomplete because there was still BCP ceramics remnant on the implanted bone.
12
resorption of HA-Chitosan composite caused by high percentage of chitosan on HA-Chitosan composite. In addition, HA have disadvantages i.e., it shows almost no absorption and remains in the body for a long time as a foreign substance16.
Based on these results, the bone grafts did not conform to the requirements of biodegradable and osteoconductive biomaterial as bone substitute. Therefore, modification on biomaterial is required for further studies on bone implantation such as porous biomaterial. Pores of various sizes in the implant and even in the individual granules are required for the biomaterials to interact with the physiological medium in the organism. The porous structure favors ion exchange and intergrowth with binding bone tissue, as well as the penetration of blood-bearing vessels and cells, which provide bone precursors in the implant17. The presence of pores was a major factor in the transfer of
ceramics particles to body fluids16 and the
resorption rate, i.e., the solubility in the physiological medium is also dependent on the pore structure characteristics (total number of pores, size distribution, proportions of open and closed pores)17.
There was research showed that the purity of -TCP also influences bone formation and biocompatibility. Highly pure porous -TCP as a scaffold for bone tissue engineering with average pore size is 200–400 m in diameter and almost all pores are interconnected via a 100-200 m path24. The small particle size and interconnected sponge-like micro porosity are believed to improved osteoconductive properties and promote timely resorption concomitant with the process of modelling25. Furthermore, the porous -TCP has large interconnecting paths similar to that of cancellous bone which makes it easier for blood vessels and cells to invade the center of the block. The blood supply may lead further to the proceeding of bone formation in porous
TCP24. Despite of that, cellular pathway
[image:36.595.323.509.83.649.2]resorbs TCP leaving newly formed bone tissue, but due to the lack of osteoinduction, ceramics alone required longer periods for completion of the fusion process than autogenous bone graft. A canine study has demonstrated that implants of ultra porous -TCP were resorbed and replaced with new bone in 6-12 weeks25.
Figure 11 Cross section of sheep’s bone on day 90 PI (a) using BCP bone graft (b) control (c) using HA-chitosan bone graft (d) control.
a
13
CONCLUSIONS AND SUGGESTION
Biphasic Calcium Phosphate (BCP) seemed to be a great potential bone substitute in biomedical fields. Based on the results obtained in this study, sample B with ratio molarity Ca/P of 0.334 M:0.2 M was suitable for bone implantation because of its characteristics of BCP ceramics. Sample B2 which is BCP 100 ml volume can be assumed as reproducible ceramics shown from XRD pattern which suitable to the expected characteristics of material bone graft.
In vivo evaluation of BCP was done for observing biodegradability, bioresorbability, and osteoconductivity of sample which implanted into sheep’s bone. Based on pathological evaluation, the results indicated that BCP ceramics was biodegradable and bioresorbable but less osteoconductive. In contrary, HA-chitosan was not biodegradable and bioresorbable but more osteoconductive. Moreover, bone recovery without bone graft (control sample) was more complete than that with HA-Chitosan and BCP bone grafts. Despite of that, the bone grafts did not conform to the requirements of the biomaterial prior to clinical used.
Therefore, advanced research was required for synthesizing ceramics consisting of mineral and matrix as apatite growth or making a porous ceramics or composite to stimulate osteoblasts coming into bone graft material. In vivo evaluation was also required for observing the influence of bone graft to the bone recovery with longer observing time.
REFERENCES
1. Sunho Oh. Bioceramics for Tissue
Engineering Applications – A review.
Biochemistry and Biotechnology. 2006; 2: 49-56.
2. Holtorf HL. Flow Perfusion Culture of
Marrow Stromal Cells Seeded on Porous Biphasic Calcium Phosphate Ceramics.
Biomedical Engineering. 2005; 33: 1238-1248.
3. Costa HS. Morphological, mechanical, and
biocompatibility characterization of macroporous alumina scaffolds coated
with calcium phosphate/PVA. Material
Science. 2008; 43: 510-524.
4. del Valle S. in vivo evaluation of an
injectable Macroporous Calcium
Phosphate Cement. Material Science.
2007; 18: 353-361.
5. Rohanizadeh R. Ultrastructural Study of
Apatite Precipitation in Implanted Calcium Phosphate Ceramics: Influence of the Implantation Site. Calcified Tissue International. 1999; 64: 430-436.
6. Al Pearce. Animal Models for Implant
Biomaterial Research in Bone: A Review.
European Cells and Materials. 2007; 13: 1-10.
7. Landi E. Biomimetic Mg-substituted
hydroxyapatite: from synthesis to in vivo
behavior. Material Science. 2008;19 :
239-247.
8. Aoki H. Science and Medical Applications
of Hydroxyapatite. Tokyo: Institute for Medical and Dental Engineering, Tokyo Medical and Dental University; 1991.
9. Shi D. Biomaterial and Tissue
Engineering. Germany: Department of Chemical and Material