THE IMPLEMENTATION OF TRIPLE HELIX
MODEL FOR LOCAL ECONOMIC DEVELOPMENT
IN YOGYAKARTA PROVINCE
Sukidin and PudjoSuharso
1Abstract: In line with the principle of regional autonomy which implemented in 2001, the Central Government of the Republic of Indonesia encourages each region to be able to develop the local economy in accordance with its potential. In drawing up the strategy of regional economic development in the DIY province, two basic principles of regional economic development in the DIY province should be noted that Find-Recognize (menemu-kenali) regional economic and regional development management to formulate pro-business. The purpose of this study is drafting the Regional Economic Development Strategy which is based on the implementation of the Triple Helix model, which requires coordination, synergy and collaboration between government, private (business) and society (academics). The method used is a qualitative approach, combined with a quantitative approach. The analysis focused on the development of GDP and investment in the DIY province, Provincial sectoral economic development in DIY province, income distribution, poverty, cooperation elements of the triple helix of economic development, and internal and external environment. As a result, during (2013-2014) economic performance which demonstrated in GDP and budgeting in Sleman and Yogyakarta city beyond the average DIY province. Sectoral conditions in the economy of DIY Province were analyzed by using the Shift-Share (SS). Based on years of 2013-2014 GDP DIY province known construction, excavation and agriculture is relatively more competitive than six other sectors. Income distribution is analyzed through igures Gini ratio, the size of the imbalance according to World Bank criteria, and Williamson Index, in the year 2013 - 2014, shows a similar patern, where the distribution of income in the province tend to be more evenly distributed. By using the analysis of the poverty gap index (poverty gap index, P1) and poverty severity index (poverty severity index, P2) the gap between the average standard of living of the population is under the poverty line to the poverty line and the gap between the poor is relatively low. In terms of economic development cooperation, collaboration, synergy and coordination among regions run optimally and cooperation between elements of the Triple Helix done well. Support famous colleges and scatered in the province, giving depth academic analysis contribution in designing local economic development in DIY.
With the national economic growth rate of 6.0%, external economic conditions (economic Indonesia) suicient to provide support for local economic development of DIY Province. Keywords: local economic development, the model of the triple helix, economic development strategies.
THE PROBLEM BACKGROUND
Regional autonomy is implemented per January 1, 2001 has given a greater role to the government and economic actors in the region to address regional development. Therefore, the implementation of regional autonomy is the right moment to give a greater role to the government and economic actors in the region to address regional development.
The purpose of regional development is to improve the welfare and reduce poverty. The achievement of prosperity and poverty reduction in the region is done through policy-based economic development in the region. Economic development in the region is done by the implementation of iscal decentralization for eiciency, increase economic growth, and economic development lolal (Fuad, 2005: 245; Musgrave and Musgrave, 1991: 7; Arsyad, 2004: 64).
In iscal decentralization, whatever the form of government of a country, either federal or unitary state, will always bring up the patern of inter-governmental iscal relations (iscal intergovernmental relationship). Fuad (2005: 27), found that there are two models of inter-governmental iscal relations that prevail today, namely iscal federalism (iscal federalism) and the federal inance (federal inance). In the model of iscal federalism, the power concentration at the center is so high. In this perspective, the appropriate framework for decentralization is top down and paterned deconcentration or delegation maximally, and the appropriate analytical framework is agency theory. The implications of the iscal relationship model of iscal federalism are various forms of transfers from central government to local governments (provincial and district / city) in order to promote regional autonomy and to improve local infrastructure, normally will be spent by local governments in accordance with the guidelines and sectors which have been set by the central government.
Raw economic dimension of a public inance policy are macroeconomic stability, fairness (equity), and eiciency (Musgrave and Musgrave, 1991: 7). The aspect of eiciency is the raison d’etre for iscal decentralization. Because each individual preferences for diferent public goods, then in a decentralized iscal system, each individual may choose to live in a community or society according to their preferences in order to maximize social welfare.
can allocate resources (resources) more eiciently than the central government. This iscal decentralization will give local governments the opportunity to make government spending in an efort to move the economy in the area of eicient and to avoid wasting.
Empirical research on decentralization and macroeconomic management provide litle support that decentralization inherent to economic stability. Recent studies on the relationship between iscal decentralization with macro-economic management found that iscal decentralization system ofers greater potential improvements to the improvement of macro-economic management than centralized iscal system. In fact, federal countries which are decentralized high as Swizerland, Germany, Austria, and the United States have a macro-economic performance is very stable and low inlation. (Arsyad, 2004; Hall, 2000).
Sidik (2013) states that the successful implementation of decentralization will depend on the design, implementation process, political support both at the level of decision-making at each level of government, and society, the readiness of the government administration, institutional development and human resources, coordination mechanisms for improving the performance of the bureaucratic apparatus,changes in value systems and behavior of the bureaucracy to meet the wishes of the people, especially in the public sector services. In addition, Sidik (2013) also argued in support of the implementation of decentralization, local governments must be supported by inancial resources are adequate, whether from local revenue, loans, and transfers from the central government. Implementation of iscal decentralization will run well when central government is capable of doing surveillance and enforcement, and there is a balance between accountability and authority in conducting taxes and levies.
On the other hand the economic development of the area will develop if economic growth is high. In the perspective of the classical theory (Arsyad, 2004), high economic growth will be achieved when the economy is in a state of full processing (full employment) and capital goods consisting in society is used fully, consists of two sectors, the household sector and the companies sector means the government and the foreign trade does not exist, the amount of private savings is proportional to the magnitude of national income means saving function starts from zero, as well as the propensity to save (the marginal propensity to save = MPS) as well as the amount of ixed capital-output ratio (capital- output ratio = COR) and the capital-output ratio of gain (incremental capital-output ratio = ICOR).
relationship between the COR with a growth rate of output is negative (greater COR, the lower the growth rate of output). The economic logic of the equation is very simple. If you want to grow, the economy should save and invest a certain proportion of its total output. The more savings and invest, the faster the economy will grow. But the real economic growth rate actually depends on the productivity of investment. (Badarudin, 2012).
Emil and Feser (1999) said that local economic development is more successful when it is done by building the local economy (local economic development). Regional economic development strategy involving various fundamental understanding of the potential and opportunities of the region and is associated with an increased capacity of local government oicials, legislators, businessmen, and residents of the area in general (Ariin, 2005). The potential of local leadership and managerial capabilities of a leader in the bureaucracy, parliament, and the business community in the area until the readiness of the stakeholders to implement regional development became a dominant factor in the performance of regional economic development. In the context of economic decentralization, local economic development is a necessity because it was diicult to be expected merely an economic development can be compatible with the needs and potential of the region if it is too thick shades centralized (Hirawan, 2007: 3).
To support the demands of eiciency and economic of scale in the context of decentralization, it is necessary a major prerequisite that must be met, namely the organization of an eicient state anyway. In other words, the economic development of the region also requires clean and authoritative governance (GCG), both at central and local levels that are capable of running an economic policy eiciently. Therefore, the selection and application of a regional economic development strategy being so crucial in the context of economic decentralization and regional autonomy as it is now.
commitment to increase the education budget to 20% of the state budget should be addressed university academics to improve the quality of education as well as contribute to regional development. University academics are expected to be able to play their part in solving the problems faced by local governments such as economic and social problems of society. Local governments are required to give more leeway and ease bureaucracy, regulation, and policy in the economic system, so that businesses can run their business optimally. Instead, businesses are also expected to be able to take part as a business person who upholds the ethics of business and its corporate responsibility.
RESEARCH METHODS
Types and Sources of Data
The type of data used is discrete data and continuous data sourced from secondary data obtained and collected from textbooks and various reports / books / compact disc published by the relevant agencies, such as the Secretariat of State; Ministry Of Finance; Ministry Of Internal Afairs; Secretariat Provincial Government and Regency / City; and the Central Bureau of Statistics (BPS) Central, Provincial and District / City. Studies support articles collected through the website in the form of reference of periodicals, books, papers, scientiic journals and reports.
Instruments Used
The instrument used in this study is a questionnaire in the form of working papers distributed in the Focus Group Discussion (FGD). In the FGD will be discussed topics and for each topic of discussion will be distributed paperwork. Working paper serves as an instrument and will be collected after the participants to put what happened in the discussion: what do the proposed, how the response of other participants on these opinions, and notes the researcher.
Data Collection Technique
The data collecting method used in this research is the study of literature, observation and interviews and focus group discussions.
Data Analysis Techniques
RESULTS AND DISCUSSION
Analysis of GDP and investment in the province
During the period of 2 years (2013-2014), economic performance in Sleman and Yogyakarta City topped the average in DIY. These conditions indicate that the two regions are supporting the economy in the province. Bantul economic performance is nearly equal to the average of Yogyakarta Province, while economic performance in Kulon Progo Regency or Gunung Kidul still below the average in DIY province. The conditions during this period did not last a shift, meaning there is no district / city to surpass other regions. Viewed from the side the ability of the region, the diference between the value of GDP district / city is very dependent on natural resources and human resources that are owned and supported by the available technology. Gunungkidul with an area of nearly one-third of Yogyakarta Province, turned out in 2012 only ranks fourth in terms of the amount of the value of GDP is generated. This is due to the economy Gunungkidul still supported by the agricultural sector, while the agricultural land in the area is relatively barren with low productivity. Meanwhile, the city of Yogyakarta with the smallest area but with the amount of economic activity in every sector and supported by the infrastructure and technology that more adequately able to achieve greater value of GDP (irst order).
Table 1
PDRB Yogyakarta Sleman KulonProgo Gunung Kidul Bantul
2013 14,08 14,78 13,67 12,92 15,73
2014 8,00 9,24 8,17 11,67 8,94
Business ield which contributes to the formation of GDP in each district / city diferent from each other. In the city of Yogyakarta main service sector contributes the formation of GDP (24.52%), while in Sleman is a business hotel and restaurant sector (22.82%), Bantul agriculture sector (20.84%), Kulon Progo agricultural sector (24.11%) and Gunung Kidul agricultural sector accounted for the formation of GDP amounted to 34.24%. For the business sector that contributes litle in formation of GDP is the sector of mining and quarrying sector enterprises Gas, electricity and water. For all districts / cities both the business sector only contributed formation of GDP is less than 2%.
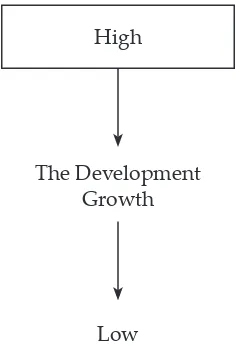
economy and would be faster progress because they have an economic growth rate and GDP per capita is relatively high compared with the average DIY. District / city located in quadrant IV is advanced but depressed regions in absolute terms the economy has reached a high level but the rate of growth relatively low compared to the average DIY.
Figure 1: Klassen Typology Regency / City in the province of Yogyakarta Special Region
High
Low
The Development Growth
Source: BPS DIY, the data is processed.
In terms of investment, most spatially accumulated during the period 2013-2014 occurred in the city of Yogyakarta with a value of more than Rp2 trillions. Followed by Sleman (> 1.2 trillion), Bantul, Gunung Kidul, and Kulonprogo. The three districts of the investment value for each ranging about under 200 billion. In 2013, the highest investment growth occurred in Bantul, which increased by 11.5% than the previous year. However, the largest share in overall investment growth (3.49%) given by Sleman which grew by 5.76%, followed by investment growth of Yogyakarta, which reached 1.03%.
also sufered setbacks. As shown on the indicator of Gross Domestic Investment (GDI) OF 34.08 that go beyond Gross Domestic Saving (GDS) since the year 2013, amounting to 33.79. This is an indication that it is important to get the atention of all parties to build the DIY economy. To address the need for such investment needs to be increased eforts to absorb foreign investment in DIY, either outside the province or abroad. This can be achieved if the investment climate in the province more atractive in comparison to other areas.
Sectoral Economic Analysis
Sectoral conditions in the economy of DIY Province were analyzed by using the Shift-Share (SS), Static Location Quotient (SLQ), and Dynamic Location Quotient (DLQ). Shift-Share Analysis (SS) is used to determine the performance or productivity of the economy compared with the economies in the region the wider region / country. Shift-share analysis results based GDP DIY Province in 2013-2014 can be seen that the construction sector, quarrying and agriculture is relatively more competitive than six other sectors. In a more detailed economic analysis of sectoral value DIY Province as follows:
Table 2
Shif-share Value, SLQ and DLQ PDRB DIY Province, year 2013-2014
Bussiness Field Shift-share (SS) SLQ DLQ
Agriculture 2,30 1,28 1,03
Excavation -09,33 0,08 0,65
Processing industry -304,25 1,23 0,68
Electricity and water -11,12 0,95 0,81
Construction 130,66 1,37 1,40
Trade, hotel, restaurant -341,01 1,43 0,75
Transport and communications -529,05 1,66 0,41
Finance, real estate and business services -120,02 1,03 0,79
Services -311,25 1,89 0,71
Source: BPS DIY, Year 2003-2009.
sector so it can be interpreted that these two sectors are relatively less plays a role in the economy of Yogyakarta Province, while other sectors have a positive role. DLQ analysis results indicated that nlai DLQ on one produced by agriculture and construction, which means the potential for the development of the sector is beter than the same sectors at the national level. Incorporation of the results of the analysis of SLQ and DLQ can produce grouping sectors in the economy of DIY Province into four categories, namely seed, prospective, mainstay, and less promising. Agriculture and construction sectors are leading sectors. There are ive sectors that include prospective namely electricity and water sector; trade, hotels and restaurants; transport and communications; inance, leasing, and business services; and services.
SLQ DLQ
> 1 < 1
Leading Sector : Agriculture Construction
Prospective sector : Processing Industry
Trade, Hotel and Restaurant Transport and Communication
Finance, real estate and business services Services
Mainstay: Less Prospective : Electricity and Water
Source: Results Analysis
Meanwhile, the result of economic calculations based typology of DIY Province Klasen obtained the following results:
1. The prime sector: trade, hotels and restaurants
2. Potential sectors: agriculture; processing industry; and services
3. Sector thrives / grows: electricity and clean water; construction; transport and communications; and inancial services, leasing and corporate services 4. Sector backward / less potential: excavation.
Income Distribution
similar patern, where the distribution of income in the province tend to be more evenly distributed. However, Williamson index value does not show exactly the same patern. Gini ratio value (RG) ranging between 0-1. The closer to 1 means that income inequality among the population widened. If inequality is geting close to 0 means that the distribution of income among the population more evenly. Referring to the three levels according to Oshima RG value, then the value of RG DIY Province which is in the range from 0.3 to 0.5 indicates that the level of inequality in the region including the medium or moderate. In other words, equal distribution of incomes of the population in the province that includes the city of Yogyakarta, Sleman, Bantul, Kulon Progo and Gunung Kidul shows the level of equalization which was considered not to cause jealousy economy. The gulf between rich population of poor people is not wide.
Poverty
The number of poor people by the year 2013 based on BPS data DIY Province decreased 17.2 thousand or 2.71% to 616.3 thousand people, from his position in 2012 is 633.5 thousand inhabitants. The number of poor by BPS is calculated based on the individual’s basic needs are assessed in the form of dollars. In December 2013, the poverty line is based on food expenditure is Rp141.597,00 per capita per month, while the poverty line is Rp194.830,00 total per capita per month (BPS Prov. DIY, 2014). Based on the poor data processing which can be produced poverty gap index (poverty gap index, P1) and poverty severity index (poverty severity index, P2) which can show the other side of the problem of poverty? P1 is the gap between the average standard of living of the population is under the poverty line to the poverty line. P2 is a gap between the poor. In 2013, the rate of P1 and P2 is relatively low, compared to the conditions in 2012, respectively 3.35 and 0.92 (December 2012: 3.80 and 1.12). This means that the level of the gap decreases, so that eforts can be said to be relatively successful eradication. Based on spatial distribution, poor population in 2013 is spread almost evenly, ie 52.60% in urban areas and 47.40% in rural areas (BPS Prov. DIY, 2014). Most of them are the poor farmers from 472 082 farming households in the province in 2012, 80.29% of whom are small farmers, that farmers with small and micro enterprises scale land holdings of less than half a hectare. When compared with the conditions of poverty at the national level, the poverty rate in the province is still higher than the national poverty level.
Implementation of Triple Helix Model
boundary.. Each region has its administrative borders were deined formally through legislation. In reality, the problems and interests often arise as a result of the functional relationships in the socio-economic ield that passes through the boundaries of the administrative region. In this context, the main reason for the necessary cooperation between local governments is that traic problems can be resolved along the administrative area and vice versa so many potentials can be exploited for the mutual beneit. The consequence is the need to reform microorganizationnal abilities of Governments at the local level, namely the form of public management reforms to be aware of the current government and not merely ix macroorganizational capacities at the central level. In other words, improvement in the ability of institutions under the central government is indispensable. The other reason why it’s needed to cooperate between local governments areas follows:
1. The parties may cooperate to form a larger force. With cooperation among local governments, the strength of each area can be synergized cooperation to confront environmental threats or problems that complicated nature than when handled separately. The government can work together to overcome environmental obstacles or reach a higher level of productivity. 2. The parties which cooperate can get the higher progress. With cooperation,
each region will transfer the intelligence, skill, and information, for example, one area of learning or skill advantages of the other region. Each region will strive to advance or develop themselves of learning outcomes together.
3. The parties can cooperate more helpless. With the cooperation, each region involved a beter bargaining position or able to ight for their interests to the higher government structures beter. If an area in its own ight for their interests may be less noticeable, but when entered into a member of a regional cooperation forum, the sound will be considered.
4. The parties which cooperate can reduce or prevent conlict. With the cooperation, areas that previously competing or already involved in the conlict, can be more tolerant and try to take advantage or learn from the conlict.
5. Each party is felt justice. Each region will ind itself not harmed because there is no transparency in the relationship of cooperation. Each region which involved cooperation has equal access to information created or used.
addressed, namely 1) strengthening the role and ability of provinces in organizing the functions of cooperation between regions or local government cooperation, 2) determine areas which can or should be cooperated, and 3) models of cooperation in accordance with the nature of these ields. These issues are considered strategic because of its position largely determines the success of cooperation among local governments in the future.
end, Bank Indonesia decided to keep the BI Rate at 6.50%, which is still considered necessary in accordance with the climate in the process of the ongoing economic recovery, consistent with achieving the inlation target in 2013 and 2014 by 5 + 1%. Bank Indonesia policy strategy remains geared to maintain a balance between encouraging real sector, maintaining price stability, maintaining the conidence of inancial markets and guarding the integrity of the inancial system. Economic growth in 2013 reached 6.0% In addition, Indonesia has the opportunity to increase ratings reach investment grade in 2014 so that the capital inlow from outside is increasing. At some future time have to take into account the uncertainty of the economic recovery of developed countries, inlationary pressures due to rising prices administed such as Liquid Petroleum Gas (LPG), and the impact of weather anomalies on domestic food production and the uncertainty of international food prices. The Government and Bank Indonesia can address rising inlationary pressures and adjusting the monetary policy response is needed to ensure that inlation remains within the range of targets which have been set, namely 5% ± 1% in 2013 and 2014.
CONCLUSION
As a privileged area and has many well-known, qualiied universities, Yogyakarta Province has the advantage in the provision of experts to help local economic development thinking. Through various studies conducted by experts from academician, business people and government gain scientiic view basis to develop a variety of business sectors developed in Yogyakarta. Cooperation between local government, the business community and academician (triple helix) has contributed to the development of the local economy at DIY Province which more based on the development of creative economy as a result of the economic development of DIY scientiic study conducted by academician. Various economic studies have subsequently followed up by the local government and the business community to develop the local economy in the province. DIY provinces which do not have natural resources - except superior human resources - are able to develop the local economy with a demonstrated increase in GDP contribution to the formation of the budget, leading to a boost prosperity and reduce poverty population in the province.
References
Ariin, Bustanul. 2005. “Pengembangan Ekonomi Daerah Melalui Strategi Demand Driven”. Lampung.
Azis, Iwan Jaya. 1994. Ilmu Ekonomi Regional dan Beberapa Aplikasinya di Indonesia. Lembaga Penerbit Fakultas Ekonomi Universitas Indonesia. Jakarta.
Badan Pusat Statistik. 2007. BPS Provinsi DIY dalam Analisis PDRB Provinsi DIY Tahun 2002-2006.
Badan Pusat Statistik. 2008. Indeks Pembangunan Manusia Indonesia. 2001-2007. Jakarta. Badrudin, Rudy. 2010. Analisis Surplus Deisit Anggaran Pendapatandan Belanja Daerah
(APBD) Kabupaten/Kota di Indonesia Tahun Anggaran 2007. Laporan Penelitian.
Tidakdipublikasikan. Pusat Penelitiandan Pengabdianpada Masyarakat STIE YKPN. Yogyakarta.
Balai Pustaka. 2002. Kamus Besar Bahasa Indonesia (KBBI).Edisi 3. Jakarta.
Bank Indonesia, Laporan Perkembangan Perekonomian Provinsi DIY Triwulan II Tahun 2010.
__________, Laporan Bank Indonesia Perekonomian Indonesia, Triwulan III Tahun 2010. Badan Perencanaan Daerah Provinsi Daerah Istimewa Yogyakarta. 2008. Rencana
Pembangunan Jangka Panjang Daerah Istimewa Yogyakarta (RPJP DIY) Tahun 2005–2025. Yogyakarta.
Bird, Richard M. dan Francois Vaillancourt, 2000. Desentralisasi Fiskal di Negara-Negara Berkembang. Terjemahan. PT Gramedia Pustaka Utama. Jakarta.
Bratakusumah, Deddy Supriady. 2002. Peta Kemampuan Keuangan Provinsidalam Era Otonomi Daerah: Tinjauanatas Kinerja PAD dan Upaya yang Dilakukan Daerah.
htp://www.bappenas.go.id. Download 31 Agustus 2010. Jakarta.
Budiono. 1992. Seri Sinopsis PengantarIlmu Ekonomi No. 4: Teori Pertumbuhan Ekonomi.BPFE. Yogyakarta
Cooper, Donald R. and C. William Emory. 1996. Business Research Methods. 5th ed. Chicago: Richard D. Irwin.
Dariwardani, Ni Made Inna dan Siti Noor Amani. (2008). Kinerja Propinsi di Indonesia Sebelumdan Setelah Pemberlakukan Otonomi Daerah. Download 31 Augusts 2010. Jakarta. Darwanto, Herry. 2002. “Prinsip Dasar Pembangunan Ekonomi Daerah”. Jakarta.
Dendi, Astia, Rifai S. Haryono, dkk. 2007. Forum Pengembangan Ekonomi Lokal: Konsep, Strategi, danMetode (Perspektipdan Pengalaman Nusa Tenggara).
Djojohadikusumo, Sumitro. 1994. Perkembangan Pemikiran Ekonomi: Dasar Teori Ekonomi Pertumbuhandan Ekonomi Pembangunan. LP3ES. Jakarta.
Fuad, Noor dkk. 2005. Dasar-Dasar Keuangan Publik. Lembaga Pengkajian Keuangan Publikdan Akuntansi Pemerintahan. (LPKPAP). Badan Pendidikandan Pelatihan Keuangan. Jakarta.
Hirawan, Susiyati Bambang. 2007. Desentralisasi Fiskalsebagai Suatu Upaya Meningkatkan Penyediaan Layanan Publik (Bagi Orang Miskin) di Indonesia.
Hyman, David N. 1999. Public Finance: A Contemporary Application of Theory to Policy. The Dryden Press. Florida.
Kaban, Yeremias T., Kerjasama Antar Pemerintah Daerah dalam Era Otonomi: Isu Strategis, Bentukdan Prinsip. Yogyakarta.
Kadiman, Kusmayanto, 2005. The Triple Helix and The Public. Dipresentasikanpada Seminar on Balanced Perspective in Business Practices, Governance, and Personal Life. Jakarta. Kaloh, J. 2003. Kepala Daerah: PolaKegiatan, Kekuasaan, danPerilaku Kepala Daerah dalam
Pelaksanaan Otonomi Daerah. PT Gramedia PustakaUtama. Jakarta.
Kohli, Atul. 1987. Demokrasidan Pembangunan dalam Mengkaji Ulang Strategi-Strategi Pembangunan. Penerbit Universitas Indonesia. Jakarta.
Kuncoro, Mudrajad. 1997. Ekonomi Pembangunan: Teori, Masalah, dan Kebijakan. UPP AMP YKPN. Yogyakarta..
Malizia, Emil E. dan Edward J. Feser. 1999. Understanding Local Economic Development. Center for Urban Policy Research. New Brunswick, New York: CUPR Press.
Musgrave, Richard A. dan Peggy B. Musgrave. 1991. Public Finance in Theory and Practice. Mc-Graw-Hill Book Co. Singapore.
Mulyana, Budi, Subkhan, danKuwat Slamet. 2006. Keuangan Daerah: Perspektif Desentralisasi Fiskaldan Pengelolaan ABBD diIndonesia. Lembaga Pengkajian Keuangan Publikdan Akuntansi Pemerintahan.(LPKPAP). Badan Pendidikandan Pelatihan Keuangan. Jakarta.
Pusat Kajian Kinerja Otonomi Daerah. 2007. Kajian Peningkatan Peran Propinsi Dalam Membangun Kerjasama Antar Daerah: Executive Summary. Jakarta.
Saragih, Juli Panglima. 2003. Desentralisasi Fiskaldan Keuangan Daerah dalam Otonomi. Penerbit Ghalia Indonesia. Jakarta.
Sekretariat Negara. 2004. Undang-Undang Nomor 32 Tahun 2004 tentang Pemerintahan Daerah.Jakarta.
____________. 2004. Undang-Undang Nomor 33 Tahun 2004 tentang Perimbangan Keuanganantara Pemerintah Pusatdan Pemerintah Daerah. Jakarta.
____________. 2005. Peraturan Pemerintah Nomor 58 Tahun 2005 Tentang Pengelolaan Keuangan Daerah.
____________. 2005. Peraturan Pemerintah Nomor 79 Tahun 2005 Tentang Pedoman Pembinaandan Pengawasan Penyelenggaraan Pemerintahan Daerah.
_____________. 2006. Peraturan Menteri Keuangan Nomor 72 Tahun 2006 Tentang Pengelolaan Keuangan Daerah.
____________. 2007. Peraturan Pemerintah Republik Indonesia Nomor 41 Tahun 2007 Tentang Organisasi Perangkat Daerah.
____________. 2007. Peraturan Pemerintah Republik Indonesia Nomor 50 Tahun 2007 Tentang Tata Cara Pelaksanaan KerjaSama Daerah.
____________. 2009. Peraturan Menteri Dalam Negeri Nomor 22 Tahun 2009 tentang Petunjuk Teknis Tata Cara Kerjasama Daerah.
Sekretariat Pemerintah Provinsi DIY. Peraturan Daerah Nomor 2 Tahun 2010 tentang Rencana Tata Ruang Wilayah Provinsi Daerah Istimewa Yogyakarta Tahun 2009-2029.
Sidik, Machfud. 2002. Perimbangan Keuangan Pusatdan Daerah sebagai Pelaksanaan Desentralisasi Fiskal (Antara Teoridan Aplikasinya di Indonesia). Makalah Seminar “SetahunImplementasi Kebijaksanaan Otonomi Daerah di Indonesia. Yogyakarta. ____________. Format Hubungan Keuangan Pemerintah Pusatdan Daerah yang
Mengacupada Pencapaian Tujuan Nasional. Makalah Seminar “Public Sector Scorecard”. Jakarta.